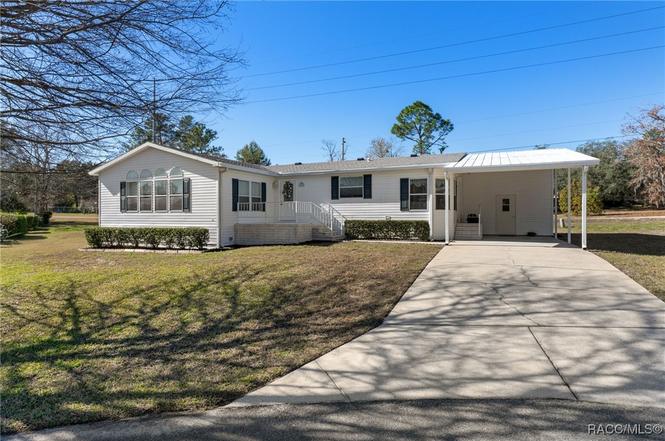
2540 E Loma Ct · Hernando, FL
Flood risk 8/10 · Major
- FEMA flood zone
- X (unshaded)
- Chance of flooding over 30 yrs
- 0.99%
- Est. flood insurance / yr
- $507 – $1,088
Fire risk 5/10 · Moderate
- Est. fire insurance / yr
- $947 – $1,759
Heat risk 9/10 · Severe
- Hot days now (above 108°F)
- 7 days/yr
- Hot days in 30 yrs
- 24 days/yr
Wind risk 9/10 · Severe
- Chance of severe wind over 30 yrs
- 99.0%
Air-quality risk 1/10 · Minimal
- Unhealthy air days now
- 0 days/yr
- Unhealthy air days in 30 yrs
- 0 days/yr
Risk factors via First Street. Map © Google.
Why this score? — see what drove the C- grade
The composite is a weighted blend of 9 inputs, each scored 0–100. Each bar is that input's sub-score; the figure is the points it added to the 100-point composite (weight × sub-score).
- Cash flow +23.9/30.0
- DSCR +7.7/10.0
- 1% rule +6.4/10.0
- Schools +4.1/10.0
- Livability +3.6/5.0
- Rent growth +2.5/5.0
- Condition / age +2.5/5.0
- ARV discount +2.0/15.0
- Appreciation +0.0/10.0
$197,900
🖨 Deal sheet (PDF) 📄 Offer letter ✓ Due diligence
Listing remarks
This one-of-a-kind home is nestled in a highly sought-after neighborhood and has been meticulously maintained to the highest standards. Truly move-in ready, it shows like new with major updates already completed, including a roof replacement in 2020 and a new AC system in 2019. Offering abundant storage and a fresh, well-cared-for feel throughout, this property is the perfect blend of comfort and peace of mind. You’ll need to see it in person to fully appreciate its charm—one look and you’re sure to fall in love.
Key facts
- New ac system
- Roof replacement
- Abundant storage
Tags
Property features AI
Finance
- HOA & community: Homeowners association with $80 monthly fee; Senior community
Exterior
- Parking: Attached carport; Driveway; Concrete parking surface; 1 total parking space
- Security: Smoke detector(s)
- Utilities: Private well water; Septic tank sewer
- Home design: Manufactured home (triple wide); Single-story; One-level entry
- Construction: Vinyl siding; Asphalt shingle roof; Combination foundation; Built as a manufactured home
- Exterior features: Cul-de-sac lot; Irregular lot shape; County road frontage
Interior
- Kitchen: Electric oven; Dishwasher; Microwave; Refrigerator; Water heater
- Flooring: Carpet; Vinyl
- Bathrooms: 2 full bathrooms
- Heating & cooling: Central heating (electric); Central air conditioning
- Interior features: Smoke detectors; Community pool access
- Laundry & utility: Washer; Dryer
Neighborhood map
What this means for you Summary
Snapshot
- This is a 3-bed/2.0-bath manufactured listed at $198k.
Deal economics
- At list price, monthly cash flow is $318 ($4k/yr) — positive.
- The deal already cash-flows at list — no discount required.
- Meets the 1% rule at list price ($2k rent vs $198k).
- Recommended offer: $174k (12.0% below list) — sets the bar for market timing.
- Cap rate 8.6% vs local median 5.6% in Hernando — top-decile yield for the area; either an underpriced asset or a hidden risk that comps aren't pricing in. Stress-test before assuming the spread holds.
Location & tenants
- Location reads 71/100 on livability (#402 in FL) — a middle-class / working-renter tenant base. Strengths: cost of living A+, housing A+, health & safety A+; Watch: amenities F, commute F, employment D-.
- Citrus (rural): math 49% / reading 50% proficiency, ranked #44 of 73 in FL (top 60%) — families likely to look elsewhere, expect single-tenant / working-renter base with shorter leases.
- Zoned schools: Central Ridge Elementary School (math 41% / reading 44%, grade F, #1,383 of 2,144 statewide, top 65%, 723 students, 64% FRL); Citrus Springs Middle School (math 55% / reading 54%, grade B-, #183 of 571 statewide, top 34%, 821 students, 59% FRL); Citrus High School (math 34% / reading 51%, grade F, #264 of 667 statewide, top 41%, 1,503 students, 54% FRL) — zoned schools at 59% FRL track the district average.
- Market conditions: 444 active listings in the ZIP; 6 comparable units currently listed for rent nearby; rentals at typical pace (median 22d on market — plan ~3-4 weeks tenant-placement turnaround); 2,443 units permitted in Citrus County in 2024 (0 in 5+ unit buildings).
- At $2,260/mo this rent would consume 47% of the median local household income ($57k/yr) (locally 314% of renters already pay >50% of income on rent) — very limited rent-growth headroom before tenants either downsize or default.
Forward outlook
- Local home prices are declining (-3.0%/yr); year-one equity from $1k of loan paydown is wiped out by about $6k of value loss. Plan a longer hold.
- Citrus County population projected to shrink 10% by 2050 — rents likely to lag national; underwrite the cash flow, not the appreciation.
Negotiation context
- It's been on market 183 days — a 12% lower offer ($174k) is reasonable based on typical stale-listing flexibility.
Risks & watch-outs
- Watch-outs: flood insurance adds $66/mo.
- Climate carrying-cost: severe flood risk; severe wind risk, 99% chance of damaging wind over 30y; moderate wildfire risk; extreme-heat days projected 7→24/yr by 2055 (HVAC capex compounding) — expect insurance premiums to compound above CPI over the hold.
Questions for the listing agent
- It's been on market 183 days. Have you received any prior offers? Is the seller open to a 12% concession, seller financing, or rate buy-down credit?
- What's the actual annual flood-insurance premium (NFIP or private), and is the property in a SFHA with mandatory coverage?
- What does the HOA fee cover, when was the last increase, and are there any pending special assessments or reserve-fund shortfalls?
- Why hasn't it sold? Are there any deal-killer items the seller is aware of (foundation, flood, title, zoning, code violations)?
- Is there a deadline driving the sale (1031 exchange, divorce, estate, relocation)? That informs how much negotiation room exists.
- What's the average days-on-market for RENTAL listings here right now (not sales)? A rising rental-DOM trend means longer vacancies and softer asking-rent achievability than the comps imply.
- What's the recent tenant-quality profile in this submarket — average credit score on applications, eviction rate, late-payment / NSF rate, and stable-employment percentage? A property-management company in the area should have these aggregated.
- How much new for-sale + rental construction is in the pipeline within 1–3 miles? Heavy new supply typically softens prices + rents 12–24 months out; constrained supply supports both.
Investment metrics
- 1% rule
- 1.14% ✓
- Cap rate
- 8.62%
- Cash-on-cash
- 8.32%
- DSCR
- 1.37
- GRM
- 7.3
CMA / ARV
- ARV (on-the-fly)
- $176,344
- Comps found
- 1
Show comp detail 1 sale within ~0.75 mi
| Address | Dist | Beds/Ba | Sqft | Sold | Price | $/sf | Match |
|---|---|---|---|---|---|---|---|
| 2211 N Croft Ave | 0.41mi | 3/2.0 | 1,596 (-15%) | 2mo | $150,000 | $94 | 54 |
Match score weights: distance 35% · size 25% · config 20% · recency 20%. Top-matched comps best support the ARV.
Projected returns pro-forma
-3.0% appreciation · 3.0% rent growth · sell at horizon
- IRR
- -5.7%
- Equity multiple
- 0.79×
- Total profit
- $-11,736
- Equity at exit
- $29,508
- IRR
- 4.0%
- Equity multiple
- 1.29×
- Total profit
- $16,226
- Equity at exit
- $17,111
Cash invested: $55,412 (down + closing). Projections, not guarantees.
Landlord ↔ Tenant lean methodology
- Overall (STATE)
- 87 Strongly Landlord-Friendly
- State Florida
- 87 Strongly Landlord-Friendly · R+3
- County
- — inherits STATE
- City
- — inherits STATE
ZIP-level market 34442
- Home prices YoY
- -21.9%
- Active inventory
- 444
- Price-to-rent
- 7.3×
Monthly cashflow live
- Estimated rent
- $2,260 high interval (Pro) →
- Mortgage (P&I)
- −$1,038
- Tax from tax record
- −$201 /mo · $2,412/yr
- Insurance
- −$82
- Flood insurance flood zone
- −$66 /mo · $798/yr
- HOA
- −$80
- Vacancy / Maint / Mgmt
- −$475
- Net cashflow
- $318
Break-even live
Sensitivity live
| Price | -10% $430 | -5% $374 | +0% $318 | +5% $262 | +10% $206 |
|---|---|---|---|---|---|
| Rent | -10% $139 | -5% $228 | +0% $318 | +5% $407 | +10% $496 |
| Rate | -1.0pp $417 | -0.5pp $368 | base $318 | +0.5pp $266 | +1.0pp $214 |
UW: 25.0% down · 7.5% · 30yr · 1.5% tax · 5.0% vac · 8.0% maint · 8.0% mgmt
Financing live
Cash to close
- Down payment
- $49,475
- Closing costs
- $5,937
- Reserves months
- —
- Total cash needed
- —
Loan-product check · same deal, 3 products live
Conventional
25% down · 7.5% · 30yr
- Down + closing
- —
- Monthly P&I
- —
- Monthly cashflow
- —
- DSCR
- —
- Eligible?
- —
Personal DTI + credit; lowest rate.
DSCR
20% down · 8.5% · 30yr
- Down + closing
- —
- Monthly P&I
- —
- Monthly cashflow
- —
- DSCR
- —
- Eligible?
- —
No personal income docs; deal must DSCR.
Hard money
10% down · 12.0% · 12mo
- Down + closing
- —
- Monthly P&I
- —
- Monthly cashflow
- —
- DSCR
- —
- Eligible?
- —
Short-term bridge; refi at stabilization.
Rent comps 6 comps
| Address | Beds | Baths | Sqft | Rent | $/sqft | DOM | Units | Dist |
|---|---|---|---|---|---|---|---|---|
| 2961 E Brigadoon Ct Hernando, FL | 4.0 | 2.0 | 1620 | $2,300 | $1.42 | 21d | 1 | 0.65mi |
| 2675 N Canterbury Lake Dr Hernando, FL | 3.0 | 2.0 | 1855 | $2,000 | $1.08 | 21d | 1 | 0.90mi |
| 3723 N Chandler Dr Hernando, FL | 3.0 | 2.0 | 1726 | $2,400 | $1.39 | 21d | 1 | 1.12mi |
| 2858 E Marcia St Inverness, FL | 4.0 | 2.0 | 1790 | $2,500 | $1.40 | 21d | 1 | 1.19mi |
| 2620 E Newhaven St Inverness, FL | 3.0 | 2.0 | 1884 | $2,400 | $1.27 | 21d | 1 | 1.22mi |
| 1471 E Saint James Loop Inverness, FL | 3.0 | 2.0 | 1228 | $1,700 | $1.38 | 21d | 1 | 1.27mi |
HOA detail
- Monthly dues
- $80 · $960/yr
Listing history 18 events
-
2026-06-19days on market $197,900 Active 183 DOM
-
2026-06-18days on market $197,900 Active 182 DOM
-
2026-06-17days on market $197,900 Active 181 DOM
-
2026-06-16days on market $197,900 Active 180 DOM
-
2026-06-15days on market $197,900 Active 179 DOM
-
2026-06-14days on market $197,900 Active 177 DOM
-
2026-06-13days on market $197,900 Active 176 DOM
-
2026-06-09days on market $197,900 Active 173 DOM
-
2026-06-08days on market $197,900 Active 172 DOM
-
2026-06-03days on market $197,900 Active 167 DOM
-
2026-06-02days on market $197,900 Active 166 DOM
-
2026-06-01days on market $197,900 Active 165 DOM
-
2026-05-31days on market $197,900 Active 164 DOM
-
2026-05-30days on market $197,900 Active 163 DOM
-
2026-05-23price $197,900
-
2026-02-25price $204,900
-
2026-01-24price $229,900
-
2025-12-18$259,900 Active
ⓘ Source: listings_history table (triggers on properties + properties_extension) + one-shot
backfill from property_details.listing_events for pre-trigger history.
Tax reassessment forecast FL · Resets to sale price
- Current annual tax
- $2,412 · $201/mo
- Projected year-2 tax
- $2,412 · $201/mo
- Expected delta
- $0/yr ($0/mo · 0.0%)
ⓘ Screening estimate from a state-policy table — verify with the county assessor before closing.
Climate risk First Street
- Flood 8/10 Severe FEMA zone X (unshaded) · 99% chance over 30 yrs
- Wildfire 5/10 Major
- Heat 9/10 Extreme 7 d/yr ≥108°F today · 24 d/yr by 30 yrs out
- Wind 9/10 Extreme 99% chance of damaging wind over 30 yrs
- Air quality 1/10 Low 0 unhealthy d/yr today · 0 by 30 yrs out
Nearby sold comps map
Loading sold comps map…
Walkable amenities ~0.75 mi
Loading nearby amenities…
Taxation est. · year 1
- Rental income
- $27,121
- − Mortgage interest
- −$11,085
- − Property taxes
- −$2,412
- − Insurance
- −$1,787
- − Repairs & maintenance
- −$2,170
- − Management
- −$2,170
- − HOA
- −$960
- − Depreciation
- −$5,757
- Taxable income
- $780
- Est. tax owed @ 24.0%
- −$187
- After-tax cash flow
- $3,626/yr
For passive investors: Depreciation is non-cash, so a rental often shows a tax loss while cash-flowing — sheltering income. Rental losses are passive: they offset passive income freely, and up to $25,000/yr can offset ordinary (W-2) income if you actively participate and your MAGI is under $100k (phasing out to $0 by $150k); unused losses carry forward. On sale, claimed depreciation is recaptured at up to 25%, and gains may owe capital-gains tax (a 1031 exchange can defer both). Figures are a year-1 estimate at your 24.0% rate — not tax advice; consult a CPA.
Schools (NCES district)
- District
- Citrus
- NCES district ID
- 1200270
- Math proficiency
- 49% ▼ -10.00%
- Reading proficiency
- 50% ▼ -6.00%
- Median HH income
- $38,618
- Composite
- 41.28/100
- National rank
- #3519
- State rank
- #44 of 73 in FL
Livability — Hernando
- Score
- 71/100
- State rank
- #402
- US rank
- #7137
Category grades
Schools grade is shown separately in the Schools card above.
Census & demographics
- Census place
- Hernando, FL
- County
- Citrus County · 111,314 people
- City population
- 17,281
- Metro
- Homosassa Springs, FL
- Population (ZIP)
- 17,281
- Household income
- $57,259
- Rent vs Own
- Severe rent burden
- 314.0
Population outlook (Citrus County) Hauer SSP2
- Today (2025)
- 138,622 people
- By 2030
- 136,886 · -1.3%
- By 2040
- 132,009 · -4.8%
- By 2050
- 125,196 · -9.7%
- By 2075
- 108,570 · -21.7%
- By 2100
- 84,454 · -39.1%
Race, ethnicity, and origin ACS 2023
- Neighborhood character
- Predominantly White (90%)
- Race & ethnicity
- White 90% Hispanic / Latino 4% Two or more races 3% Asian 2% Black 2%
- Common ancestry
- Romanian 4% Slovak 4% Lithuanian 3%
- Foreign-born
- 8% · Canada, China, South Korea
- Languages at home
- 93% English-only · Spanish 3% German/W. Germanic 2% Tagalog/Filipino 1%
Political lean MEDSL · Citrus
- 2024 margin
- Solid R (+45.9) · D 26.8% · R 72.6%
- 2008→2024 swing
- -29.8pp toward R · 2008: -16.1pp · 2024: -45.9pp
- All cycles
- 2024: R+45.9 2020: R+41.0 2016: R+39.7 2012: R+21.9 2008: R+16.1
Not yet ingested
- Civics
- —
Market trends
- HPI YoY
- ▼ -76.70%
- Current HPI
- 273.3262
- Rent YoY
- —
- Metro
- Homosassa Springs, FL
- State GDP YoY
- ▲ 3.28%
- F500 in state
- 36
Industry mix (Fortune 500 HQ in FL)
| Industry | F500 HQs | Revenue |
|---|---|---|
| Industrial Technology | 2 | $29B |
|
||
| Insurance | 2 | $17B |
|
||
| Retail | 1 | $60B |
|
||
| Technology Distribution | 1 | $58B |
|
||
| Homebuilding | 1 | $35B |
|
||
| Technology Manufacturing | 1 | $35B |
|
||
Price history
-23.9% since first listed4 events — show timeline
- 2026-05-23 Price Changed $197,900 RACC
- 2026-02-25 Price Changed $204,900 RACC
- 2026-01-24 Price Changed $229,900 RACC
- 2025-12-18 Listed $259,900 RACC
Property tax history
+14.3%/yrLatest (2025): $2,412 · +3.2% YoY. Source: county tax records.
Cash-flow waterfall
monthlySold comps — $/sqft
last 12 mo · ≤1 miLoading sold comps…