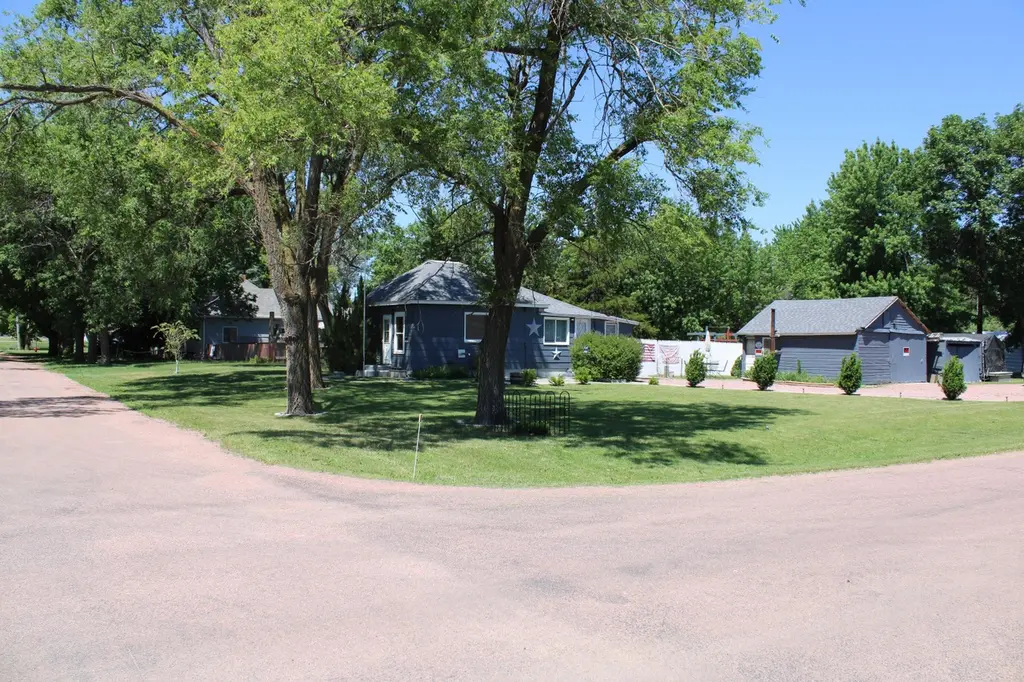
310 N 1st Ave · Stickney, SD
Flood risk 1/10 · Minimal
- FEMA flood zone
- X (unshaded)
- Chance of flooding over 30 yrs
- 0.0%
- Est. flood insurance / yr
- $473 – $860
Fire risk 4/10 · Minor
- Est. fire insurance / yr
- $1,342 – $2,492
Heat risk 3/10 · Minor
- Hot days now (above 103°F)
- 7 days/yr
- Hot days in 30 yrs
- 14 days/yr
Wind risk 2/10 · Minimal
- Chance of severe wind over 30 yrs
- —
Air-quality risk 2/10 · Minimal
- Unhealthy air days now
- 1 days/yr
- Unhealthy air days in 30 yrs
- 1 days/yr
Risk factors via First Street. Map © Google.
Why this score? — see what drove the B+ grade
The composite is a weighted blend of 9 inputs, each scored 0–100. Each bar is that input's sub-score; the figure is the points it added to the 100-point composite (weight × sub-score).
- Cash flow +30.0/30.0
- 1% rule +10.0/10.0
- DSCR +10.0/10.0
- ARV discount +7.5/15.0
- Appreciation +5.0/10.0
- Schools +5.0/10.0
- Livability +3.4/5.0
- Rent growth +2.5/5.0
- Condition / age +2.2/5.0
$44,900
🖨 Deal sheet 📄 Offer letter ✓ Due diligence
Key facts
- Minutes from i-90
- Small town living
- Detached garage
Tags
Property features AI
Exterior
- Parking: Detached parking
- Utilities: Other water source
- Home design: Single-family residence; One story
- Construction: Frame construction; Below-grade finished area present
- Exterior features: Residential zoning
Interior
- Bathrooms: 1 full bathroom
- Heating & cooling: Propane heating
- Interior features: Crawl space basement; Total of 5 rooms
Neighborhood map
What this means for you Summary
Snapshot
- This is a 2-bed/1.0-bath single-family listed at $45k. Condition is rated fair.
Deal economics
- At list price, monthly cash flow is $344 ($4k/yr) — positive.
- The deal already cash-flows at list — no discount required.
- Meets the 1% rule at list price ($828 rent vs $45k).
Location & tenants
- Location reads 67/100 on livability (#110 in SD) — a middle-class / working-renter tenant base. Strengths: cost of living A+, housing A+, schools A-; Watch: crime F, amenities F, commute F.
- Market conditions: 5 active listings in the ZIP; 7 units permitted in Aurora County in 2024 (0 in 5+ unit buildings).
Forward outlook
- In year one you build about $2k of equity ($310 loan paydown + $1k appreciation (3.0% local appreciation)).
- Aurora County population projected at +26% by 2050 — long-run rental-demand tailwind backs the buy-and-hold thesis.
- At projected returns (3.0% appreciation + 3.0% rent growth), your $13k cash investment doubles in ~3 years — after that, you're playing with house money.
Negotiation context
- Only 12 days on market — expect competitive offers; lowballing is unlikely to land.
Risks & watch-outs
- Watch-outs: built in 1910 — expect roof / HVAC / electrical / plumbing capex.
Questions for the listing agent
- Have any recent inspections been done? Can we get a copy of the seller's disclosures and any deferred-maintenance estimates?
- Built in 1910 — when were the roof, HVAC, electrical panel, plumbing, and water heater last replaced?
- Is there a deadline driving the sale (1031 exchange, divorce, estate, relocation)? That informs how much negotiation room exists.
- Schools are A-rated — typically a magnet for longer-tenancy family renters. What's the average tenant stay here, and is there a school-zone premium baked into asking?
- Crime grade is F in this area — have there been break-ins, vandalism, or insurance claims at this property in the last 3 years? What carrier currently insures it and at what premium?
- What's the average days-on-market for RENTAL listings here right now (not sales)? A rising rental-DOM trend means longer vacancies and softer asking-rent achievability than the comps imply.
- What's the recent tenant-quality profile in this submarket — average credit score on applications, eviction rate, late-payment / NSF rate, and stable-employment percentage? A property-management company in the area should have these aggregated.
- How much new for-sale + rental construction is in the pipeline within 1–3 miles? Heavy new supply typically softens prices + rents 12–24 months out; constrained supply supports both.
Investment metrics
- 1% rule
- 1.84% ✓
- Cap rate
- 15.47%
- Cash-on-cash
- 32.79%
- DSCR
- 2.46
- GRM
- 4.5
CMA / ARV
No comps found within radius.
Projected returns pro-forma
3.0% appreciation · 3.0% rent growth · sell at horizon
- IRR
- 38.5%
- Equity multiple
- 3.17×
- Total profit
- $27,300
- Equity at exit
- $20,189
- IRR
- 38.5%
- Equity multiple
- 6.29×
- Total profit
- $66,547
- Equity at exit
- $31,114
Cash invested: $12,572 (down + closing). Projections, not guarantees.
Landlord ↔ Tenant lean methodology
- Overall (STATE)
- 83 Strongly Landlord-Friendly
- State South Dakota
- 83 Strongly Landlord-Friendly · R+16
- County
- — inherits STATE
- City
- — inherits STATE
ZIP-level market 57375
- Active inventory
- 5
- Price-to-rent
- 4.5×
Monthly cashflow live
- Estimated rent
- $828 medium interval (Pro) →
- Mortgage (P&I)
- −$235
- Tax est. 1.5%
- −$56 /mo · $674/yr
- Insurance
- −$19
- HOA
- −$0
- Vacancy / Maint / Mgmt
- −$174
- Net cashflow
- $344
Break-even live
UW: 25.0% down · 7.5% · 30yr · 1.5% tax · 5.0% vac · 8.0% maint · 8.0% mgmt
Financing live
Cash to close
- Down payment
- $11,225
- Closing costs
- $1,347
- Reserves months
- —
- Total cash needed
- —
Loan-product check · same deal, 3 products live
Conventional
25% down · 7.5% · 30yr
- Down + closing
- —
- Monthly P&I
- —
- Monthly cashflow
- —
- DSCR
- —
- Eligible?
- —
Personal DTI + credit; lowest rate.
DSCR
20% down · 8.5% · 30yr
- Down + closing
- —
- Monthly P&I
- —
- Monthly cashflow
- —
- DSCR
- —
- Eligible?
- —
No personal income docs; deal must DSCR.
Hard money
10% down · 12.0% · 12mo
- Down + closing
- —
- Monthly P&I
- —
- Monthly cashflow
- —
- DSCR
- —
- Eligible?
- —
Short-term bridge; refi at stabilization.
Listing history 9 events
-
2026-06-18days on market $44,900 Active 12 DOM
-
2026-06-17days on market $44,900 Active 11 DOM
-
2026-06-16days on market $44,900 Active 10 DOM
-
2026-06-15days on market $44,900 Active 9 DOM
-
2026-06-13days on market $44,900 Active 7 DOM
-
2026-06-12days on market $44,900 Active 6 DOM
-
2026-06-09days on market $44,900 Active 3 DOM
-
2026-06-08days on market $44,900 Active 2 DOM
-
2026-06-08$44,900 Active 1 DOM
ⓘ Source: listings_history table (triggers on properties + properties_extension) + one-shot
backfill from property_details.listing_events for pre-trigger history.
Climate risk First Street
- Flood 1/10 Low FEMA zone X (unshaded) · 0% chance over 30 yrs
- Wildfire 4/10 Moderate
- Heat 3/10 Moderate 7 d/yr ≥103°F today · 14 d/yr by 30 yrs out
- Wind 2/10 Low
- Air quality 2/10 Low 1 unhealthy d/yr today · 1 by 30 yrs out
Nearby sold comps map
Loading sold comps map…
Walkable amenities ~0.75 mi
Loading nearby amenities…
Taxation est. · year 1
- Rental income
- $9,931
- − Mortgage interest
- −$2,515
- − Property taxes
- −$674
- − Insurance
- −$224
- − Repairs & maintenance
- −$794
- − Management
- −$794
- − Depreciation
- −$1,306
- Taxable income
- $3,623
- Est. tax owed @ 24.0%
- −$870
- After-tax cash flow
- $3,253/yr
For passive investors: Depreciation is non-cash, so a rental often shows a tax loss while cash-flowing — sheltering income. Rental losses are passive: they offset passive income freely, and up to $25,000/yr can offset ordinary (W-2) income if you actively participate and your MAGI is under $100k (phasing out to $0 by $150k); unused losses carry forward. On sale, claimed depreciation is recaptured at up to 25%, and gains may owe capital-gains tax (a 1031 exchange can defer both). Figures are a year-1 estimate at your 24.0% rate — not tax advice; consult a CPA.
Condition & rehab AI · 13 photos
The home requires moderate repairs and maintenance, including painting and landscaping, to improve its condition and value.
Repairs flagged
- Moderate Siding — Weathered and needs repainting
- Moderate Paint — Faded and needs touch-up
Value-add opportunities
- Both Painting and repainting the exterior and interior — Enhances curb appeal and interior aesthetics
- Both Landscaping and trimming trees — Improves curb appeal and adds value
- Both Re-carpeting or installing hardwood flooring — Enhances interior aesthetics and adds value
Renovation cost estimate screening
| Repair item | Severity | Est. cost |
|---|---|---|
| Siding · Weathered and needs repainting | Moderate | $3,000–15,000 |
| Paint · Faded and needs touch-up | Moderate | $3,000–15,000 |
| Total estimated repair cost · 2 items | $6,000–30,000 |
Value-add ROI direction
- Both Painting and repainting the exterior and interior — Enhances curb appeal and interior aesthetics ↑
- Both Landscaping and trimming trees — Improves curb appeal and adds value ↑
- Both Re-carpeting or installing hardwood flooring — Enhances interior aesthetics and adds value ↑
ⓘ Cost ranges are severity-bucket heuristics (US national rule-of-thumb). Get contractor quotes + a written scope before underwriting a rehab budget.
Schools (NCES district)
No district data.
Livability — Stickney
- Score
- 67/100
- State rank
- #110
- US rank
- #11195
Category grades
Schools grade is shown separately in the Schools card above.
Census & demographics
- Census place
- Stickney, SD
- Population (ZIP)
- 590
Population outlook (Aurora County) Hauer SSP2
- Today (2025)
- 2,955 people
- By 2030
- 3,037 · +2.8%
- By 2040
- 3,326 · +12.6%
- By 2050
- 3,708 · +25.5%
- By 2075
- 5,060 · +71.2%
- By 2100
- 7,040 · +138.2%
Race, ethnicity, and origin ACS 2023
- Neighborhood character
- Predominantly White (89%)
- Race & ethnicity
- White 89% Two or more races 8% Hispanic / Latino 4% Asian 1%
- Common ancestry
- Iranian 24% Portuguese 5% Romanian 2%
- Foreign-born
- 1%
- Languages at home
- 94% English-only · Spanish 5% Tagalog/Filipino 1%
Political lean MEDSL · Aurora
- 2024 margin
- Solid R (+54.1) · D 21.7% · R 75.8% · Other 2.5%
- 2008→2024 swing
- -44.8pp toward R · 2008: -9.3pp · 2024: -54.1pp
- All cycles
- 2024: R+54.1 2020: R+52.3 2016: R+45.1 2012: R+17.7 2008: R+9.3
Not yet ingested
- Civics
- —
Market trends
- HPI YoY
- —
- Current HPI
- —
- Rent YoY
- —
- Metro
- —
- State GDP YoY
- ▲ 0.70%
- F500 in state
- 2
Industry mix (Fortune 500 HQ in SD)
| Industry | F500 HQs | Revenue |
|---|---|---|
| Utilities | 1 | $1B |
|
||
Price history
1 event — show timeline
- 2026-06-06 Listed $44,900 MBOR
Cash-flow waterfall
monthlySold comps — $/sqft
last 12 mo · ≤1 miLoading sold comps…