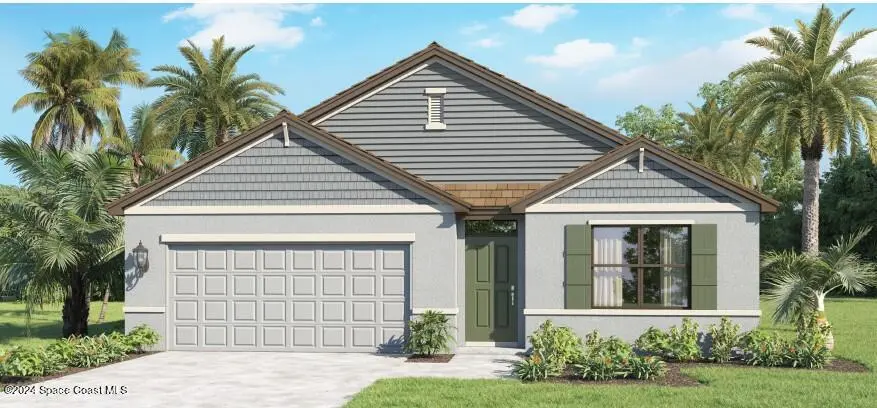
 🏗️ New Construction
3361 SW Port St Lucie St · Port St. Lucie, FL
Flood risk No data
- FEMA flood zone
- —
- Chance of flooding over 30 yrs
- —
- Est. flood insurance / yr
- —
Fire risk No data
- Est. fire insurance / yr
- —
Heat risk No data
- Hot days now (above threshold)
- —
- Hot days in 30 yrs
- —
Wind risk No data
- Chance of severe wind over 30 yrs
- —
Air-quality risk No data
- Unhealthy air days now
- —
- Unhealthy air days in 30 yrs
- —
Risk factors via First Street. Map © Google.
Why this score? — see what drove the D- grade
The composite is a weighted blend of 9 inputs, each scored 0–100. Each bar is that input's sub-score; the figure is the points it added to the 100-point composite (weight × sub-score).
- Cash flow +12.2/30.0
- ARV discount +7.5/15.0
- Schools +3.7/10.0
- DSCR +3.6/10.0
- Rent growth +2.6/5.0
- Livability +2.5/5.0
- Condition / age +2.5/5.0
- 1% rule +2.3/10.0
- Appreciation +0.0/10.0
$429,000
🖨 Deal sheet (PDF) 📄 Offer letter ✓ Due diligence
Listing remarks MLS
Great Location! Build your home on this . 23 acre lot. Centrally located near shopping and dining. Easy access to turnpike.
Key facts
- 0.23 acre lot
- 2 garage spots
- Built 2026
Property features AI
Exterior
- Parking: Attached 2-car garage; 2 covered parking spaces
- Utilities: Septic tank; Three-phase electric service; Cable available; Other water source
- Home design: Single-family residence; One story; New construction; Faces east; Built by D.R. Horton
- Construction: Stucco and CBS construction; Composition/shingle roof
- Exterior features: Covered patio; Patio
Interior
- Kitchen: Dishwasher; Electric range; Microwave; Refrigerator; Garbage disposal
- Bedrooms: 4 bedrooms on the main level
- Flooring: Carpet; Vinyl
- Bathrooms: 2 full bathrooms
- Heating & cooling: Central electric heating; Central electric air conditioning
- Interior features: Entrance foyer; Kitchen island; Walk-in closets; Split bedroom layout; Blinds on windows
- Laundry & utility: Indoor laundry; Electric water heater
Neighborhood map
What this means for you Summary
Snapshot
- This is a 4-bed/2.0-bath land listed at $429k.
Deal economics
- At list price, monthly cash flow is $-84 ($-1k/yr) — negative.
- To cash-flow at today's rent, offer at most $414k (3.5% below list).
- To meet the 1% rule (rent ≥ 1% of price), the offer needs to be $313k (27.1% below list).
- Recommended offer: $313k (27.1% below list) — sets the bar for 1% rule.
- Cap rate 6.1% vs local median 3.9% in Port St. Lucie — top-decile yield for the area; either an underpriced asset or a hidden risk that comps aren't pricing in. Stress-test before assuming the spread holds.
Location & tenants
- Location reads: area grade D — affects rentability + tenant quality, not the cash-flow math above.
- St. Lucie (urban): math 40% / reading 48% proficiency, ranked #51 of 73 in FL (top 70%) — families likely to look elsewhere, expect single-tenant / working-renter base with shorter leases.
- Zoned schools: Manatee Academy K-8 (math 53% / reading 51%, grade C-, #990 of 2,144 statewide, top 48%, 1,664 students, 65% FRL); Southern Oaks Middle School (math 39% / reading 43%, grade F, #353 of 571 statewide, top 63%, 894 students, 76% FRL); Fort Pierce Central High School (math 15% / reading 45%, grade F, #441 of 667 statewide, top 67%, 3,091 students, 62% FRL).
- Market conditions: Rents flat; 768 active listings in the ZIP; 39 comparable units currently listed for rent nearby; rentals at typical pace (median 25d on market — plan ~3-4 weeks tenant-placement turnaround); solid renter incomes; 4,868 units permitted in St. Lucie County in 2024 (268 in 5+ unit buildings).
- This rent runs 44% of the median local income ($86k/yr) — at the standard rent-burdened threshold; future hikes will face affordability resistance.
Forward outlook
- Local home prices are declining (-3.0%/yr); year-one equity from $3k of loan paydown is wiped out by about $13k of value loss. Plan a longer hold.
- St. Lucie County population projected at +20% by 2050 — long-run rental-demand tailwind backs the buy-and-hold thesis.
Negotiation context
- It's been on market 34 days — a 3% lower offer ($416k) is reasonable based on typical stale-listing flexibility.
- 6 sale attempts since 7y ago with the ask held roughly flat each time — persistent listings suggest the price (not the market) is what's stuck; bring a comps-based counter.
- Current owner paid $106k; list at $429k implies a 305% gain — meaningful room to come down on a strong offer.
Questions for the listing agent
- What do current leases actually rent for vs. the listed asking? Can we see a recent rent roll and the last 12 months of T-12 income?
- It's been on market 34 days. Have you received any prior offers? Is the seller open to a 27% concession, seller financing, or rate buy-down credit?
- Is there a deadline driving the sale (1031 exchange, divorce, estate, relocation)? That informs how much negotiation room exists.
- The area grade is low — what's the realistic commute time and amenity access for the typical tenant pool here? Any planned neighborhood developments (good or bad) we should know about?
- What's the average days-on-market for RENTAL listings here right now (not sales)? A rising rental-DOM trend means longer vacancies and softer asking-rent achievability than the comps imply.
- What's the recent tenant-quality profile in this submarket — average credit score on applications, eviction rate, late-payment / NSF rate, and stable-employment percentage? A property-management company in the area should have these aggregated.
- How much new for-sale + rental construction is in the pipeline within 1–3 miles? Heavy new supply typically softens prices + rents 12–24 months out; constrained supply supports both.
Investment metrics
- 1% rule
- 0.73% ✗
- Cap rate
- 6.06%
- Cash-on-cash
- -0.84%
- DSCR
- 0.96
- GRM
- 11.4
CMA / ARV
No comps found within radius.
Projected returns pro-forma
-3.0% appreciation · 0.22% rent growth · sell at horizon
- IRR
- -20.5%
- Equity multiple
- 0.30×
- Total profit
- $-83,593
- Equity at exit
- $63,965
- IRR
- -20.1%
- Equity multiple
- 0.05×
- Total profit
- $-113,552
- Equity at exit
- $37,092
Cash invested: $120,120 (down + closing). Projections, not guarantees.
Landlord ↔ Tenant lean methodology
- Overall (STATE)
- 87 Strongly Landlord-Friendly
- State Florida
- 87 Strongly Landlord-Friendly · R+3
- County
- — inherits STATE
- City
- — inherits STATE
ZIP-level market 34953
- Home prices YoY
- -10.1%
- Rents YoY
- 0.2%
- Active inventory
- 768
- Price-to-rent
- 11.4×
Monthly cashflow live
- Estimated rent
- $3,126 high interval (Pro) →
- Mortgage (P&I)
- −$2,250
- Tax from tax record
- −$125 /mo · $1,499/yr
- Insurance
- −$179
- HOA
- −$0
- Vacancy / Maint / Mgmt
- −$656
- Net cashflow
- $-84
Break-even live
Sensitivity live
| Price | -10% $159 | -5% $37 | +0% $-84 | +5% $-206 | +10% $-327 |
|---|---|---|---|---|---|
| Rent | -10% $-331 | -5% $-208 | +0% $-84 | +5% $39 | +10% $163 |
| Rate | -1.0pp $132 | -0.5pp $25 | base $-84 | +0.5pp $-195 | +1.0pp $-308 |
UW: 25.0% down · 7.5% · 30yr · 1.5% tax · 5.0% vac · 8.0% maint · 8.0% mgmt
Financing live
Cash to close
- Down payment
- $107,250
- Closing costs
- $12,870
- Reserves months
- —
- Total cash needed
- —
Loan-product check · same deal, 3 products live
Conventional
25% down · 7.5% · 30yr
- Down + closing
- —
- Monthly P&I
- —
- Monthly cashflow
- —
- DSCR
- —
- Eligible?
- —
Personal DTI + credit; lowest rate.
DSCR
20% down · 8.5% · 30yr
- Down + closing
- —
- Monthly P&I
- —
- Monthly cashflow
- —
- DSCR
- —
- Eligible?
- —
No personal income docs; deal must DSCR.
Hard money
10% down · 12.0% · 12mo
- Down + closing
- —
- Monthly P&I
- —
- Monthly cashflow
- —
- DSCR
- —
- Eligible?
- —
Short-term bridge; refi at stabilization.
Rent comps 39 comps
| Address | Beds | Baths | Sqft | Rent | $/sqft | DOM | Units | Dist |
|---|---|---|---|---|---|---|---|---|
| 1037 SW Payne Ave Port Saint Lucie, FL | 4.0 | 2.0 | 1867 | $3,200 | $1.71 | 25d | 1 | 0.43mi |
| 1025 SW Majorca Ave Port Saint Lucie, FL | 3.0 | 2.0 | 1480 | $3,300 | $2.23 | 25d | 1 | 0.57mi |
| 3542 SW Viceroy St Port Saint Lucie, FL | 4.0 | 2.0 | 1833 | $2,380 | $1.30 | 15d | 1 | 0.60mi |
| 3542 SW Viceroy St Port Saint Lucie, FL | 4.0 | 2.0 | 1833 | $2,536 | $1.38 | 23d | 1 | 0.60mi |
| 1217 SW Marmore Ave Port Saint Lucie, FL | 3.0 | 2.0 | 1580 | $3,700 | $2.34 | 25d | 1 | 0.64mi |
| 1092 SW Majorca Ave Port Saint Lucie, FL | 4.0 | 2.5 | 2588 | $3,000 | $1.16 | 25d | 1 | 0.68mi |
| 3226 SW Nutley St Port Saint Lucie, FL | 3.0 | 2.0 | 1552 | $2,900 | $1.87 | 25d | 1 | 0.83mi |
| 1355 SW Porter Rd Port Saint Lucie, FL | 5.0 | 3.0 | 2692 | $3,100 | $1.15 | 23d | 1 | 0.86mi |
| 985 SW Eureka Ave Port Saint Lucie, FL | 5.0 | 2.0 | 1986 | $3,500 | $1.76 | 25d | 1 | 0.88mi |
| 997 SW Eureka Ave Port Saint Lucie, FL | 3.0 | 2.0 | 1986 | $2,600 | $1.31 | 25d | 1 | 0.88mi |
| 426 SW Eastport Cir Port Saint Lucie, FL | 4.0 | 3.0 | 1512 | $2,810 | $1.86 | 15d | 1 | 0.88mi |
| 1086 SW Eureka Ave Port Saint Lucie, FL | 3.0 | 2.0 | 1508 | $2,600 | $1.72 | 15d | 1 | 0.92mi |
| 1298 SW Crost Ave Port Saint Lucie, FL | 4.0 | 2.0 | 1833 | $2,566 | $1.40 | 15d | 1 | 0.94mi |
| 992 SW College Park Rd Port Saint Lucie, FL | 4.0 | 3.0 | 2078 | $2,700 | $1.30 | 25d | 1 | 0.98mi |
| 449 SW Fifer Ave Port Saint Lucie, FL | 3.0 | 2.0 | 1435 | $2,500 | $1.74 | 15d | 1 | 1.01mi |
| 350 SW Belmont Cir Port Saint Lucie, FL | 3.0 | 2.0 | 1761 | $1,700 | $0.97 | 25d | 1 | 1.03mi |
| 529 SW Baoy Ave Port Saint Lucie, FL | 4.0 | 2.0 | 1908 | $2,450 | $1.28 | 15d | 1 | 1.07mi |
| 2992 SW Lucerne St Port Saint Lucie, FL | 3.0 | 2.0 | 1734 | $2,500 | $1.44 | 25d | 1 | 1.12mi |
| 3014 SW Segovia St Port Saint Lucie, FL | 3.0 | 2.0 | 2102 | $2,700 | $1.28 | 15d | 1 | 1.14mi |
| 3773 SW Swope St Port Saint Lucie, FL | 4.0 | 2.0 | 1915 | $2,600 | $1.36 | 23d | 1 | 1.22mi |
| 312 SW Buzby Ct Port Saint Lucie, FL | 5.0 | 3.0 | 2665 | $3,500 | $1.31 | 25d | 1 | 1.24mi |
| 518 SW Aster Rd Port Saint Lucie, FL | 4.0 | 2.0 | 1773 | $3,450 | $1.95 | 25d | 1 | 1.24mi |
| 3158 SW Martin St Port Saint Lucie, FL | 3.0 | 2.0 | 1878 | $4,800 | $2.56 | 25d | 1 | 1.24mi |
| 1454 SW Medina Ave Port Saint Lucie, FL | 3.0 | 2.0 | 1558 | $2,395 | $1.54 | 15d | 1 | 1.24mi |
| 2957 SW Collings Dr Port Saint Lucie, FL | 3.0 | 2.0 | 2042 | $3,000 | $1.47 | 25d | 1 | 1.26mi |
| 1538 SW Neptune Ave Port Saint Lucie, FL | 3.0 | 2.0 | 2052 | $2,650 | $1.29 | 15d | 1 | 1.27mi |
| 481 SW Aster Rd Port Saint Lucie, FL | 3.0 | 2.0 | 1499 | $3,000 | $2.00 | 25d | 1 | 1.31mi |
| 3450 SW Martin St Port Saint Lucie, FL | 4.0 | 2.0 | 1930 | $3,800 | $1.97 | 25d | 1 | 1.33mi |
| 3183 SW Ann Arbor Rd Port Saint Lucie, FL | 3.0 | 2.0 | 1990 | $3,500 | $1.76 | 25d | 1 | 1.36mi |
| 242 SW Amesbury Ave Port Saint Lucie, FL | 3.0 | 2.0 | 2012 | $2,600 | $1.29 | 25d | 1 | 1.37mi |
| 3681 SW Haines St Port Saint Lucie, FL | 3.0 | 2.0 | 1542 | $2,700 | $1.75 | 15d | 1 | 1.39mi |
| 3681 SW Haines St Port Saint Lucie, FL | 3.0 | 2.0 | 1542 | $2,300 | $1.49 | 23d | 1 | 1.39mi |
| 3273 SW Rosser Blvd Port Saint Lucie, FL | 4.0 | 2.0 | 1787 | $2,600 | $1.45 | 15d | 1 | 1.44mi |
| 1691 SW Crawford Ave Port Saint Lucie, FL | 4.0 | 3.0 | 2339 | $3,500 | $1.50 | 25d | 1 | 1.45mi |
| 2617 SW Chestnut Ln Port Saint Lucie, FL | 3.0 | 2.0 | 1457 | $2,675 | $1.84 | 25d | 1 | 1.49mi |
| 2617 SW Chestnut Ln Port Saint Lucie, FL | 3.0 | 2.0 | 2052 | $2,675 | $1.30 | 15d | 1 | 1.49mi |
| 526 SW Dahled Ave Port Saint Lucie, FL | 4.0 | 2.0 | 2141 | $3,050 | $1.42 | 15d | 1 | 1.49mi |
| 526 SW Dahled Ave Port Saint Lucie, FL | 4.0 | 2.0 | 2138 | $3,226 | $1.51 | 23d | 1 | 1.49mi |
| 1326 SW Bartell Ave Port Saint Lucie, FL | 3.0 | 2.0 | 2370 | $3,000 | $1.27 | 25d | 1 | 1.50mi |
Listing history 36 events
-
2026-06-21days on market $429,000 Active 34 DOM
-
2026-06-18days on market $429,000 Active 31 DOM
-
2026-06-17days on market $429,000 Active 30 DOM
-
2026-06-16days on market $429,000 Active 29 DOM
-
2026-06-15days on market $429,000 Active 28 DOM
-
2026-06-14days on market $429,000 Active 26 DOM
-
2026-06-13days on market $429,000 Active 25 DOM
-
2026-06-10days on market $429,000 Active 23 DOM
-
2026-06-09days on market $429,000 Active 22 DOM
-
2026-06-08days on market $429,000 Active 21 DOM
-
2026-06-07days on market $429,000 Active 20 DOM
-
2026-06-05days on market $429,000 Active 17 DOM
-
2026-06-03days on market $429,000 Active 16 DOM
-
2026-06-02days on market $429,000 Active 15 DOM
-
2026-06-01days on market $429,000 Active 14 DOM
-
2026-05-31days on market $429,000 Active 13 DOM
-
2026-05-30days on market $429,000 Active 12 DOM
-
2026-05-19price $429,000
-
2026-05-18$442,335 Active
-
2025-10-10soldstatus $106,000
-
2025-10-09soldstatus $106,000 Closed 123-char remark
Show marketing remark (123 chars)
Great Location! Build your home on this . 23 acre lot. Centrally located near shopping and dining. Easy access to turnpike.
-
2025-06-01price $132,000 123-char remark
Show marketing remark (123 chars)
Great Location! Build your home on this . 23 acre lot. Centrally located near shopping and dining. Easy access to turnpike.
-
2025-05-21price $145,000 123-char remark
Show marketing remark (123 chars)
Great Location! Build your home on this . 23 acre lot. Centrally located near shopping and dining. Easy access to turnpike.
-
2025-05-02price $165,000 123-char remark
Show marketing remark (123 chars)
Great Location! Build your home on this . 23 acre lot. Centrally located near shopping and dining. Easy access to turnpike.
-
2025-04-07$175,000 Active 123-char remark
Show marketing remark (123 chars)
Great Location! Build your home on this . 23 acre lot. Centrally located near shopping and dining. Easy access to turnpike.
-
2023-11-03historical
-
2023-09-22$125,000 Active
-
2023-08-16historical
-
2023-05-22$123,000 Active
-
2020-08-14soldstatus $31,000
-
2020-08-07soldstatus $31,000 Closed
-
2020-07-14historical Contingent
-
2019-12-17price $35,000
-
2019-08-06$40,000 Active
-
2019-08-01historical
-
2019-06-25$40,000 Active
ⓘ Source: listings_history table (triggers on properties + properties_extension) + one-shot
backfill from property_details.listing_events for pre-trigger history.
Tax reassessment forecast FL · Resets to sale price
- Current annual tax
- $1,499 · $125/mo
- Projected year-2 tax
- $3,561 · $297/mo
- Expected delta
- +$2,062/yr (+$172/mo · 137.5%)
ⓘ Screening estimate from a state-policy table — verify with the county assessor before closing.
Nearby sold comps map
Loading sold comps map…
Walkable amenities ~0.75 mi
Loading nearby amenities…
Taxation est. · year 1
- Rental income
- $37,506
- − Mortgage interest
- −$24,031
- − Property taxes
- −$1,499
- − Insurance
- −$2,145
- − Repairs & maintenance
- −$3,001
- − Management
- −$3,001
- − Depreciation
- −$12,480
- Taxable loss
- −$8,649
- Est. tax savings @ 24.0%
- +$2,076
- After-tax cash flow
- $1,065/yr
For passive investors: Depreciation is non-cash, so a rental often shows a tax loss while cash-flowing — sheltering income. Rental losses are passive: they offset passive income freely, and up to $25,000/yr can offset ordinary (W-2) income if you actively participate and your MAGI is under $100k (phasing out to $0 by $150k); unused losses carry forward. On sale, claimed depreciation is recaptured at up to 25%, and gains may owe capital-gains tax (a 1031 exchange can defer both). Figures are a year-1 estimate at your 24.0% rate — not tax advice; consult a CPA.
Schools (NCES district)
- District
- St. Lucie
- NCES district ID
- 1201770
- Math proficiency
- 40% ▼ -11.00%
- Reading proficiency
- 48% ▼ -4.00%
- Median HH income
- $44,737
- Composite
- 37.28/100
- National rank
- #4449
- State rank
- #51 of 73 in FL
Livability — Port St. Lucie
No livability data for this city. (Only ~50 U.S. cities are tracked.)
Census & demographics
- Census place
- Port St. Lucie, FL
- County
- Saint Lucie County · 337,150 people
- City population
- 221,051
- Metro
- Port St. Lucie, FL
- Population (ZIP)
- 86,875
- Household income
- $85,667
- Rent vs Own
- Severe rent burden
- 857.0
Population outlook (St. Lucie County) Hauer SSP2
- Today (2025)
- 338,016 people
- By 2030
- 355,687 · +5.2%
- By 2040
- 385,521 · +14.1%
- By 2050
- 406,106 · +20.1%
- By 2075
- 441,054 · +30.5%
- By 2100
- 436,885 · +29.2%
Race, ethnicity, and origin ACS 2023
- Neighborhood character
- Diverse neighborhood (Simpson 0.69)
- Race & ethnicity
- White 42% Hispanic / Latino 28% Black 23% Two or more races 15% Asian 2%
- Hispanic origin (detail)
- Mexican 2% Puerto Rican 8% Cuban 4% Dominican 3%
- Common ancestry
- Hispanic 4% Romanian 2% Estonian 2%
- Foreign-born
- 24% · Canada, Jamaica, China
- Languages at home
- 69% English-only · Spanish 19% French/Haitian/Cajun 6% Other Indo-European 3%
Political lean MEDSL · St. Lucie
- 2024 margin
- Lean R (+9.1) · D 45.1% · R 54.2%
- 2008→2024 swing
- -21.2pp toward R · 2008: 12.1pp · 2024: -9.1pp
- All cycles
- 2024: R+9.1 2020: R+1.6 2016: R+2.5 2012: D+7.9 2008: D+12.1
Not yet ingested
- Civics
- —
Market trends
- HPI YoY
- ▼ -44.19%
- Current HPI
- 392.7681
- Rent YoY
- ▲ 0.22%
- Metro
- Port St. Lucie, FL
- State GDP YoY
- ▲ 3.28%
- F500 in state
- 36
Industry mix (Fortune 500 HQ in FL)
| Industry | F500 HQs | Revenue |
|---|---|---|
| Industrial Technology | 2 | $29B |
|
||
| Insurance | 2 | $17B |
|
||
| Retail | 1 | $60B |
|
||
| Technology Distribution | 1 | $58B |
|
||
| Homebuilding | 1 | $35B |
|
||
| Technology Manufacturing | 1 | $35B |
|
||
Price history
+972.5% since first listed19 events — show timeline
- 2026-05-19 Price Changed $429,000 Beaches MLS
- 2026-05-18 Listed $442,335 Beaches MLS
- 2025-10-10 Sold (Public Records) $106,000 Public Records
- 2025-10-09 Sold (MLS) $106,000 Beaches MLS
- 2025-06-01 Price Changed $132,000 Beaches MLS
- 2025-05-21 Price Changed $145,000 Beaches MLS
- 2025-05-02 Price Changed $165,000 Beaches MLS
- 2025-04-07 Listed $175,000 Beaches MLS
- 2023-11-03 Listing Removed — Beaches MLS
- 2023-09-22 Listed $125,000 Beaches MLS
- 2023-08-16 Listing Removed — Beaches MLS
- 2023-05-22 Listed $123,000 Beaches MLS
- 2020-08-14 Sold (Public Records) $31,000 Public Records
- 2020-08-07 Sold (MLS) $31,000 Beaches MLS
- 2020-07-14 Contingent — Beaches MLS
- 2019-12-17 Price Changed $35,000 Beaches MLS
- 2019-08-06 Listed $40,000 Beaches MLS
- 2019-08-01 Listing Removed — MCRTC
- 2019-06-25 Listed $40,000 MCRTC
Property tax history
+9.8%/yrLatest (2025): $1,499 · +14.8% YoY. Source: county tax records.
Cash-flow waterfall
monthlySold comps — $/sqft
last 12 mo · ≤1 miLoading sold comps…