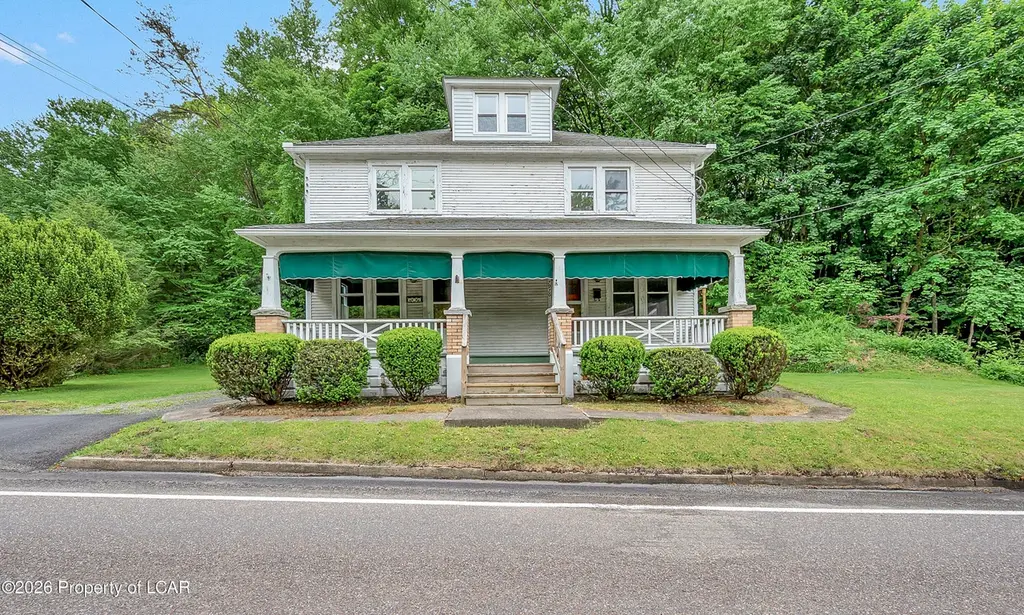
 Triplex
7974-7976 Main St · Conyngham, PA
Flood risk 10/10 · Severe
- FEMA flood zone
- X (unshaded)
- Chance of flooding over 30 yrs
- 0.99%
- Est. flood insurance / yr
- $507 – $1,088
Fire risk 3/10 · Minor
- Est. fire insurance / yr
- $511 – $949
Heat risk 3/10 · Minor
- Hot days now (above 97°F)
- 7 days/yr
- Hot days in 30 yrs
- 16 days/yr
Wind risk 3/10 · Minor
- Chance of severe wind over 30 yrs
- 4.0%
Air-quality risk 2/10 · Minimal
- Unhealthy air days now
- 1 days/yr
- Unhealthy air days in 30 yrs
- 2 days/yr
Risk factors via First Street. Map © Google.
Why this score? — see what drove the D+ grade
The composite is a weighted blend of 9 inputs, each scored 0–100. Each bar is that input's sub-score; the figure is the points it added to the 100-point composite (weight × sub-score).
- Cash flow +10.3/30.0
- Appreciation +10.0/10.0
- ARV discount +7.5/15.0
- Livability +3.9/5.0
- Condition / age +3.8/5.0
- 1% rule +3.1/10.0
- DSCR +3.0/10.0
- Rent growth +2.5/5.0
- Schools +2.0/10.0
$350,000
🖨 Deal sheet (PDF) 📄 Offer letter ✓ Due diligence
Multi-family units
County records classify this as Multi-Family (2-4 Unit). Listing-text estimate: 3 units. confirmed
Listing remarks
Stately three family apartment building located on Main St Mocanaqua. Each unit offers modern updates along with timeless character in each spacious apartment. Other features include: Modern Kitchens/ Baths, Separate Laundry, Fresh Paint/ Flooring, and Off-Street Parking. Property has been very well maintained and would be an excellent home or investment property. Call today for a private showing!
Key facts
- Off street parking
- Modern kitchens
- Separate laundry
Tags
Property features AI
Finance
- Financial info: Annual tax noted
Exterior
- Parking: Off-street parking
- Utilities: Public water; Public sewer
- Home design: Multi-family residential income property; Wood siding
- Construction: Wood siding construction
- Exterior features: Residential zoning; Lot approximately 0.09 acres
Interior
- Heating & cooling: Electric baseboard heating
- Interior features: Electric water heater; Full unfinished basement
Neighborhood map
What this means for you Summary
Snapshot
- This is a 3 × 2-bed/1.0-bath units multifamily listed at $350k. Condition is rated good.
Deal economics
- At list price, monthly cash flow is $-259 ($-3k/yr) — negative. Per door: $-86/mo.
- To cash-flow at today's rent, offer at most $313k (10.7% below list).
- To meet the 1% rule (rent ≥ 1% of price), the offer needs to be $282k (19.5% below list).
- Recommended offer: $282k (19.5% below list) — sets the bar for 1% rule.
- Cap rate 5.6% vs local median 2.5% in Conyngham — top-decile yield for the area; either an underpriced asset or a hidden risk that comps aren't pricing in. Stress-test before assuming the spread holds.
Location & tenants
- Location reads 77/100 on livability (#331 in PA, #2,897 nationally) — a middle-class / working-renter tenant base. Strengths: crime A+, cost of living A+, housing A+; Watch: amenities F, commute F.
- Greater Nanticoke Area SD (suburban): math 14% / reading 34% proficiency, ranked #479 of 539 in PA (top 89%) — low school quality limits family demand, transient renter base, plan for 1-2y turnover.
- Zoned schools: Gna El Ctr (math 15% / reading 36%, grade F, #1,172 of 1,518 statewide, top 77%, 505 students, 100% FRL); Greater Nanticoke Area Ed Ctr (math 4% / reading 32%, grade F, #453 of 512 statewide, top 89%, 539 students, 100% FRL); Greater Nanticoke Area Shs (math 52%, 714 students, 89% FRL) — zoned schools average 96% FRL vs 52% district-wide (44 pts higher); higher-poverty schools than district average — tighter screening recommended.
- Market conditions: 36 active listings in the ZIP; 349 units permitted in Luzerne County in 2024 (16 in 5+ unit buildings).
Forward outlook
- In year one you build about $37k of equity ($2k loan paydown + $35k appreciation (10.0% local appreciation)).
- Luzerne County population projected at +4% by 2050 — modest demand growth; plan on rents tracking national, not racing it.
- By year 2, paydown + projected appreciation supports a ~$60k cash-out refi (75% LTV) — recoverable capital for the next deal without selling this one.
Negotiation context
- It's been on market 26 days — a 2% lower offer ($345k) is reasonable based on typical stale-listing flexibility.
Risks & watch-outs
- Watch-outs: flood insurance adds $66/mo.
- Climate carrying-cost: severe flood risk — expect insurance premiums to compound above CPI over the hold.
Questions for the listing agent
- What do current leases actually rent for vs. the listed asking? Can we see a recent rent roll and the last 12 months of T-12 income?
- Can we see the unit-by-unit rent roll, current vacancy, and any below-market leases? What's the average tenancy length?
- What capital expenditures (roof, boiler, parking lot, exteriors) have been made in the last 5 years, and what's planned in the next 2?
- What's the actual annual flood-insurance premium (NFIP or private), and is the property in a SFHA with mandatory coverage?
- Is there a deadline driving the sale (1031 exchange, divorce, estate, relocation)? That informs how much negotiation room exists.
- The area grade is low — what's the realistic commute time and amenity access for the typical tenant pool here? Any planned neighborhood developments (good or bad) we should know about?
- What's the average days-on-market for RENTAL listings here right now (not sales)? A rising rental-DOM trend means longer vacancies and softer asking-rent achievability than the comps imply.
- What's the recent tenant-quality profile in this submarket — average credit score on applications, eviction rate, late-payment / NSF rate, and stable-employment percentage? A property-management company in the area should have these aggregated.
- How much new apartment / multifamily construction is in the pipeline within 1–3 miles? Heavy new supply (>2% of stock underway) typically softens rents 12–24 months out; light construction supports rent growth.
Investment metrics
- 1% rule
- 0.81% ✗
- Cap rate
- 5.63%
- Cash-on-cash
- -2.36%
- DSCR
- 0.90
- GRM
- 10.4
CMA / ARV
No comps found within radius.
Projected returns pro-forma
10.0% appreciation · 3.0% rent growth · sell at horizon
- IRR
- 22.0%
- Equity multiple
- 2.78×
- Total profit
- $174,206
- Equity at exit
- $315,308
- IRR
- 19.8%
- Equity multiple
- 6.37×
- Total profit
- $526,147
- Equity at exit
- $679,973
Cash invested: $98,000 (down + closing). Projections, not guarantees.
Landlord ↔ Tenant lean methodology
- Overall (STATE)
- 62 Landlord-Friendly
- State Pennsylvania
- 62 Landlord-Friendly · EVEN
- County
- — inherits STATE
- City
- — inherits STATE
ZIP-level market 18655
- Home prices YoY
- 13.9%
- Active inventory
- 36
- Price-to-rent
- 31.1×
Monthly cashflow live
- Estimated rent
- $2,818 medium interval (Pro) →
- Mortgage (P&I)
- −$1,835
- Tax est. 1.5%
- −$438 /mo · $5,250/yr
- Insurance
- −$146
- Flood insurance flood zone
- −$66 /mo · $798/yr
- HOA
- −$0
- Vacancy / Maint / Mgmt
- −$592
- Net cashflow
- $-259
Break-even live
Sensitivity live
| Price | -10% $-17 | -5% $-138 | +0% $-259 | +5% $-380 | +10% $-501 |
|---|---|---|---|---|---|
| Rent | -10% $-482 | -5% $-370 | +0% $-259 | +5% $-148 | +10% $-36 |
| Rate | -1.0pp $-83 | -0.5pp $-170 | base $-259 | +0.5pp $-350 | +1.0pp $-442 |
3-unit breakdown (identical units grouped — click to expand)
| Units | Beds | Baths | Est. rent |
|---|---|---|---|
| 3× units | 2 | 1 | $2,817 |
| #1 | 2 | 1 | $939 |
| #2 | 2 | 1 | $939 |
| #3 | 2 | 1 | $939 |
| Total (3 units) | $2,818 | ||
UW: 25.0% down · 7.5% · 30yr · 1.5% tax · 5.0% vac · 8.0% maint · 8.0% mgmt
Financing live
Cash to close
- Down payment
- $87,500
- Closing costs
- $10,500
- Reserves months
- —
- Total cash needed
- —
Loan-product check · same deal, 3 products live
Conventional
25% down · 7.5% · 30yr
- Down + closing
- —
- Monthly P&I
- —
- Monthly cashflow
- —
- DSCR
- —
- Eligible?
- —
Personal DTI + credit; lowest rate.
DSCR
20% down · 8.5% · 30yr
- Down + closing
- —
- Monthly P&I
- —
- Monthly cashflow
- —
- DSCR
- —
- Eligible?
- —
No personal income docs; deal must DSCR.
Hard money
10% down · 12.0% · 12mo
- Down + closing
- —
- Monthly P&I
- —
- Monthly cashflow
- —
- DSCR
- —
- Eligible?
- —
Short-term bridge; refi at stabilization.
Listing history 17 events
-
2026-06-22days on market $350,000 Active 26 DOM
-
2026-06-18days on market $350,000 Active 23 DOM
-
2026-06-17days on market $350,000 Active 22 DOM
-
2026-06-16days on market $350,000 Active 21 DOM
-
2026-06-15days on market $350,000 Active 20 DOM
-
2026-06-14days on market $350,000 Active 18 DOM
-
2026-06-13days on market $350,000 Active 17 DOM
-
2026-06-10days on market $350,000 Active 15 DOM
-
2026-06-09days on market $350,000 Active 14 DOM
-
2026-06-08days on market $350,000 Active 13 DOM
-
2026-06-07days on market $350,000 Active 12 DOM
-
2026-06-05days on market $350,000 Active 9 DOM
-
2026-06-02days on market $350,000 Active 7 DOM
-
2026-06-01days on market $350,000 Active 6 DOM
-
2026-05-31days on market $350,000 Active 5 DOM
-
2026-05-30days on market $350,000 Active 4 DOM
-
2026-05-26$350,000 Active
ⓘ Source: listings_history table (triggers on properties + properties_extension) + one-shot
backfill from property_details.listing_events for pre-trigger history.
Climate risk First Street
- Flood 10/10 Extreme FEMA zone X (unshaded) · 99% chance over 30 yrs
- Wildfire 3/10 Moderate
- Heat 3/10 Moderate 7 d/yr ≥97°F today · 16 d/yr by 30 yrs out
- Wind 3/10 Moderate 4% chance of damaging wind over 30 yrs
- Air quality 2/10 Low 1 unhealthy d/yr today · 2 by 30 yrs out
Nearby sold comps map
Loading sold comps map…
Walkable amenities ~0.75 mi
Loading nearby amenities…
Taxation est. · year 1
- Rental income
- $33,816
- − Mortgage interest
- −$19,605
- − Property taxes
- −$5,250
- − Insurance
- −$2,548
- − Repairs & maintenance
- −$2,705
- − Management
- −$2,705
- − Depreciation
- −$10,182
- Taxable loss
- −$9,179
- Est. tax savings @ 24.0%
- +$2,203
- After-tax cash flow
- $-905/yr
For passive investors: Depreciation is non-cash, so a rental often shows a tax loss while cash-flowing — sheltering income. Rental losses are passive: they offset passive income freely, and up to $25,000/yr can offset ordinary (W-2) income if you actively participate and your MAGI is under $100k (phasing out to $0 by $150k); unused losses carry forward. On sale, claimed depreciation is recaptured at up to 25%, and gains may owe capital-gains tax (a 1031 exchange can defer both). Figures are a year-1 estimate at your 24.0% rate — not tax advice; consult a CPA.
Condition & rehab AI · 13 photos
A well-maintained three-family apartment building with good condition and potential for cosmetic updates to enhance its resale and rental value.
Value-add opportunities
- Both Paint exterior — Enhances curb appeal and value
- Both Replace carpet — Improves comfort and value
- Both Update kitchen appliances — Modernizes the space and increases value
- Both Update bathrooms — Modernizes the space and increases value
- Both Landscaping improvements — Enhances curb appeal and value
Renovation cost estimate screening
Value-add ROI direction
- Both Paint exterior — Enhances curb appeal and value ↑
- Both Replace carpet — Improves comfort and value ↑
- Both Update kitchen appliances — Modernizes the space and increases value ↑
- Both Update bathrooms — Modernizes the space and increases value ↑
- Both Landscaping improvements — Enhances curb appeal and value ↑
ⓘ Cost ranges are severity-bucket heuristics (US national rule-of-thumb). Get contractor quotes + a written scope before underwriting a rehab budget.
Schools (NCES district)
- District
- Greater Nanticoke Area SD
- NCES district ID
- 4216290
- Math proficiency
- 14% ▼ -8.00%
- Reading proficiency
- 34% ▼ -14.00%
- Median HH income
- $38,990
- Composite
- 20.1/100
- National rank
- #8647
- State rank
- #479 of 539 in PA
Livability — Conyngham
- Score
- 77/100
- State rank
- #331
- US rank
- #2897
Category grades
Schools grade is shown separately in the Schools card above.
Census & demographics
- Census place
- Mocanaqua, PA
- City population
- 1,072
- Population (ZIP)
- 5,789
Population outlook (Luzerne County) Hauer SSP2
- Today (2025)
- 319,505 people
- By 2030
- 319,943 · +0.1%
- By 2040
- 322,643 · +1.0%
- By 2050
- 330,817 · +3.5%
- By 2075
- 379,145 · +18.7%
- By 2100
- 431,908 · +35.2%
Race, ethnicity, and origin ACS 2023
- Neighborhood character
- Predominantly White (95%)
- Race & ethnicity
- White 95% Two or more races 4% Hispanic / Latino 3%
- Common ancestry
- Romanian 19% Lithuanian 5% Iranian 3%
- Foreign-born
- 1%
- Languages at home
- 98% English-only · Russian/Polish/Slavic 1% Spanish 1%
Political lean MEDSL · Luzerne
- 2024 margin
- R (+19.2) · D 40.0% · R 59.2%
- 2008→2024 swing
- -27.6pp toward R · 2008: 8.4pp · 2024: -19.2pp
- All cycles
- 2024: R+19.2 2020: R+14.4 2016: R+19.6 2012: D+4.8 2008: D+8.4
Not yet ingested
- Civics
- —
Market trends
- HPI YoY
- ▲ 34.48%
- Current HPI
- 282.3106
- Rent YoY
- —
- Metro
- —
- State GDP YoY
- ▲ 1.68%
- F500 in state
- 34
Industry mix (Fortune 500 HQ in PA)
| Industry | F500 HQs | Revenue |
|---|---|---|
| Healthcare | 2 | $309B |
|
||
| Insurance | 2 | $27B |
|
||
| Telecommunications / Media | 1 | $124B |
|
||
| Industrial Distribution | 1 | $22B |
|
||
| Financial Services | 1 | $20B |
|
||
| Chemicals / Materials | 1 | $18B |
|
||
Price history
1 event — show timeline
- 2026-05-26 Listed $350,000 LCAR
Cash-flow waterfall
monthlySold comps — $/sqft
last 12 mo · ≤1 miLoading sold comps…