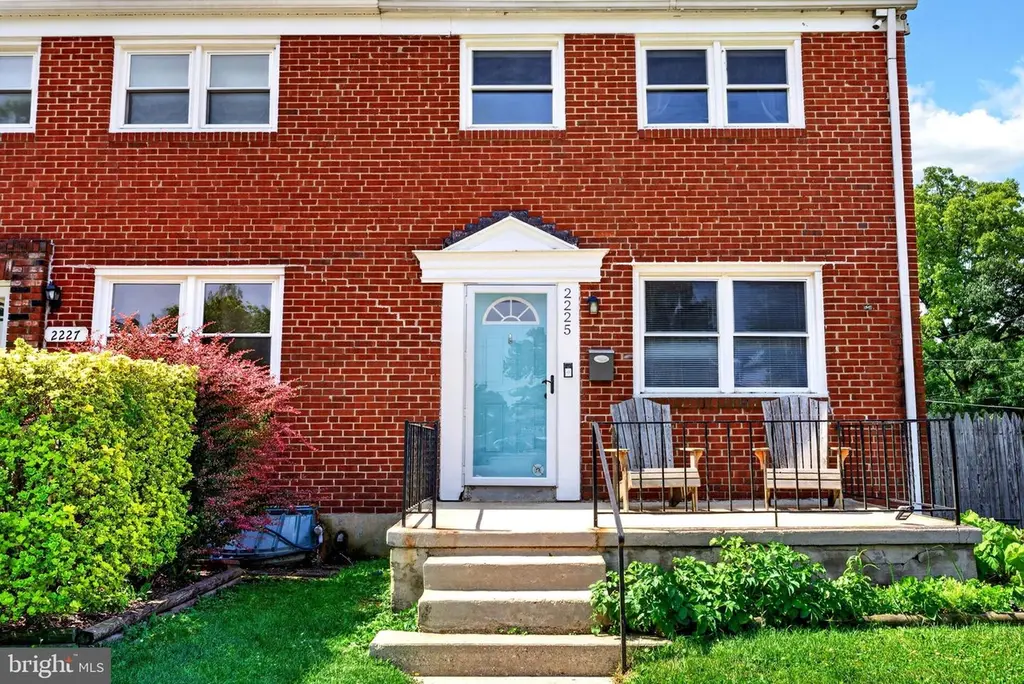
2225 Ellen Ave · Parkville, MD
Flood risk 1/10 · Minimal
- FEMA flood zone
- X (unshaded)
- Chance of flooding over 30 yrs
- 0.0%
- Est. flood insurance / yr
- $473 – $860
Fire risk 3/10 · Minor
- Est. fire insurance / yr
- $755 – $1,403
Heat risk 6/10 · Moderate
- Hot days now (above 104°F)
- 7 days/yr
- Hot days in 30 yrs
- 14 days/yr
Wind risk 6/10 · Moderate
- Chance of severe wind over 30 yrs
- 27.0%
Air-quality risk 4/10 · Minor
- Unhealthy air days now
- 5 days/yr
- Unhealthy air days in 30 yrs
- 7 days/yr
Risk factors via First Street. Map © Google.
Why this score? — see what drove the D- grade
The composite is a weighted blend of 9 inputs, each scored 0–100. Each bar is that input's sub-score; the figure is the points it added to the 100-point composite (weight × sub-score).
- Cash flow +14.0/30.0
- ARV discount +4.6/15.0
- DSCR +4.2/10.0
- Rent growth +4.2/5.0
- Livability +3.9/5.0
- 1% rule +3.5/10.0
- Condition / age +2.5/5.0
- Schools +2.3/10.0
- Appreciation +0.0/10.0
$255,000
🖨 Deal sheet 📄 Offer letter ✓ Due diligence
Listing remarks MLS
This must-see 3 bedroom 2 bathroom end-unit row home backs up to a beautiful county park! The front entrance leads to a spacious open living-dining area with plenty of natural light, perfect for entertaining! The updated kitchen has access to a large new deck which leads to a fully fenced yard! From the backyard, open your gate to access your private parking pad, spacious shed, and the only garage on the block. What else? The garage is complete with heating and AC - making for a perfect extra workspace area! The fully finished basement features another open entertainment area, full bathroom, and laundry. Make your way to the top level and find all 3 spacious bedrooms and another full-sized bath! Close proximity to 695, shopping, and more - Don t miss out on this great home!
Key facts
- Finished basement
- Updated kitchen
- Corner lot
Tags
Property features AI
Exterior
- Parking: Detached rear-entry garage (1 garage space); Driveway parking (1 space); On-street parking; Paved parking (total of 2 garage/parking spaces)
- Utilities: Public water; Public sewer; Natural gas hot water
- Home design: End of row townhouse; Main entrance faces north; Corner lot/unit
- Construction: Brick construction; Block foundation; Architectural shingle roof; Year built (source: assessor)
- Exterior features: Deck(s) and porch(es); Play equipment; Sidewalks; Front yard, rear yard, side yards, and landscaping; Backs to open common area; Fully wood fencing
Interior
- Bedrooms: Three bedrooms on the main upper level
- Flooring: Hardwood; Ceramic tile; Carpet
- Bathrooms: Two full bathrooms (one on the upper level, one on the lower level)
- Heating & cooling: Forced air heating (natural gas); Electric cooling (other type)
- Interior features: Attic; Stall shower; Tub shower; Ceiling fans; Formal separate dining room; Recessed lighting
- Laundry & utility: Washer and dryer in unit (located in the basement); Basement fully finished
Neighborhood map
What this means for you Summary
Snapshot
- This is a 3-bed/2.0-bath townhouse listed at $255k.
Deal economics
- At list price, monthly cash flow is $30 ($366/yr) — positive.
- The deal already cash-flows at list — no discount required.
- To meet the 1% rule (rent ≥ 1% of price), the offer needs to be $218k (14.6% below list).
- Recommended offer: $218k (14.6% below list) — sets the bar for 1% rule.
- Cap rate 6.4% vs local median 5.3% in Parkville — meaningfully above typical; check what's discounted (condition, days-on-market, listing class) to confirm the premium yield is real.
Location & tenants
- Location reads 77/100 on livability (#77 in MD, #2,839 nationally) — a middle-class / working-renter tenant base. Strengths: commute A+, housing A+, health & safety A+; Watch: schools F, crime F.
- Baltimore County Public Schools (suburban): math 15% / reading 34% proficiency, ranked #11 of 24 in MD (top 46%) — low school quality limits family demand, transient renter base, plan for 1-2y turnover.
- Market conditions: Rents rising fast (+6.7%/yr); 225 active listings in the ZIP; 40 comparable units currently listed for rent nearby; rentals at typical pace (median 24d on market — plan ~3-4 weeks tenant-placement turnaround); 48% of comp listings sitting > 30 days — soft ceiling on asking rent; solid renter incomes; 1,511 units permitted in Baltimore County in 2024 (643 in 5+ unit buildings).
- This rent runs 31% of the median local income ($84k/yr) — at the standard rent-burdened threshold; future hikes will face affordability resistance.
Forward outlook
- Local home prices are declining (-3.0%/yr); year-one equity from $2k of loan paydown is wiped out by about $8k of value loss. Plan a longer hold.
- Baltimore County population projected at +12% by 2050 — modest demand growth; plan on rents tracking national, not racing it.
Negotiation context
- Only 4 days on market — expect competitive offers; lowballing is unlikely to land.
- 5 sale attempts since 14y ago with the ask held roughly flat each time — persistent listings suggest the price (not the market) is what's stuck; bring a comps-based counter.
- Current owner paid $190k; 34% above their basis — modest negotiation headroom, anchor on the comps not their cost.
Risks & watch-outs
- Watch-outs: built in 1957 — expect roof / HVAC / electrical / plumbing capex.
- Climate carrying-cost: major wind risk, 27% chance of damaging wind over 30y; extreme-heat days projected 7→14/yr by 2055 (HVAC capex compounding) — expect insurance premiums to compound above CPI over the hold.
Questions for the listing agent
- Built in 1957 — when were the roof, HVAC, electrical panel, plumbing, and water heater last replaced?
- Is there a deadline driving the sale (1031 exchange, divorce, estate, relocation)? That informs how much negotiation room exists.
- Schools are F-rated, which usually means shorter tenancies and higher turnover. Who's the typical renter profile here, and what's been the actual vacancy rate?
- Crime grade is F in this area — have there been break-ins, vandalism, or insurance claims at this property in the last 3 years? What carrier currently insures it and at what premium?
- The area grade is low — what's the realistic commute time and amenity access for the typical tenant pool here? Any planned neighborhood developments (good or bad) we should know about?
- What's the average days-on-market for RENTAL listings here right now (not sales)? A rising rental-DOM trend means longer vacancies and softer asking-rent achievability than the comps imply.
- What's the recent tenant-quality profile in this submarket — average credit score on applications, eviction rate, late-payment / NSF rate, and stable-employment percentage? A property-management company in the area should have these aggregated.
- How much new for-sale + rental construction is in the pipeline within 1–3 miles? Heavy new supply typically softens prices + rents 12–24 months out; constrained supply supports both.
Investment metrics
- 1% rule
- 0.85% ✗
- Cap rate
- 6.44%
- Cash-on-cash
- 0.51%
- DSCR
- 1.02
- GRM
- 9.8
CMA / ARV
- ARV (on-the-fly)
- $239,742
- Comps found
- 12
Show comp detail 12 sales within ~0.75 mi
| Address | Dist | Beds/Ba | Sqft | Sold | Price | $/sf | Match |
|---|---|---|---|---|---|---|---|
| 2113 Pitney Rd | 0.29mi | 3/1.5 | 1,440 (+3%) | 1mo | $270,000 | $188 | 79 |
| 8528 Kings Ridge Rd | 0.23mi | 3/1.5 | 1,440 (+3%) | 8mo | $275,000 | $191 | 76 |
| 8559 Morven Rd | 0.19mi | 2/1.5 (-1) | 1,440 (+3%) | 7mo | $245,000 | $170 | 74 |
| 1770 Weston Ave | 0.57mi | 3/1.5 | 1,396 (-0%) | 2mo | $239,000 | $171 | 69 |
| 8619 Oak Rd | 0.57mi | 3/1.5 | 1,408 (+0%) | 5mo | $225,000 | $160 | 67 |
| 8301 Kendale Rd | 0.69mi | 3/1.5 | 1,408 (+0%) | 1mo | $280,000 | $199 | 64 |
| 8425 Kings Ridge Rd | 0.32mi | 3/1.0 | 1,552 (+11%) | 1mo | $260,000 | $168 | 63 |
| 8656 Oak Rd | 0.62mi | 3/2.0 | 1,260 (-10%) | 5mo | $242,500 | $192 | 50 |
| 8533 Water Oak Rd | 0.52mi | 3/2.0 | 1,226 (-13%) | 8mo | $250,000 | $204 | 48 |
| 1712 Red Oak Rd | 0.66mi | 3/1.5 | 1,534 (+9%) | 7mo | $252,000 | $164 | 46 |
| 1862 Yakona Rd | 0.67mi | 3/2.0 | 1,560 (+11%) | 5mo | $255,000 | $163 | 45 |
| 8351 Edgedale Rd | 0.71mi | 3/2.0 | 1,224 (-13%) | 7mo | $171,000 | $140 | 40 |
Match score weights: distance 35% · size 25% · config 20% · recency 20%. Top-matched comps best support the ARV.
Projected returns pro-forma
-3.0% appreciation · 6.68% rent growth · sell at horizon
- IRR
- -11.6%
- Equity multiple
- 0.57×
- Total profit
- $-31,026
- Equity at exit
- $38,021
- IRR
- 2.1%
- Equity multiple
- 1.17×
- Total profit
- $12,468
- Equity at exit
- $22,048
Cash invested: $71,400 (down + closing). Projections, not guarantees.
Landlord ↔ Tenant lean methodology
- Overall (STATE)
- 27 Tenant-Leaning
- State Maryland
- 27 Tenant-Leaning · D+14
- County
- — inherits STATE
- City
- — inherits STATE
ZIP-level market 21234
- Rents YoY
- 6.7%
- Active inventory
- 225
- Price-to-rent
- 9.8×
Monthly cashflow live
- Estimated rent
- $2,179 high interval (Pro) →
- Mortgage (P&I)
- −$1,337
- Tax from tax record
- −$247 /mo · $2,967/yr
- Insurance
- −$106
- HOA
- −$0
- Vacancy / Maint / Mgmt
- −$458
- Net cashflow
- $30
Break-even live
UW: 25.0% down · 7.5% · 30yr · 1.5% tax · 5.0% vac · 8.0% maint · 8.0% mgmt
Financing live
Cash to close
- Down payment
- $63,750
- Closing costs
- $7,650
- Reserves months
- —
- Total cash needed
- —
Loan-product check · same deal, 3 products live
Conventional
25% down · 7.5% · 30yr
- Down + closing
- —
- Monthly P&I
- —
- Monthly cashflow
- —
- DSCR
- —
- Eligible?
- —
Personal DTI + credit; lowest rate.
DSCR
20% down · 8.5% · 30yr
- Down + closing
- —
- Monthly P&I
- —
- Monthly cashflow
- —
- DSCR
- —
- Eligible?
- —
No personal income docs; deal must DSCR.
Hard money
10% down · 12.0% · 12mo
- Down + closing
- —
- Monthly P&I
- —
- Monthly cashflow
- —
- DSCR
- —
- Eligible?
- —
Short-term bridge; refi at stabilization.
Rent comps 40 comps
| Address | Beds | Baths | Sqft | Rent | $/sqft | DOM | Units | Dist |
|---|---|---|---|---|---|---|---|---|
| 8768 Cimarron Cir Parkville, MD | 4.0 | 1.5 | 1752 | $2,395 | $1.37 | 24d | 1 | 0.27mi |
| 8503 Kings Ridge Rd Parkville, MD | 4.0 | 2.0 | 1200 | $2,100 | $1.75 | 5d | 1 | 0.29mi |
| 8592 Quentin Ave Parkville, MD | 3.0 | 1.5 | 1440 | $2,100 | $1.46 | 5d | 1 | 0.41mi |
| 8309 Arbor Station Way Parkville, MD | 1.0–2.0 | 1.0–1.5 | 846 | $1,815 | $2.15 | 2d | 8 | 0.42mi |
| 8417 Nunley Dr Parkville, MD | 1.0–3.0 | 1.0–2.0 | 812 | $2,120 | $2.61 | 24d | 1 | 0.43mi |
| 8451 Water Oak Rd Parkville, MD | 3.0 | 2.0 | 1054 | $1,950 | $1.85 | 44d | 1 | 0.52mi |
| 8617 Oak Rd Parkville, MD | 3.0 | 1.5 | 1208 | $2,100 | $1.74 | 5d | 1 | 0.55mi |
| 8533 Oak Rd Parkville, MD | 3.0 | 2.0 | 1480 | $2,100 | $1.42 | 44d | 1 | 0.56mi |
| 1726 Redwood Ave Parkville, MD | 4.0 | 2.0 | 1435 | $2,250 | $1.57 | 18d | 1 | 0.59mi |
| 1870 Yakona Rd Parkville, MD | 4.0 | 2.0 | 1080 | $2,400 | $2.22 | 44d | 1 | 0.61mi |
| 1745 Amuskai Rd Parkville, MD | 2.0 | 2.0 | 1260 | $1,975 | $1.57 | 44d | 1 | 0.62mi |
| 1714 Pin Oak Rd Parkville, MD | 3.0 | 1.0 | 1534 | $2,800 | $1.83 | 5d | 1 | 0.65mi |
| 8650 Rock Oak Rd Parkville, MD | 4.0 | 2.0 | 1800 | $3,108 | $1.73 | 44d | 1 | 0.69mi |
| 8623 Willow Oak Rd Parkville, MD | 3.0 | 2.0 | 1395 | $2,700 | $1.94 | 44d | 1 | 0.71mi |
| 7839 Birmingham Ave Parkville, MD | 3.0 | 1.0 | 1136 | $1,775 | $1.56 | 44d | 1 | 0.71mi |
| 8525 Chestnut Oak Rd Parkville, MD | 4.0 | 2.0 | 1178 | $1,995 | $1.69 | 44d | 1 | 0.73mi |
| 8206 Old Harford Rd Unit 2 Parkville, MD | 2.0 | 1.0 | 1146 | $1,850 | $1.61 | 44d | 1 | 0.73mi |
| 8206 Old Harford Rd Unit 1 Parkville, MD | 2.0 | 1.0 | 1146 | $1,750 | $1.53 | 44d | 1 | 0.73mi |
| 8340 Edgedale Rd Parkville, MD | 3.0 | 2.0 | 1260 | $2,400 | $1.90 | 5d | 1 | 0.74mi |
| 8204 Old Harford Rd Unit 2 Parkville, MD | 2.0 | 1.0 | 1146 | $1,850 | $1.61 | 44d | 1 | 0.74mi |
| 1726 Yakona Rd Unit A Parkville, MD | 3.0 | 1.0 | 1865 | $1,400 | $0.75 | 44d | 1 | 0.77mi |
| 1717 Northview Rd Parkville, MD | 3.0 | 1.5 | 1260 | $1,980 | $1.57 | 5d | 1 | 0.83mi |
| 7906 Bon Air Rd Parkville, MD | 3.0 | 1.0 | 912 | $2,200 | $2.41 | 44d | 1 | 0.88mi |
| 2528 Wendover Rd Unit a Parkville, MD | 2.0 | 2.0 | 1704 | $1,950 | $1.14 | 44d | 1 | 0.94mi |
| 1644 Yakona Rd Towson, MD | 3.0 | 2.0 | 1600 | $2,500 | $1.56 | 18d | 1 | 0.97mi |
| 23 Roger Valley Ct Parkville, MD | 3.0 | 3.5 | 1678 | $2,850 | $1.70 | 5d | 1 | 0.99mi |
| 23 Roger Valley Ct Unit 1 Parkville, MD | 3.0 | 4.0 | 1678 | $2,850 | $1.70 | 5d | 1 | 0.99mi |
| 8402 Greenway Rd Towson, MD | 3.0 | 1.0 | 708 | $1,595 | $2.25 | 2d | 24 | 1.04mi |
| 1809 Glen Ridge Rd Towson, MD | 3.0 | 1.5 | 1640 | $2,100 | $1.28 | 44d | 1 | 1.05mi |
| 1929 Edgewood Rd Unit 1929 Towson, MD | 3.0 | 2.0 | 1700 | $2,350 | $1.38 | 11d | 1 | 1.07mi |
| 2219 Lowells Glen Rd Unit K Parkville, MD | 2.0 | 2.0 | 1017 | $1,650 | $1.62 | 24d | 1 | 1.07mi |
| 1621 Thetford Rd Towson, MD | 3.0 | 1.5 | 1080 | $2,350 | $2.18 | 44d | 1 | 1.09mi |
| 8505 Pleasant Plains Rd Towson, MD | 3.0 | 2.0 | 1580 | $2,500 | $1.58 | 18d | 1 | 1.09mi |
| 8616 Pleasant Plains Rd Towson, MD | 3.0 | 2.0 | 1580 | $2,490 | $1.58 | 15d | 1 | 1.09mi |
| 7605 Hillendale Rd Parkville, MD | 2.0 | 1.0 | 1050 | $1,255 | $1.20 | 44d | 1 | 1.11mi |
| 1612 Hardwick Rd Towson, MD | 4.0 | 2.0 | 1275 | $2,450 | $1.92 | 3d | 1 | 1.13mi |
| 8339 Wyton Rd Towson, MD | 4.0 | 2.0 | 1520 | $2,534 | $1.67 | 24d | 1 | 1.14mi |
| 1376 Halstead Rd Parkville, MD | 3.0 | 1.0 | 1440 | $2,400 | $1.67 | 24d | 1 | 1.16mi |
| 8 Windersal Ln Parkville, MD | 3.0 | 1.5 | 1520 | $2,250 | $1.48 | 44d | 1 | 1.21mi |
| 9300 Carney Ave Unit A Parkville, MD | 2.0 | 1.0 | 1392 | $1,300 | $0.93 | 44d | 1 | 1.21mi |
Listing history 4 events
-
2026-06-16status $255,000 Pending 4 DOM
-
2026-06-15days on market $255,000 Active 4 DOM
-
2026-06-13remarks 699-char remark
-
2026-06-13$255,000 Active 2 DOM
ⓘ Source: listings_history table (triggers on properties + properties_extension) + one-shot
backfill from property_details.listing_events for pre-trigger history.
Tax reassessment forecast MD · Partial reset (capped growth)
- Current annual tax
- $2,967 · $247/mo
- Projected year-2 tax
- $2,967 · $247/mo
- Expected delta
- $0/yr ($0/mo · 0.0%)
ⓘ Screening estimate from a state-policy table — verify with the county assessor before closing.
Climate risk First Street
- Flood 1/10 Low FEMA zone X (unshaded) · 0% chance over 30 yrs
- Wildfire 3/10 Moderate
- Heat 6/10 Major 7 d/yr ≥104°F today · 14 d/yr by 30 yrs out
- Wind 6/10 Major 27% chance of damaging wind over 30 yrs
- Air quality 4/10 Moderate 5 unhealthy d/yr today · 7 by 30 yrs out
Nearby sold comps map
Loading sold comps map…
Walkable amenities ~0.75 mi
Loading nearby amenities…
Taxation est. · year 1
- Rental income
- $26,145
- − Mortgage interest
- −$14,284
- − Property taxes
- −$2,967
- − Insurance
- −$1,275
- − Repairs & maintenance
- −$2,092
- − Management
- −$2,092
- − Depreciation
- −$7,418
- Taxable loss
- −$3,982
- Est. tax savings @ 24.0%
- +$956
- After-tax cash flow
- $1,321/yr
For passive investors: Depreciation is non-cash, so a rental often shows a tax loss while cash-flowing — sheltering income. Rental losses are passive: they offset passive income freely, and up to $25,000/yr can offset ordinary (W-2) income if you actively participate and your MAGI is under $100k (phasing out to $0 by $150k); unused losses carry forward. On sale, claimed depreciation is recaptured at up to 25%, and gains may owe capital-gains tax (a 1031 exchange can defer both). Figures are a year-1 estimate at your 24.0% rate — not tax advice; consult a CPA.
Schools (NCES district)
- District
- Baltimore County Public Schools
- NCES district ID
- 2400120
- Math proficiency
- 15% ▼ -16.00%
- Reading proficiency
- 34% ▼ -5.00%
- Median HH income
- $66,746
- Composite
- 23.17/100
- National rank
- #7948
- State rank
- #11 of 24 in MD
Livability — Parkville
- Score
- 77/100
- State rank
- #77
- US rank
- #2839
Category grades
Schools grade is shown separately in the Schools card above.
Census & demographics
- Census place
- Parkville, MD
- County
- Baltimore County · 769,527 people
- City population
- 66,334
- Metro
- Baltimore-Columbia-Towson, MD
- Population (ZIP)
- 66,334
- Household income
- $83,517
- Rent vs Own
- Severe rent burden
- 2719.0
Population outlook (Baltimore County) Hauer SSP2
- Today (2025)
- 885,518 people
- By 2030
- 909,272 · +2.7%
- By 2040
- 951,547 · +7.5%
- By 2050
- 990,955 · +11.9%
- By 2075
- 1,086,411 · +22.7%
- By 2100
- 1,135,078 · +28.2%
Race, ethnicity, and origin ACS 2023
- Neighborhood character
- Diverse neighborhood (Simpson 0.58)
- Race & ethnicity
- White 58% Black 28% Asian 5% Hispanic / Latino 5% Two or more races 5%
- Common ancestry
- Romanian 5% Lithuanian 1% Italian 1%
- Foreign-born
- 10% · Canada, China, South Korea
- Languages at home
- 89% English-only · Spanish 3% Other Indo-European 2% Tagalog/Filipino 1%
Political lean MEDSL · Baltimore
- 2024 margin
- Strong D (+24.5) · D 61.0% · R 36.5% · Other 2.5%
- 2008→2024 swing
- +9.9pp toward D · 2008: 14.6pp · 2024: 24.5pp
- All cycles
- 2024: D+24.5 2020: D+27.0 2016: D+17.4 2012: D+16.4 2008: D+14.6
Not yet ingested
- Civics
- —
Market trends
- HPI YoY
- ▼ -247.04%
- Current HPI
- 254.3824
- Rent YoY
- ▲ 6.68%
- Metro
- Baltimore-Columbia-Towson, MD
- State GDP YoY
- ▲ 2.97%
- F500 in state
- 12
Industry mix (Fortune 500 HQ in MD)
| Industry | F500 HQs | Revenue |
|---|---|---|
| Aerospace / Defense | 1 | $71B |
|
||
| Utilities | 1 | $25B |
|
||
| Hotels | 1 | $24B |
|
||
| Consumer Goods | 1 | $7B |
|
||
| Real Estate | 1 | $6B |
|
||
| Chemicals | 1 | $2B |
|
||
Price history
+83.5% since first listed15 events — show timeline
- 2026-06-12 Listed $255,000 BRIGHT MLS
- 2026-06-11 Coming Soon $255,000 BRIGHT MLS
- 2020-06-16 Sold (Public Records) $189,637 Public Records
- 2020-06-09 Sold (MLS) $189,637 BRIGHT MLS
- 2020-04-28 Relisted — BRIGHT MLS
- 2020-04-27 Listing Removed — BRIGHT MLS
- 2020-04-25 Listed $179,900 BRIGHT MLS
- 2012-10-02 Sold (Public Records) $139,000 Public Records
- 2012-09-21 Sold (MLS) $139,000 MRIS
- 2012-09-21 Sold (MLS) $139,000 BRIGHT MLS
- 2012-09-20 Pending — MRIS
- 2012-09-20 Listing Removed — BRIGHT MLS
- 2012-05-29 Price Changed $139,000 MRIS
- 2012-03-15 Listed $149,000 MRIS
- 2012-03-15 Listed $139,000 BRIGHT MLS
Property tax history
+2.6%/yrLatest (2025): $2,967 · +5.4% YoY. Source: county tax records.
Cash-flow waterfall
monthlySold comps — $/sqft
last 12 mo · ≤1 miLoading sold comps…