 🏷️ Likely Rental
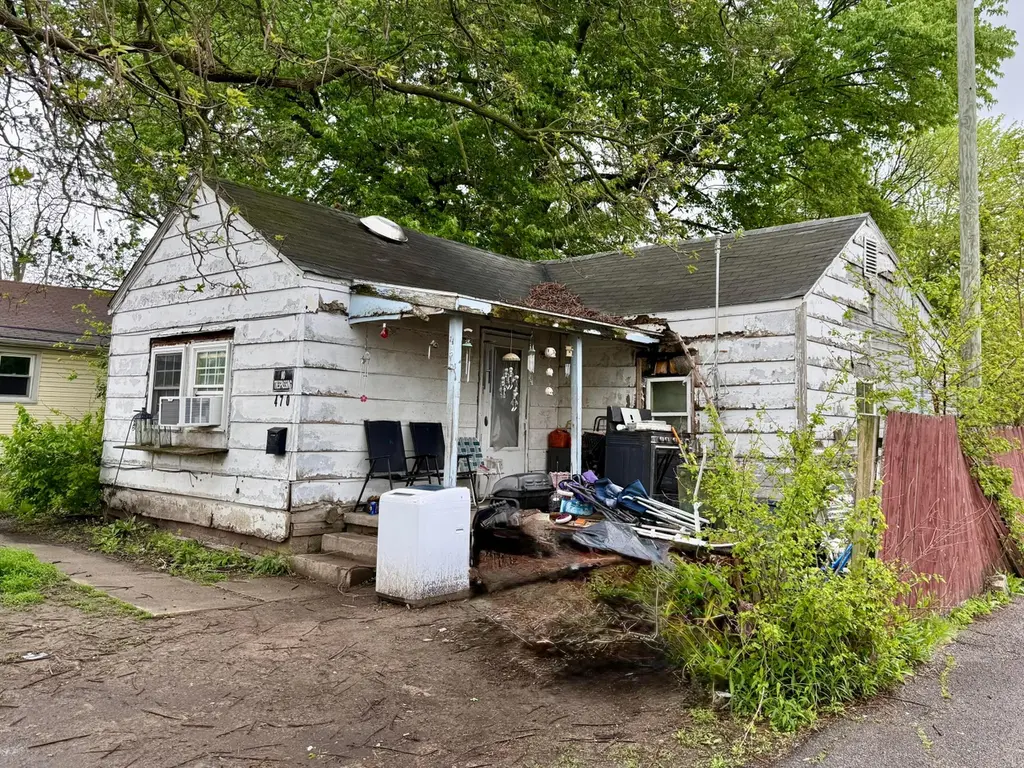
470 Jefferson St · Marion, OH
Flood risk 1/10 · Minimal
- FEMA flood zone
- X (unshaded)
- Chance of flooding over 30 yrs
- 0.0%
- Est. flood insurance / yr
- $507 – $1,088
Fire risk 1/10 · Minimal
- Est. fire insurance / yr
- $713 – $1,323
Heat risk 3/10 · Minor
- Hot days now (above 100°F)
- 7 days/yr
- Hot days in 30 yrs
- 17 days/yr
Wind risk 2/10 · Minimal
- Chance of severe wind over 30 yrs
- —
Air-quality risk 2/10 · Minimal
- Unhealthy air days now
- 1 days/yr
- Unhealthy air days in 30 yrs
- 1 days/yr
Risk factors via First Street. Map © Google.
Why this score? — see what drove the B- grade
The composite is a weighted blend of 9 inputs, each scored 0–100. Each bar is that input's sub-score; the figure is the points it added to the 100-point composite (weight × sub-score).
- Cash flow +30.0/30.0
- 1% rule +10.0/10.0
- DSCR +10.0/10.0
- ARV discount +7.5/15.0
- Livability +3.2/5.0
- Rent growth +2.5/5.0
- Condition / age +2.5/5.0
- Schools +2.2/10.0
- Appreciation +0.0/10.0
$29,900
🖨 Deal sheet 📄 Offer letter ✓ Due diligence
Listing remarks
Small two-bedroom rental property currently generating $500 per month in rental income, now offered for sale as an investment opportunity. This AS-IS property provides immediate cash flow with an established tenant in place who has expressed a strong desire to remain, offering stability for a new owner. Due to tenant occupancy, the sale is being handled with curb offers only, and interior showings will be arranged upon accepted offer. Ideal for investors seeking a low-maintenance addition to their portfolio with consistent rental history and upside potential over time.
Key facts
- 6,098 sq ft lot
- Built 1947
- Listed 49 days
Property features AI
Finance
- Financial info: 2025 property tax listed
Exterior
- Utilities: Public water; Public sewer
- Home design: Single-family residence; One story; Built in 1947; No shared/common walls
- Construction: Block foundation (existing); Built in 1947
- Exterior features: Block foundation; Lot about 0.14 acres
Interior
- Bedrooms: 2 main-level bedrooms
- Bathrooms: 1 full bathroom
- Interior features: Crawl space basement; 816 square feet of living area
Neighborhood map
What this means for you Summary
Snapshot
- This is a 2-bed/1.0-bath single-family listed at $30k.
Deal economics
- At list price, monthly cash flow is $631 ($8k/yr) — positive.
- The deal already cash-flows at list — no discount required.
- Meets the 1% rule at list price ($1k rent vs $30k).
- Recommended offer: $29k (3.0% below list) — sets the bar for market timing.
- Cap rate 31.6% vs local median 6.9% in Marion — top-decile yield for the area; either an underpriced asset or a hidden risk that comps aren't pricing in. Stress-test before assuming the spread holds.
Location & tenants
- Location reads 65/100 on livability (#704 in OH) — a middle-class / working-renter tenant base. Strengths: cost of living A+, housing A+; Watch: schools D+, crime D+, amenities F.
- Marion City (town): math 22% / reading 31% proficiency, ranked #600 of 656 in OH (top 92%) — low school quality limits family demand, transient renter base, plan for 1-2y turnover; 67% free/reduced lunch — lower-income household profile, screen leases tightly.
- Market conditions: 210 active listings in the ZIP; 1 comparable units currently listed for rent nearby; 53 units permitted in Marion County in 2024 (0 in 5+ unit buildings).
Forward outlook
- Local home prices are declining (-3.0%/yr); year-one equity from $207 of loan paydown is wiped out by about $897 of value loss. Plan a longer hold.
- Marion County population projected at -18% by 2050 — secular population decline; favor cash flow + early exit over multi-decade hold.
- At projected returns (-3.0% appreciation + 3.0% rent growth), your $8k cash investment doubles in ~2 years — after that, you're playing with house money.
Negotiation context
- It's been on market 50 days — a 3% lower offer ($29k) is reasonable based on typical stale-listing flexibility.
Risks & watch-outs
- Watch-outs: built in 1947 — expect roof / HVAC / electrical / plumbing capex.
Questions for the listing agent
- It's been on market 50 days. Have you received any prior offers? Is the seller open to a 3% concession, seller financing, or rate buy-down credit?
- Built in 1947 — when were the roof, HVAC, electrical panel, plumbing, and water heater last replaced?
- Is there a deadline driving the sale (1031 exchange, divorce, estate, relocation)? That informs how much negotiation room exists.
- Schools are D-rated, which usually means shorter tenancies and higher turnover. Who's the typical renter profile here, and what's been the actual vacancy rate?
- Crime grade is D in this area — have there been break-ins, vandalism, or insurance claims at this property in the last 3 years? What carrier currently insures it and at what premium?
- What's the average days-on-market for RENTAL listings here right now (not sales)? A rising rental-DOM trend means longer vacancies and softer asking-rent achievability than the comps imply.
- What's the recent tenant-quality profile in this submarket — average credit score on applications, eviction rate, late-payment / NSF rate, and stable-employment percentage? A property-management company in the area should have these aggregated.
- How much new for-sale + rental construction is in the pipeline within 1–3 miles? Heavy new supply typically softens prices + rents 12–24 months out; constrained supply supports both.
Investment metrics
- 1% rule
- 3.60% ✓
- Cap rate
- 31.62%
- Cash-on-cash
- 90.46%
- DSCR
- 5.02
- GRM
- 2.3
CMA / ARV
- ARV (median comp)
- $68,749
- List price
- $29,900
- Delta
- -56.51%
- Verdict
- UNDERPRICED
- Comps
- 20 within 1.0 mi
Show comp detail 12 sales within ~0.75 mi
| Address | Dist | Beds/Ba | Sqft | Sold | Price | $/sf | Match |
|---|---|---|---|---|---|---|---|
| 685 East Farming St | 0.20mi | 2/1.0 | 792 (-3%) | 10mo | $64,000 | $81 | 78 |
| 721 Robinson St | 0.33mi | 3/1.0 (+1) | 864 (+6%) | 4mo | $159,900 | $185 | 67 |
| 537 Fair Park Ave | 0.54mi | 2/1.0 | 864 (+6%) | 1mo | $120,000 | $139 | 64 |
| 659 E Mark St | 0.14mi | 3/1.0 (+1) | 896 (+10%) | 11mo | $79,000 | $88 | 63 |
| 468 Tyler St | 0.19mi | 3/1.5 (+1) | 912 (+12%) | 12mo | $149,900 | $164 | 54 |
| 393 E George St | 0.52mi | 2/1.0 | 706 (-14%) | 0mo | $138,000 | $195 | 53 |
| 222 Uhler Ave | 0.71mi | 2/1.0 | 880 (+8%) | 1mo | $155,000 | $176 | 53 |
| 576 Adams St | 0.19mi | 3/1.5 (+1) | 912 (+12%) | 14mo | $139,000 | $152 | 53 |
| 123 Sargent St | 0.64mi | 2/1.0 | 859 (+5%) | 10mo | $106,500 | $124 | 53 |
| 568 Wilson Ave | 0.48mi | 3/2.0 (+1) | 866 (+6%) | 10mo | $131,000 | $151 | 50 |
| 954 Bermuda Dr | 0.68mi | 3/1.0 (+1) | 900 (+10%) | 6mo | $142,500 | $158 | 41 |
| 560 Nassau Dr | 0.70mi | 3/1.0 (+1) | 925 (+13%) | 8mo | $157,500 | $170 | 34 |
Match score weights: distance 35% · size 25% · config 20% · recency 20%. Top-matched comps best support the ARV.
Projected returns pro-forma
-3.0% appreciation · 3.0% rent growth · sell at horizon
- IRR
- 91.2%
- Equity multiple
- 5.23×
- Total profit
- $35,373
- Equity at exit
- $4,458
- IRR
- 94.1%
- Equity multiple
- 10.87×
- Total profit
- $82,655
- Equity at exit
- $2,585
Cash invested: $8,372 (down + closing). Projections, not guarantees.
Landlord ↔ Tenant lean methodology
- Overall (STATE)
- 73 Landlord-Friendly
- State Ohio
- 73 Landlord-Friendly · R+6
- County
- — inherits STATE
- City
- — inherits STATE
ZIP-level market 43302
- Home prices YoY
- -33.9%
- Active inventory
- 210
- Price-to-rent
- 2.3×
Monthly cashflow live
- Estimated rent
- $1,076 medium interval (Pro) →
- Mortgage (P&I)
- −$157
- Tax from tax record
- −$50 /mo · $597/yr
- Insurance
- −$12
- HOA
- −$0
- Vacancy / Maint / Mgmt
- −$226
- Net cashflow
- $631
Break-even live
UW: 25.0% down · 7.5% · 30yr · 1.5% tax · 5.0% vac · 8.0% maint · 8.0% mgmt
Financing live
Cash to close
- Down payment
- $7,475
- Closing costs
- $897
- Reserves months
- —
- Total cash needed
- —
Loan-product check · same deal, 3 products live
Conventional
25% down · 7.5% · 30yr
- Down + closing
- —
- Monthly P&I
- —
- Monthly cashflow
- —
- DSCR
- —
- Eligible?
- —
Personal DTI + credit; lowest rate.
DSCR
20% down · 8.5% · 30yr
- Down + closing
- —
- Monthly P&I
- —
- Monthly cashflow
- —
- DSCR
- —
- Eligible?
- —
No personal income docs; deal must DSCR.
Hard money
10% down · 12.0% · 12mo
- Down + closing
- —
- Monthly P&I
- —
- Monthly cashflow
- —
- DSCR
- —
- Eligible?
- —
Short-term bridge; refi at stabilization.
Rent comps 1 comps
| Address | Beds | Baths | Sqft | Rent | $/sqft | DOM | Units | Dist |
|---|---|---|---|---|---|---|---|---|
| 133 Garden St Unit 131 Marion, OH | 2.0 | 1.0 | 752 | $900 | $1.20 | 43d | 1 | 1.35mi |
Listing history 20 events
-
2026-06-19days on market $29,900 Active 50 DOM
-
2026-06-18days on market $29,900 Active 49 DOM
-
2026-06-17days on market $29,900 Active 48 DOM
-
2026-06-16days on market $29,900 Active 47 DOM
-
2026-06-15days on market $29,900 Active 46 DOM
-
2026-06-14days on market $29,900 Active 44 DOM
-
2026-06-12days on market $29,900 Active 43 DOM
-
2026-06-09days on market $29,900 Active 40 DOM
-
2026-06-09price $29,900 Active 39 DOM
-
2026-06-08days on market $32,900 Active 39 DOM
-
2026-06-07days on market $32,900 Active 38 DOM
-
2026-06-05days on market $32,900 Active 35 DOM
-
2026-06-03days on market $32,900 Active 34 DOM
-
2026-06-02days on market $32,900 Active 33 DOM
-
2026-06-01days on market $32,900 Active 32 DOM
-
2026-05-31days on market $32,900 Active 31 DOM
-
2026-05-30days on market $32,900 Active 30 DOM
-
2026-05-14price $32,900 575-char remark
-
2026-04-30$34,900 Active 575-char remark
-
2021-02-19soldstatus $100,500
ⓘ Source: listings_history table (triggers on properties + properties_extension) + one-shot
backfill from property_details.listing_events for pre-trigger history.
Tax reassessment forecast OH · Partial reset (capped growth)
- Current annual tax
- $597 · $50/mo
- Projected year-2 tax
- $597 · $50/mo
- Expected delta
- $0/yr ($0/mo · 0.0%)
ⓘ Screening estimate from a state-policy table — verify with the county assessor before closing.
Climate risk First Street
- Flood 1/10 Low FEMA zone X (unshaded) · 0% chance over 30 yrs
- Wildfire 1/10 Low
- Heat 3/10 Moderate 7 d/yr ≥100°F today · 17 d/yr by 30 yrs out
- Wind 2/10 Low
- Air quality 2/10 Low 1 unhealthy d/yr today · 1 by 30 yrs out
Nearby sold comps map
Loading sold comps map…
Walkable amenities ~0.75 mi
Loading nearby amenities…
Taxation est. · year 1
- Rental income
- $12,913
- − Mortgage interest
- −$1,675
- − Property taxes
- −$597
- − Insurance
- −$150
- − Repairs & maintenance
- −$1,033
- − Management
- −$1,033
- − Depreciation
- −$870
- Taxable income
- $7,556
- Est. tax owed @ 24.0%
- −$1,813
- After-tax cash flow
- $5,760/yr
For passive investors: Depreciation is non-cash, so a rental often shows a tax loss while cash-flowing — sheltering income. Rental losses are passive: they offset passive income freely, and up to $25,000/yr can offset ordinary (W-2) income if you actively participate and your MAGI is under $100k (phasing out to $0 by $150k); unused losses carry forward. On sale, claimed depreciation is recaptured at up to 25%, and gains may owe capital-gains tax (a 1031 exchange can defer both). Figures are a year-1 estimate at your 24.0% rate — not tax advice; consult a CPA.
Schools (NCES district)
- District
- Marion City
- NCES district ID
- 3904433
- Math proficiency
- 22% ▼ -17.00%
- Reading proficiency
- 31% ▼ -8.00%
- Median HH income
- $32,327
- Composite
- 21.58/100
- National rank
- #8306
- State rank
- #600 of 656 in OH
Livability — Marion
- Score
- 65/100
- State rank
- #704
- US rank
- #12605
Category grades
Schools grade is shown separately in the Schools card above.
Census & demographics
- Census place
- Marion, OH
- County
- Marion County · 53,702 people
- City population
- 53,702
- Metro
- Marion, OH
- Population (ZIP)
- 53,702
- Household income
- $55,057
- Rent vs Own
- Severe rent burden
- 1554.0
Population outlook (Marion County) Hauer SSP2
- Today (2025)
- 62,078 people
- By 2030
- 60,049 · -3.3%
- By 2040
- 55,413 · -10.7%
- By 2050
- 50,604 · -18.5%
- By 2075
- 40,162 · -35.3%
- By 2100
- 29,105 · -53.1%
Race, ethnicity, and origin ACS 2023
- Neighborhood character
- Predominantly White (85%)
- Race & ethnicity
- White 85% Black 6% Two or more races 6% Hispanic / Latino 3%
- Common ancestry
- Slovak 2% Romanian 2% Lithuanian 2%
- Foreign-born
- 2% · Canada
- Languages at home
- 96% English-only · Spanish 2% Arabic 1%
Political lean MEDSL · Marion
- 2024 margin
- Solid R (+41.4) · D 28.9% · R 70.3%
- 2008→2024 swing
- -32.5pp toward R · 2008: -8.9pp · 2024: -41.4pp
- All cycles
- 2024: R+41.4 2020: R+38.6 2016: R+34.4 2012: R+7.6 2008: R+8.9
Not yet ingested
- Civics
- —
Market trends
- HPI YoY
- ▼ -114.52%
- Current HPI
- 223.5344
- Rent YoY
- —
- Metro
- Marion, OH
- State GDP YoY
- ▲ 1.98%
- F500 in state
- 48
Industry mix (Fortune 500 HQ in OH)
| Industry | F500 HQs | Revenue |
|---|---|---|
| Insurance | 3 | $145B |
|
||
| Industrial Machinery | 3 | $49B |
|
||
| Financial Services | 3 | $24B |
|
||
| Consumer Goods | 2 | $93B |
|
||
| Aerospace / Defense | 2 | $47B |
|
||
| Utilities | 2 | $33B |
|
||
Price history
-70.2% since first listed4 events — show timeline
- 2026-06-08 Price Changed $29,900 CBRMLS
- 2026-05-14 Price Changed $32,900 CBRMLS
- 2026-04-30 Listed $34,900 CBRMLS
- 2021-02-19 Sold (Public Records) $100,500 Public Records
Property tax history
+6.9%/yrLatest (2025): $597 · +0.0% YoY. Source: county tax records.
Cash-flow waterfall
monthlySold comps — $/sqft
last 12 mo · ≤1 miLoading sold comps…