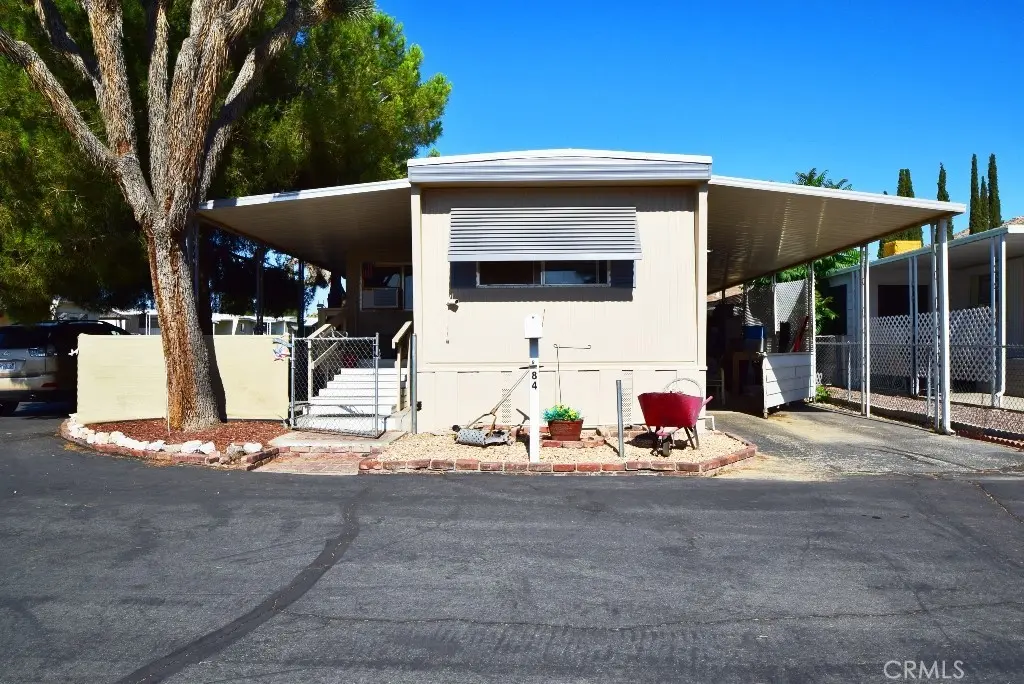
56254 29 Palms Hwy #84 · Yucca Valley, CA
Flood risk 1/10 · Minimal
- FEMA flood zone
- X (unshaded)
- Chance of flooding over 30 yrs
- 0.0%
- Est. flood insurance / yr
- $507 – $1,088
Fire risk 5/10 · Moderate
- Est. fire insurance / yr
- $659 – $1,223
Heat risk 6/10 · Moderate
- Hot days now (above 97°F)
- 7 days/yr
- Hot days in 30 yrs
- 21 days/yr
Wind risk 1/10 · Minimal
- Chance of severe wind over 30 yrs
- —
Air-quality risk 7/10 · Major
- Unhealthy air days now
- 13 days/yr
- Unhealthy air days in 30 yrs
- 17 days/yr
Risk factors via First Street. Map © Google.
Why this score? — see what drove the B- grade
The composite is a weighted blend of 9 inputs, each scored 0–100. Each bar is that input's sub-score; the figure is the points it added to the 100-point composite (weight × sub-score).
- Cash flow +30.0/30.0
- 1% rule +10.0/10.0
- DSCR +10.0/10.0
- ARV discount +7.1/15.0
- Rent growth +3.5/5.0
- Livability +3.0/5.0
- Schools +2.2/10.0
- Condition / age +2.2/5.0
- Appreciation +0.0/10.0
$36,000
🖨 Deal sheet 📄 Offer letter ✓ Due diligence
Listing remarks
Charming Single Wide on Corner Lot – 2 Bed, 2 Bath with Enclosed Patio! Don't miss this beautifully maintained single wide mobile home situated on a desirable corner lot! Featuring 2 spacious bedrooms , 1 full bathrooms, and 3/4 bathroom, this home offers comfort and functionality throughout. Enjoy the bright and airy living space, a cozy kitchen, and the convenience of in-home laundry connections. Step outside to a fully enclosed patio – perfect for relaxing, entertaining, or extra storage. This inviting property combines indoor-outdoor living with plenty of privacy and charm. A must-see for anyone seeking affordability without compromising on comfort! Overall, a single-wide m
Key facts
- Corner lot
- Enclosed patio
- Community pool
Tags
Property features AI
Finance
- Other: Living area source: public records; Property coordinates: latitude 34.12613, longitude -116.436167; Directions: from Hwy 62 take Church St north to the park entrance
- Financial info: Land lease applies (approximately $415 monthly)
- HOA & community: Senior community (park designated for seniors); Located in Apache Senior Park; Rural community setting; Manager approval required for residency; Pets allowed — contact manager
Exterior
- Parking: Paved parking; Attached carport
- Utilities: Public/district water; Public sewer and soils analysis septic
- Home design: Single-story mobile home; Mobile home remains on site; Mobile dimensions approximately 12 ft wide by 58 ft long; Faces/entry at ground level
- Construction: Year built source: public records; Single-story construction
- Exterior features: Community pool; Paved surroundings
Interior
- Kitchen: Gas range; Dishwasher
- Bedrooms: All bedrooms located on the ground floor
- Flooring: Laminated flooring
- Bathrooms: 1 full bathroom; 1 three-quarter bathroom
- Heating & cooling: Central furnace heating; Wall/window cooling; Evaporative cooling
- Interior features: All bedrooms on main level; One-level living (single story); Main entry at ground level
- Laundry & utility: Laundry inside the home
Neighborhood map
What this means for you Summary
Snapshot
- This is a 2-bed/2.0-bath manufactured listed at $36k. Condition is rated fair.
Deal economics
- At list price, monthly cash flow is $856 ($10k/yr) — positive.
- The deal already cash-flows at list — no discount required.
- Meets the 1% rule at list price ($1k rent vs $36k).
- Recommended offer: $35k (3.0% below list) — sets the bar for market timing.
- Cap rate 34.8% vs local median 3.6% in Yucca Valley — top-decile yield for the area; either an underpriced asset or a hidden risk that comps aren't pricing in. Stress-test before assuming the spread holds.
Location & tenants
- Location reads 60/100 on livability (#566 in CA) — a middle-class / working-renter tenant base. Strengths: commute A+, housing A+; Watch: cost of living D+, schools F, crime D-.
- Morongo Unified (town): math 15% / reading 38% proficiency, ranked #395 of 517 in CA (top 76%) — low school quality limits family demand, transient renter base, plan for 1-2y turnover.
- Market conditions: Rents rising fast (+4.1%/yr); 563 active listings in the ZIP; 4 comparable units currently listed for rent nearby; rentals at typical pace (median 15d on market — plan ~3-4 weeks tenant-placement turnaround); 5,458 units permitted in San Bernardino County in 2024 (1,500 in 5+ unit buildings).
Forward outlook
- Local home prices are declining (-3.0%/yr); year-one equity from $249 of loan paydown is wiped out by about $1k of value loss. Plan a longer hold.
- San Bernardino County population projected at +15% by 2050 — modest demand growth; plan on rents tracking national, not racing it.
- At projected returns (-3.0% appreciation + 4.1% rent growth), your $10k cash investment doubles in ~2 years — after that, you're playing with house money.
Negotiation context
- It's been on market 42 days — a 3% lower offer ($35k) is reasonable based on typical stale-listing flexibility.
- 2 sale attempts with the ask held roughly flat each time — persistent listings suggest the price (not the market) is what's stuck; bring a comps-based counter.
Risks & watch-outs
- Climate carrying-cost: moderate wildfire risk; extreme-heat days projected 7→21/yr by 2055 (HVAC capex compounding) — expect insurance premiums to compound above CPI over the hold.
Questions for the listing agent
- It's been on market 42 days. Have you received any prior offers? Is the seller open to a 3% concession, seller financing, or rate buy-down credit?
- Have any recent inspections been done? Can we get a copy of the seller's disclosures and any deferred-maintenance estimates?
- Built in 1968 — when were the roof, HVAC, electrical panel, plumbing, and water heater last replaced?
- Is there a deadline driving the sale (1031 exchange, divorce, estate, relocation)? That informs how much negotiation room exists.
- Schools are F-rated, which usually means shorter tenancies and higher turnover. Who's the typical renter profile here, and what's been the actual vacancy rate?
- Crime grade is D in this area — have there been break-ins, vandalism, or insurance claims at this property in the last 3 years? What carrier currently insures it and at what premium?
- What's the average days-on-market for RENTAL listings here right now (not sales)? A rising rental-DOM trend means longer vacancies and softer asking-rent achievability than the comps imply.
- What's the recent tenant-quality profile in this submarket — average credit score on applications, eviction rate, late-payment / NSF rate, and stable-employment percentage? A property-management company in the area should have these aggregated.
- How much new for-sale + rental construction is in the pipeline within 1–3 miles? Heavy new supply typically softens prices + rents 12–24 months out; constrained supply supports both.
Investment metrics
- 1% rule
- 3.88% ✓
- Cap rate
- 34.82%
- Cash-on-cash
- 101.89%
- DSCR
- 5.53
- GRM
- 2.1
CMA / ARV
- ARV (median comp)
- $35,704
- List price
- $36,000
- Delta
- 0.83%
- Verdict
- FAIR
- Comps
- 6 within 1.0 mi
Show comp detail 10 sales within ~0.75 mi
| Address | Dist | Beds/Ba | Sqft | Sold | Price | $/sf | Match |
|---|---|---|---|---|---|---|---|
| 56254 29 Palms Hwy #120 | 0.07mi | 1/1.0 (-1) | 720 (+3%) | 1mo | $32,000 | $44 | 81 |
| 56254-29 Palms #59 | 0.14mi | 1/1.0 (-1) | 672 (-3%) | 11mo | $30,000 | $45 | 70 |
| 56254 29 Palms Hwy #38 | 0.07mi | 1/1.0 (-1) | 780 (+12%) | 0mo | $50,000 | $64 | 67 |
| 56254 29 Palms Hwy #66 | 0.34mi | 2/2.0 | 720 (+3%) | 16mo | $47,500 | $66 | 65 |
| 56254 29 Palms Hwy #41 | 0.34mi | 1/1.0 (-1) | 672 (-3%) | 13mo | $37,000 | $55 | 58 |
| 7425 Church St #58 | 0.64mi | 2/1.0 | 696 (0%) | 20mo | $33,000 | $47 | 50 |
| 7425 Church St #59 | 0.62mi | 2/1.5 | 780 (+12%) | 4mo | $25,000 | $32 | 46 |
| 56254 29 Palms Hwy #29 | 0.34mi | 1/1.0 (-1) | 600 (-14%) | 8mo | $40,000 | $67 | 45 |
| 7425 Church St #43 | 0.59mi | 1/1.0 (-1) | 728 (+5%) | 18mo | $24,500 | $34 | 40 |
| 7425 Church St #97 | 0.64mi | 2/2.0 | 800 (+15%) | 12mo | $41,500 | $52 | 36 |
Match score weights: distance 35% · size 25% · config 20% · recency 20%. Top-matched comps best support the ARV.
Projected returns pro-forma
-3.0% appreciation · 4.12% rent growth · sell at horizon
- IRR
- —
- Equity multiple
- 5.99×
- Total profit
- $50,294
- Equity at exit
- $5,368
- IRR
- —
- Equity multiple
- 12.98×
- Total profit
- $120,763
- Equity at exit
- $3,113
Cash invested: $10,080 (down + closing). Projections, not guarantees.
Landlord ↔ Tenant lean methodology
- Overall (STATE)
- 18 Strongly Tenant-Friendly
- State California
- 18 Strongly Tenant-Friendly · D+13
- County
- — inherits STATE
- City
- — inherits STATE
ZIP-level market 92284
- Home prices YoY
- -33.1%
- Rents YoY
- 4.1%
- Active inventory
- 563
- Price-to-rent
- 2.1×
Monthly cashflow live
- Estimated rent
- $1,398 medium interval (Pro) →
- Mortgage (P&I)
- −$189
- Tax est. 1.5%
- −$45 /mo · $540/yr
- Insurance
- −$15
- HOA
- −$0
- Vacancy / Maint / Mgmt
- −$294
- Net cashflow
- $856
Break-even live
UW: 25.0% down · 7.5% · 30yr · 1.5% tax · 5.0% vac · 8.0% maint · 8.0% mgmt
Financing live
Cash to close
- Down payment
- $9,000
- Closing costs
- $1,080
- Reserves months
- —
- Total cash needed
- —
Loan-product check · same deal, 3 products live
Conventional
25% down · 7.5% · 30yr
- Down + closing
- —
- Monthly P&I
- —
- Monthly cashflow
- —
- DSCR
- —
- Eligible?
- —
Personal DTI + credit; lowest rate.
DSCR
20% down · 8.5% · 30yr
- Down + closing
- —
- Monthly P&I
- —
- Monthly cashflow
- —
- DSCR
- —
- Eligible?
- —
No personal income docs; deal must DSCR.
Hard money
10% down · 12.0% · 12mo
- Down + closing
- —
- Monthly P&I
- —
- Monthly cashflow
- —
- DSCR
- —
- Eligible?
- —
Short-term bridge; refi at stabilization.
Rent comps 4 comps
| Address | Beds | Baths | Sqft | Rent | $/sqft | DOM | Units | Dist |
|---|---|---|---|---|---|---|---|---|
| 7389 Cibola Trl Unit B Yucca Valley, CA | 2.0 | 1.0 | 750 | $1,100 | $1.47 | 15d | 1 | 0.51mi |
| 7239 Cherokee Trl Yucca Valley, CA | 1.0 | 1.0 | 550 | $1,429 | $2.60 | 1d | 1 | 0.51mi |
| 7434 Cherokee Trl Unit D Yucca Valley, CA | 1.0 | 1.0 | 608 | $1,100 | $1.81 | 43d | 1 | 0.75mi |
| 7330 Dumosa Ave Unit 7330 Yucca Valley, CA | 2.0 | 1.0 | 750 | $1,195 | $1.59 | 2d | 1 | 1.19mi |
Listing history 19 events
-
2026-06-18days on market $36,000 Active 42 DOM
-
2026-06-17days on market $36,000 Active 41 DOM
-
2026-06-16days on market $36,000 Active 40 DOM
-
2026-06-15days on market $36,000 Active 39 DOM
-
2026-06-13days on market $36,000 Active 37 DOM
-
2026-06-13days on market $36,000 Active 36 DOM
-
2026-06-09days on market $36,000 Active 33 DOM
-
2026-06-08days on market $36,000 Active 32 DOM
-
2026-06-07days on market $36,000 Active 31 DOM
-
2026-06-04days on market $36,000 Active 28 DOM
-
2026-06-03days on market $36,000 Active 27 DOM
-
2026-06-02days on market $36,000 Active 26 DOM
-
2026-06-01days on market $36,000 Active 25 DOM
-
2026-05-31days on market $36,000 Active 24 DOM
-
2026-05-07$36,000 Active 820-char remark
-
2025-12-23historical
-
2025-10-09price $48,500
-
2025-08-04price $52,500
-
2025-07-03$59,500 Active
ⓘ Source: listings_history table (triggers on properties + properties_extension) + one-shot
backfill from property_details.listing_events for pre-trigger history.
Climate risk First Street
- Flood 1/10 Low FEMA zone X (unshaded) · 0% chance over 30 yrs
- Wildfire 5/10 Major
- Heat 6/10 Major 7 d/yr ≥97°F today · 21 d/yr by 30 yrs out
- Wind 1/10 Low
- Air quality 7/10 Severe 13 unhealthy d/yr today · 17 by 30 yrs out
Nearby sold comps map
Loading sold comps map…
Walkable amenities ~0.75 mi
Loading nearby amenities…
Taxation est. · year 1
- Rental income
- $16,780
- − Mortgage interest
- −$2,017
- − Property taxes
- −$540
- − Insurance
- −$180
- − Repairs & maintenance
- −$1,342
- − Management
- −$1,342
- − Depreciation
- −$1,047
- Taxable income
- $10,311
- Est. tax owed @ 24.0%
- −$2,475
- After-tax cash flow
- $7,796/yr
For passive investors: Depreciation is non-cash, so a rental often shows a tax loss while cash-flowing — sheltering income. Rental losses are passive: they offset passive income freely, and up to $25,000/yr can offset ordinary (W-2) income if you actively participate and your MAGI is under $100k (phasing out to $0 by $150k); unused losses carry forward. On sale, claimed depreciation is recaptured at up to 25%, and gains may owe capital-gains tax (a 1031 exchange can defer both). Figures are a year-1 estimate at your 24.0% rate — not tax advice; consult a CPA.
Condition & rehab AI · 12 photos
This single-wide mobile home requires moderate repairs and maintenance to improve its condition and value. Exterior siding and flooring are in poor condition, while paint and kitchen/bathroom fixtures are dated. Fresh siding, new flooring, and updated paint would significantly enhance the home's curb appeal and value.
Repairs flagged
- Major Exterior siding — Significant wear and tear
- Moderate Flooring — Worn and in need of replacement
- Moderate Paint — Chipped and worn in some areas
- Minor Kitchen cabinets — Functional but dated
- Minor Bathroom fixtures — Functional but dated
- Minor HVAC unit — May need maintenance
Value-add opportunities
- Resale Exterior siding replacement — Fresh siding would significantly improve curb appeal
- Resale Flooring replacement — New flooring would improve the overall look and feel of the home
- Resale Painting — Fresh paint would improve the home's appearance and value
- Resale Kitchen updates — Modernizing the kitchen would increase the home's appeal and value
- Resale Bathroom updates — Modernizing the bathrooms would increase the home's appeal and value
- Rental HVAC maintenance — A functional HVAC system is essential for rental properties
Renovation cost estimate screening
| Repair item | Severity | Est. cost |
|---|---|---|
| Exterior siding · Significant wear and tear | Major | $15,000–50,000 |
| Flooring · Worn and in need of replacement | Moderate | $3,000–15,000 |
| Paint · Chipped and worn in some areas | Moderate | $3,000–15,000 |
| Kitchen cabinets · Functional but dated | Minor | $500–3,000 |
| Bathroom fixtures · Functional but dated | Minor | $500–3,000 |
| HVAC unit · May need maintenance | Minor | $500–3,000 |
| Total estimated repair cost · 6 items | $22,500–89,000 |
Value-add ROI direction
- Resale Exterior siding replacement — Fresh siding would significantly improve curb appeal ↑
- Resale Flooring replacement — New flooring would improve the overall look and feel of the home ↑
- Resale Painting — Fresh paint would improve the home's appearance and value ↑
- Resale Kitchen updates — Modernizing the kitchen would increase the home's appeal and value ↑
- Resale Bathroom updates — Modernizing the bathrooms would increase the home's appeal and value ↑
- Rental HVAC maintenance — A functional HVAC system is essential for rental properties ↑
ⓘ Cost ranges are severity-bucket heuristics (US national rule-of-thumb). Get contractor quotes + a written scope before underwriting a rehab budget.
Schools (NCES district)
- District
- Morongo Unified
- NCES district ID
- 0625860
- Math proficiency
- 15% ▼ -12.00%
- Reading proficiency
- 38% ▼ -3.00%
- Median HH income
- $39,399
- Composite
- 22.19/100
- National rank
- #8156
- State rank
- #395 of 517 in CA
Livability — Yucca Valley
- Score
- 60/100
- State rank
- #566
- US rank
- #18584
Category grades
Schools grade is shown separately in the Schools card above.
Census & demographics
- Census place
- Yucca Valley, CA
- County
- San Bernardino County · 2,030,291 people
- City population
- 25,415
- Metro
- Riverside-San Bernardino-Ontario, CA
- Population (ZIP)
- 25,415
- Household income
- $58,373
- Rent vs Own
- Severe rent burden
- 1132.0
Population outlook (San Bernardino County) Hauer SSP2
- Today (2025)
- 2,300,329 people
- By 2030
- 2,378,907 · +3.4%
- By 2040
- 2,523,137 · +9.7%
- By 2050
- 2,642,388 · +14.9%
- By 2075
- 2,880,769 · +25.2%
- By 2100
- 2,909,436 · +26.5%
Race, ethnicity, and origin ACS 2023
- Neighborhood character
- Diverse neighborhood (Simpson 0.55)
- Race & ethnicity
- White 62% Hispanic / Latino 25% Two or more races 18% Black 2% Native American 2% Asian 2% Pacific Islander 1%
- Hispanic origin (detail)
- Mexican 20%
- Common ancestry
- Italian 4% Romanian 2% Slovak 2%
- Foreign-born
- 9% · Canada
- Languages at home
- 82% English-only · Spanish 14% Other Indo-European 1% Other Asian/Pacific 1%
Political lean MEDSL · San Bernardino
- 2024 margin
- Toss-up / Even · D 47.5% · R 49.7% · Other 2.8%
- 2008→2024 swing
- -8.5pp toward R · 2008: 6.3pp · 2024: -2.1pp
- All cycles
- 2024: R+2.1 2020: D+10.7 2016: D+9.8 2012: D+5.4 2008: D+6.3
Not yet ingested
- Civics
- —
Market trends
- HPI YoY
- ▼ -241.13%
- Current HPI
- 486.7185
- Rent YoY
- ▲ 4.12%
- Metro
- Riverside-San Bernardino-Ontario, CA
- State GDP YoY
- ▲ 3.21%
- F500 in state
- 116
Industry mix (Fortune 500 HQ in CA)
| Industry | F500 HQs | Revenue |
|---|---|---|
| Technology | 27 | $1,492B |
|
||
| Financial Services | 3 | $174B |
|
||
| Retail | 3 | $44B |
|
||
| Insurance | 3 | $26B |
|
||
| Media / Entertainment | 2 | $115B |
|
||
| Pharmaceuticals / Biotech | 2 | $62B |
|
||
Price history
-39.5% since first listed5 events — show timeline
- 2026-05-07 Listed $36,000 CRMLS
- 2025-12-23 Listing Removed — CRMLS
- 2025-10-09 Price Changed $48,500 CRMLS
- 2025-08-04 Price Changed $52,500 CRMLS
- 2025-07-03 Listed $59,500 CRMLS
Cash-flow waterfall
monthlySold comps — $/sqft
last 12 mo · ≤1 miLoading sold comps…