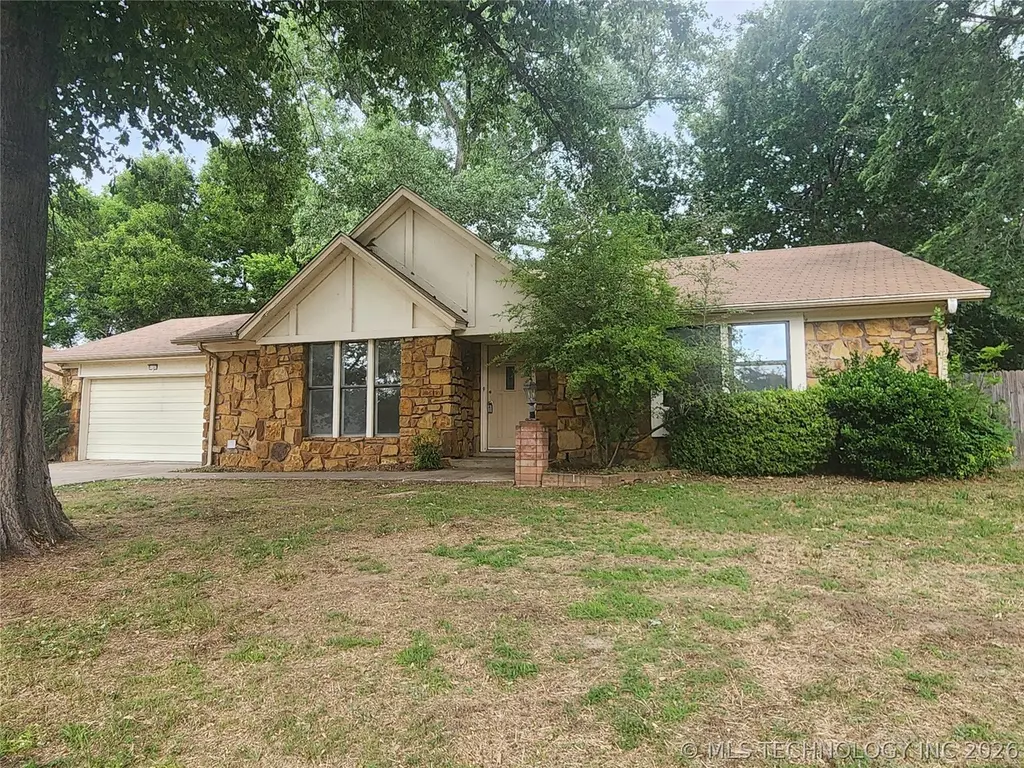
11387 S Date St · Jenks, OK
Flood risk 1/10 · Minimal
- FEMA flood zone
- X (unshaded)
- Chance of flooding over 30 yrs
- 0.0%
- Est. flood insurance / yr
- $473 – $860
Fire risk 6/10 · Moderate
- Est. fire insurance / yr
- $2,463 – $4,575
Heat risk 6/10 · Moderate
- Hot days now (above 111°F)
- 7 days/yr
- Hot days in 30 yrs
- 18 days/yr
Wind risk 3/10 · Minor
- Chance of severe wind over 30 yrs
- 4.0%
Air-quality risk 2/10 · Minimal
- Unhealthy air days now
- 1 days/yr
- Unhealthy air days in 30 yrs
- 1 days/yr
Risk factors via First Street. Map © Google.
Why this score? — see what drove the C+ grade
The composite is a weighted blend of 9 inputs, each scored 0–100. Each bar is that input's sub-score; the figure is the points it added to the 100-point composite (weight × sub-score).
- Cash flow +24.0/30.0
- ARV discount +15.0/15.0
- DSCR +7.7/10.0
- 1% rule +5.6/10.0
- Livability +3.6/5.0
- Rent growth +3.3/5.0
- Schools +3.2/10.0
- Condition / age +2.5/5.0
- Appreciation +0.0/10.0
$204,900
🖨 Deal sheet (PDF) 📄 Offer letter ✓ Due diligence
Listing remarks MLS
Totally updated, freshly painted outside, absoulte mint condition, mature trees, & landscaping, new guttering, a must to see.
Key facts
- Flexible floor plan
- Cozy fireplace
- 9,034 sq ft lot
Tags
Property features AI
Finance
- Financial info: Pets allowed
- HOA & community: Sidewalks in the community
Exterior
- Parking: Attached garage (2 spaces)
- Security: No safety shelter
- Utilities: Electricity available; Natural gas available; High-speed internet available; Public water; Public sewer
- Home design: One-story home; Handicap accessible; Faces southwest; Crawlspace foundation
- Construction: Stone veneer and wood frame construction; Metal roof
- Exterior features: Concrete driveway; Patio; Storage structure; Partial privacy fencing; Sloping topography with mature trees
Interior
- Kitchen: Country-style kitchen; Oven; Range; Dishwasher; Refrigerator; Plumbed for ice maker
- Bedrooms: Master bedroom with private bath and walk-in closet (First level); Additional bedrooms without private baths (First level)
- Flooring: Carpet; Tile
- Bathrooms: Two full bathrooms (including a master bath and a hall bath)
- Heating & cooling: Central heating (electric and gas); Central air conditioning
- Interior features: High ceilings; Laminate counters; Cable TV available; Ceiling fans; Programmable thermostat; Vinyl windows; Accessible full bath; Accessible entrance
- Laundry & utility: Washer hookup; Electric dryer hookup; Gas dryer hookup; Separate inside utility room (First level)
Neighborhood map
What this means for you Summary
Snapshot
- This is a 3-bed/2.0-bath single-family listed at $205k.
Deal economics
- At list price, monthly cash flow is $402 ($5k/yr) — positive.
- The deal already cash-flows at list — no discount required.
- Meets the 1% rule at list price ($2k rent vs $205k).
- Recommended offer: $199k (3.0% below list) — sets the bar for market timing.
- Cap rate 8.6% vs local median 3.5% in Jenks — top-decile yield for the area; either an underpriced asset or a hidden risk that comps aren't pricing in. Stress-test before assuming the spread holds.
Location & tenants
- Location reads 71/100 on livability (#33 in OK) — a middle-class / working-renter tenant base. Strengths: employment A+, housing A+, crime A; Watch: amenities F, commute F, health & safety F.
- Jenks (suburban): math 34% / reading 35% proficiency, ranked #27 of 270 in OK (top 10%) — families likely to look elsewhere, expect single-tenant / working-renter base with shorter leases.
- Market conditions: Rents rising (+3.2%/yr); 262 active listings in the ZIP; 4 comparable units currently listed for rent nearby; rentals leasing fast (median 3d on market — plan ~1-2 weeks tenant-placement turnaround); solid renter incomes; 2,818 units permitted in Tulsa County in 2024 (518 in 5+ unit buildings).
Forward outlook
- Local home prices are declining (-3.0%/yr); year-one equity from $1k of loan paydown is wiped out by about $6k of value loss. Plan a longer hold.
- Tulsa County population projected at +30% by 2050 — long-run rental-demand tailwind backs the buy-and-hold thesis.
Negotiation context
- It's been on market 34 days — a 3% lower offer ($199k) is reasonable based on typical stale-listing flexibility.
- 8 sale attempts since 31y ago; this cycle's ask has dropped $15k (7%) from the opening price — seller is motivated, your offer sets the floor, not the list.
- Current owner paid $110k; list at $205k implies a 86% gain — meaningful room to come down on a strong offer.
Risks & watch-outs
- Climate carrying-cost: major wildfire risk; extreme-heat days projected 7→18/yr by 2055 (HVAC capex compounding) — expect insurance premiums to compound above CPI over the hold.
Questions for the listing agent
- It's been on market 34 days. Have you received any prior offers? Is the seller open to a 3% concession, seller financing, or rate buy-down credit?
- Is there a deadline driving the sale (1031 exchange, divorce, estate, relocation)? That informs how much negotiation room exists.
- What's the average days-on-market for RENTAL listings here right now (not sales)? A rising rental-DOM trend means longer vacancies and softer asking-rent achievability than the comps imply.
- What's the recent tenant-quality profile in this submarket — average credit score on applications, eviction rate, late-payment / NSF rate, and stable-employment percentage? A property-management company in the area should have these aggregated.
- How much new for-sale + rental construction is in the pipeline within 1–3 miles? Heavy new supply typically softens prices + rents 12–24 months out; constrained supply supports both.
Investment metrics
- 1% rule
- 1.06% ✓
- Cap rate
- 8.65%
- Cash-on-cash
- 8.40%
- DSCR
- 1.37
- GRM
- 7.9
CMA / ARV
- ARV (on-the-fly)
- $255,798
- Comps found
- 12
Show comp detail 12 sales within ~0.75 mi
| Address | Dist | Beds/Ba | Sqft | Sold | Price | $/sf | Match |
|---|---|---|---|---|---|---|---|
| 74 Fox Run Cir | 0.10mi | 3/2.0 | 1,597 (+1%) | 10mo | $238,000 | $149 | 85 |
| 211 W 114th Ct S | 0.09mi | 3/2.0 | 1,724 (+9%) | 1mo | $280,000 | $162 | 80 |
| 11106 S 1st St | 0.28mi | 3/2.0 | 1,481 (-6%) | 1mo | $265,000 | $179 | 76 |
| 11701 S Forest Ct | 0.43mi | 3/2.0 | 1,762 (+12%) | 0mo | $300,000 | $170 | 60 |
| 11702 S Gum Ave | 0.49mi | 3/2.0 | 1,731 (+10%) | 1mo | $270,000 | $156 | 60 |
| 11722 S Gum Ave | 0.60mi | 3/2.0 | 1,652 (+5%) | 7mo | $249,900 | $151 | 59 |
| 119 Fox Run Cir | 0.20mi | 3/2.0 | 1,792 (+14%) | 12mo | $210,000 | $117 | 58 |
| 11709 S Forest Ct | 0.45mi | 3/2.0 | 1,709 (+8%) | 12mo | $263,000 | $154 | 55 |
| 712 W 119th St S | 0.64mi | 3/2.0 | 1,474 (-7%) | 5mo | $250,000 | $170 | 55 |
| 626 W 120th St | 0.72mi | 3/2.0 | 1,438 (-9%) | 4mo | $255,000 | $177 | 48 |
| 1021 W 117th St S | 0.59mi | 3/2.0 | 1,769 (+12%) | 13mo | $243,000 | $137 | 42 |
| 11508 S Locust Ave | 0.70mi | 3/2.0 | 1,750 (+11%) | 11mo | $290,000 | $166 | 41 |
Match score weights: distance 35% · size 25% · config 20% · recency 20%. Top-matched comps best support the ARV.
Projected returns pro-forma
-3.0% appreciation · 3.2% rent growth · sell at horizon
- IRR
- -3.3%
- Equity multiple
- 0.87×
- Total profit
- $-7,209
- Equity at exit
- $30,551
- IRR
- 6.5%
- Equity multiple
- 1.49×
- Total profit
- $28,331
- Equity at exit
- $17,716
Cash invested: $57,372 (down + closing). Projections, not guarantees.
Landlord ↔ Tenant lean methodology
- Overall (STATE)
- 83 Strongly Landlord-Friendly
- State Oklahoma
- 83 Strongly Landlord-Friendly · R+20
- County
- — inherits STATE
- City
- — inherits STATE
ZIP-level market 74037
- Home prices YoY
- -23.3%
- Rents YoY
- 3.2%
- Active inventory
- 262
- Price-to-rent
- 7.9×
Monthly cashflow live
- Estimated rent
- $2,162 medium interval (Pro) →
- Mortgage (P&I)
- −$1,075
- Tax from tax record
- −$146 /mo · $1,757/yr
- Insurance
- −$85
- HOA
- −$0
- Vacancy / Maint / Mgmt
- −$454
- Net cashflow
- $402
Break-even live
Sensitivity live
| Price | -10% $518 | -5% $460 | +0% $402 | +5% $344 | +10% $286 |
|---|---|---|---|---|---|
| Rent | -10% $231 | -5% $316 | +0% $402 | +5% $487 | +10% $573 |
| Rate | -1.0pp $505 | -0.5pp $454 | base $402 | +0.5pp $349 | +1.0pp $295 |
UW: 25.0% down · 7.5% · 30yr · 1.5% tax · 5.0% vac · 8.0% maint · 8.0% mgmt
Financing live
Cash to close
- Down payment
- $51,225
- Closing costs
- $6,147
- Reserves months
- —
- Total cash needed
- —
Loan-product check · same deal, 3 products live
Conventional
25% down · 7.5% · 30yr
- Down + closing
- —
- Monthly P&I
- —
- Monthly cashflow
- —
- DSCR
- —
- Eligible?
- —
Personal DTI + credit; lowest rate.
DSCR
20% down · 8.5% · 30yr
- Down + closing
- —
- Monthly P&I
- —
- Monthly cashflow
- —
- DSCR
- —
- Eligible?
- —
No personal income docs; deal must DSCR.
Hard money
10% down · 12.0% · 12mo
- Down + closing
- —
- Monthly P&I
- —
- Monthly cashflow
- —
- DSCR
- —
- Eligible?
- —
Short-term bridge; refi at stabilization.
Rent comps 4 comps
| Address | Beds | Baths | Sqft | Rent | $/sqft | DOM | Units | Dist |
|---|---|---|---|---|---|---|---|---|
| 806 W 118th St S Jenks, OK | 3.0 | 3.0 | 1950 | $2,299 | $1.18 | 2d | 1 | 0.60mi |
| 1224 W 112th Dr S Jenks, OK | 3.0 | 3.0 | 1818 | $1,950 | $1.07 | 17d | 1 | 0.67mi |
| 11906 S Juniper Ct Jenks, OK | 3.0 | 2.0 | 1799 | $2,200 | $1.22 | 2d | 1 | 0.86mi |
| 701 W 101st Pl S Jenks, OK | 1.0–2.0 | 1.0–2.0 | 982 | $1,674 | $1.70 | 2d | 17 | 1.41mi |
Listing history 39 events
-
2026-06-21days on market $204,900 Active 34 DOM
-
2026-06-18price $204,900 Active 31 DOM
-
2026-06-18days on market $219,900 Active 31 DOM
-
2026-06-17days on market $219,900 Active 30 DOM
-
2026-06-16days on market $219,900 Active 29 DOM
-
2026-06-15days on market $219,900 Active 28 DOM
-
2026-06-13days on market $219,900 Active 26 DOM
-
2026-06-13days on market $219,900 Active 25 DOM
-
2026-06-10days on market $219,900 Active 23 DOM
-
2026-06-09days on market $219,900 Active 22 DOM
-
2026-06-08days on market $219,900 Active 21 DOM
-
2026-06-07days on market $219,900 Active 20 DOM
-
2026-06-05days on market $219,900 Active 17 DOM
-
2026-06-03days on market $219,900 Active 16 DOM
-
2026-06-02days on market $219,900 Active 15 DOM
-
2026-06-01days on market $219,900 Active 14 DOM
-
2026-05-31days on market $219,900 Active 13 DOM
-
2026-05-18$219,900 Active
-
2002-05-06soldstatus $110,000
-
2002-05-03soldstatus $109,900 130-char remark
Show marketing remark (130 chars)
Totally updated, freshly painted outside, absoulte mint condition, mature trees, & landscaping, new guttering, a must to see.
-
2002-02-26historical 130-char remark
Show marketing remark (130 chars)
Totally updated, freshly painted outside, absoulte mint condition, mature trees, & landscaping, new guttering, a must to see.
-
2002-01-25$109,900 130-char remark
Show marketing remark (130 chars)
Totally updated, freshly painted outside, absoulte mint condition, mature trees, & landscaping, new guttering, a must to see.
-
2002-01-02historical
-
2001-11-16$113,500
-
1999-11-17soldstatus $91,000
-
1999-11-15soldstatus $91,000
-
1999-11-09historical
-
1999-06-02$97,500
-
1998-04-01soldstatus $93,000
-
1998-03-29soldstatus $93,000
-
1998-02-14historical
-
1998-02-05$94,500
-
1996-08-01historical
-
1996-07-09soldstatus $85,000
-
1996-05-01$87,900
-
1996-04-28historical
-
1995-12-08historical
-
1995-11-28$87,900
-
1995-06-08$77,500
ⓘ Source: listings_history table (triggers on properties + properties_extension) + one-shot
backfill from property_details.listing_events for pre-trigger history.
Tax reassessment forecast OK · Resets to sale price
- Current annual tax
- $1,757 · $146/mo
- Projected year-2 tax
- $1,844 · $154/mo
- Expected delta
- +$87/yr (+$7/mo · 5.0%)
ⓘ Screening estimate from a state-policy table — verify with the county assessor before closing.
Climate risk First Street
- Flood 1/10 Low FEMA zone X (unshaded) · 0% chance over 30 yrs
- Wildfire 6/10 Major
- Heat 6/10 Major 7 d/yr ≥111°F today · 18 d/yr by 30 yrs out
- Wind 3/10 Moderate 4% chance of damaging wind over 30 yrs
- Air quality 2/10 Low 1 unhealthy d/yr today · 1 by 30 yrs out
Nearby sold comps map
Loading sold comps map…
Walkable amenities ~0.75 mi
Loading nearby amenities…
Taxation est. · year 1
- Rental income
- $25,946
- − Mortgage interest
- −$11,478
- − Property taxes
- −$1,757
- − Insurance
- −$1,024
- − Repairs & maintenance
- −$2,076
- − Management
- −$2,076
- − Depreciation
- −$5,961
- Taxable income
- $1,575
- Est. tax owed @ 24.0%
- −$378
- After-tax cash flow
- $4,444/yr
For passive investors: Depreciation is non-cash, so a rental often shows a tax loss while cash-flowing — sheltering income. Rental losses are passive: they offset passive income freely, and up to $25,000/yr can offset ordinary (W-2) income if you actively participate and your MAGI is under $100k (phasing out to $0 by $150k); unused losses carry forward. On sale, claimed depreciation is recaptured at up to 25%, and gains may owe capital-gains tax (a 1031 exchange can defer both). Figures are a year-1 estimate at your 24.0% rate — not tax advice; consult a CPA.
Schools (NCES district)
- District
- Jenks
- NCES district ID
- 4015720
- Math proficiency
- 34% ▼ -9.00%
- Reading proficiency
- 35% ▼ -8.00%
- Median HH income
- $66,291
- Composite
- 31.5/100
- National rank
- #5973
- State rank
- #27 of 270 in OK
Livability — Jenks
- Score
- 71/100
- State rank
- #33
- US rank
- #7270
Category grades
Schools grade is shown separately in the Schools card above.
Census & demographics
- Census place
- Jenks, OK
- County
- Tulsa County · 640,811 people
- City population
- 24,547
- Metro
- Tulsa, OK
- Population (ZIP)
- 24,547
- Household income
- $103,942
- Rent vs Own
- Severe rent burden
- 233.0
Population outlook (Tulsa County) Hauer SSP2
- Today (2025)
- 723,846 people
- By 2030
- 766,033 · +5.8%
- By 2040
- 851,386 · +17.6%
- By 2050
- 938,389 · +29.6%
- By 2075
- 1,166,011 · +61.1%
- By 2100
- 1,350,277 · +86.5%
Race, ethnicity, and origin ACS 2023
- Neighborhood character
- Diverse neighborhood (Simpson 0.58)
- Race & ethnicity
- White 64% Two or more races 14% Asian 11% Hispanic / Latino 8% Native American 6% Black 3%
- Hispanic origin (detail)
- Mexican 4% Puerto Rican 2%
- Common ancestry
- Slovak 3% Italian 3% Lithuanian 2%
- Foreign-born
- 10% · Philippines, Canada, China
- Languages at home
- 86% English-only · Other Asian/Pacific 6% Spanish 4% Russian/Polish/Slavic 1%
Political lean MEDSL · Tulsa
- 2024 margin
- R (+15.2) · D 41.3% · R 56.5% · Other 2.2%
- 2008→2024 swing
- +9.2pp toward D · 2008: -24.5pp · 2024: -15.2pp
- All cycles
- 2024: R+15.2 2020: R+15.6 2016: R+22.9 2012: R+27.4 2008: R+24.5
Not yet ingested
- Civics
- —
Market trends
- HPI YoY
- ▼ -62.99%
- Current HPI
- 207.6174
- Rent YoY
- ▲ 3.20%
- Metro
- Tulsa, OK
- State GDP YoY
- ▲ 1.55%
- F500 in state
- 6
Industry mix (Fortune 500 HQ in OK)
| Industry | F500 HQs | Revenue |
|---|---|---|
| Energy | 3 | $48B |
|
||
Price history
+183.7% since first listed22 events — show timeline
- 2026-05-18 Listed $219,900 MLS Technology, Inc.
- 2002-05-06 Sold (Public Records) $110,000 Public Records
- 2002-05-03 Sold (MLS) $109,900 MLS Technology, Inc.
- 2002-02-26 Listing Removed — MLS Technology, Inc.
- 2002-01-25 Listed $109,900 MLS Technology, Inc.
- 2002-01-02 Listing Removed — MLS Technology, Inc.
- 2001-11-16 Listed $113,500 MLS Technology, Inc.
- 1999-11-17 Sold (Public Records) $91,000 Public Records
- 1999-11-15 Sold (MLS) $91,000 MLS Technology, Inc.
- 1999-11-09 Listing Removed — MLS Technology, Inc.
- 1999-06-02 Listed $97,500 MLS Technology, Inc.
- 1998-04-01 Sold (Public Records) $93,000 Public Records
- 1998-03-29 Sold (MLS) $93,000 MLS Technology, Inc.
- 1998-02-14 Listing Removed — MLS Technology, Inc.
- 1998-02-05 Listed $94,500 MLS Technology, Inc.
- 1996-08-01 Listing Removed — MLS Technology, Inc.
- 1996-07-09 Sold (Public Records) $85,000 Public Records
- 1996-05-01 Listed $87,900 MLS Technology, Inc.
- 1996-04-28 Listing Removed — MLS Technology, Inc.
- 1995-12-08 Listing Removed — MLS Technology, Inc.
- 1995-11-28 Listed $87,900 MLS Technology, Inc.
- 1995-06-08 Listed $77,500 MLS Technology, Inc.
Property tax history
+2.3%/yrLatest (2025): $1,757 · +4.1% YoY. Source: county tax records.
Cash-flow waterfall
monthlySold comps — $/sqft
last 12 mo · ≤1 miLoading sold comps…