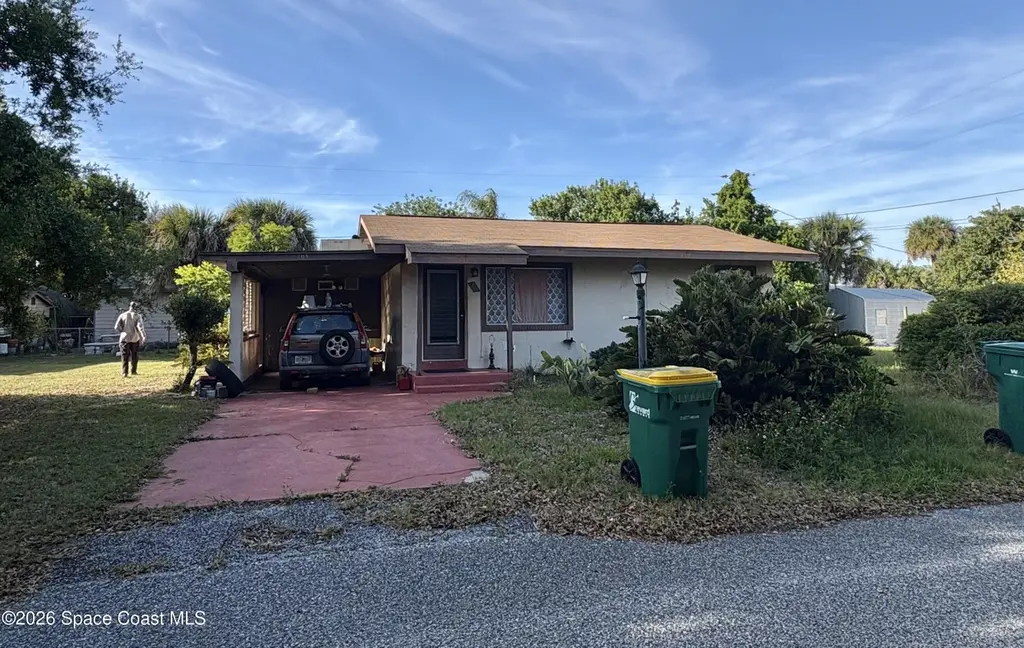
305 Live Oak Ln · Melbourne, FL
Flood risk 1/10 · Minimal
- FEMA flood zone
- X (unshaded)
- Chance of flooding over 30 yrs
- 0.0%
- Est. flood insurance / yr
- $507 – $1,088
Fire risk 1/10 · Minimal
- Est. fire insurance / yr
- $947 – $1,759
Heat risk 10/10 · Severe
- Hot days now (above 105°F)
- 7 days/yr
- Hot days in 30 yrs
- 24 days/yr
Wind risk 10/10 · Severe
- Chance of severe wind over 30 yrs
- 99.0%
Air-quality risk 1/10 · Minimal
- Unhealthy air days now
- 0 days/yr
- Unhealthy air days in 30 yrs
- 0 days/yr
Risk factors via First Street. Map © Google.
Why this score? — see what drove the D grade
The composite is a weighted blend of 9 inputs, each scored 0–100. Each bar is that input's sub-score; the figure is the points it added to the 100-point composite (weight × sub-score).
- Cash flow +14.8/30.0
- ARV discount +7.5/15.0
- Schools +4.7/10.0
- DSCR +4.5/10.0
- 1% rule +3.6/10.0
- Rent growth +2.6/5.0
- Livability +2.5/5.0
- Condition / age +2.5/5.0
- Appreciation +0.0/10.0
$185,000
🖨 Deal sheet (PDF) 📄 Offer letter ✓ Due diligence
Listing remarks
Bring your imagination and inner designer skills to this home, it is waiting for your TLC. Come see how you can breathe new life into this 2/1 home. City/Septic, roof is 10 years old.
Key facts
- 8,712 sq ft lot
- Parking
- Built 1954
Property features AI
Exterior
- Parking: Carport (1 space)
- Utilities: Septic tank; Electricity connected; Water available and connected; Cable available
- Home design: Single-family residence; One story; Faces south
- Construction: Block construction; Shingle roof; Built on foundation (standard)
- Exterior features: Shed(s); City street frontage; Paved road access; Lot features: Other
Interior
- Kitchen: Electric range; Refrigerator
- Bedrooms: 2 bedrooms
- Flooring: Wood flooring
- Bathrooms: 1 full bathroom
- Heating & cooling: No heating; No cooling
- Interior features: Unfurnished; Rear porch
Neighborhood map
What this means for you Summary
Snapshot
- This is a 2-bed/1.0-bath single-family listed at $185k.
Deal economics
- At list price, monthly cash flow is $50 ($606/yr) — positive.
- The deal already cash-flows at list — no discount required.
- To meet the 1% rule (rent ≥ 1% of price), the offer needs to be $158k (14.5% below list).
- Recommended offer: $158k (14.5% below list) — sets the bar for 1% rule.
Location & tenants
- Location reads: area grade D — affects rentability + tenant quality, not the cash-flow math above.
- Brevard (suburban): math 53% / reading 57% proficiency, ranked #19 of 73 in FL (top 26%) — acceptable for families but not a draw, mixed tenant base, ~2y average lease.
- Zoned schools: Dr. W.J. Creel Elementary School (math 38% / reading 42%, grade F, #1,491 of 2,144 statewide, top 70%, 626 students, 72% FRL); Lyndon B. Johnson Middle School (math 40% / reading 42%, grade F, #353 of 571 statewide, top 63%, 610 students, 61% FRL); Eau Gallie High School (math 20% / reading 49%, grade F, #386 of 667 statewide, top 59%, 1,586 students, 55% FRL) — zoned schools average 63% FRL vs 43% district-wide (20 pts higher); higher-poverty schools than district average — tighter screening recommended.
- Zoned-school proficiency averages 38% at this address vs 55% district-wide (-16 pts) — the specific schools serving this property underperform the Brevard average; the district grade overstates school quality for this exact location.
- Market conditions: Rents flat; 335 active listings in the ZIP; 2 comparable units currently listed for rent nearby; 4,602 units permitted in Brevard County in 2024 (702 in 5+ unit buildings).
Forward outlook
- Local home prices are declining (-3.0%/yr); year-one equity from $1k of loan paydown is wiped out by about $6k of value loss. Plan a longer hold.
- Brevard County population projected at +15% by 2050 — modest demand growth; plan on rents tracking national, not racing it.
Negotiation context
- It's been on market 24 days — a 2% lower offer ($182k) is reasonable based on typical stale-listing flexibility.
- Current owner paid $42k; list at $185k implies a 346% gain — meaningful room to come down on a strong offer.
Risks & watch-outs
- Watch-outs: built in 1954 — expect roof / HVAC / electrical / plumbing capex.
- Climate carrying-cost: severe wind risk, 99% chance of damaging wind over 30y; extreme-heat days projected 7→24/yr by 2055 (HVAC capex compounding) — expect insurance premiums to compound above CPI over the hold.
Questions for the listing agent
- Built in 1954 — when were the roof, HVAC, electrical panel, plumbing, and water heater last replaced?
- Is there a deadline driving the sale (1031 exchange, divorce, estate, relocation)? That informs how much negotiation room exists.
- The area grade is low — what's the realistic commute time and amenity access for the typical tenant pool here? Any planned neighborhood developments (good or bad) we should know about?
- What's the average days-on-market for RENTAL listings here right now (not sales)? A rising rental-DOM trend means longer vacancies and softer asking-rent achievability than the comps imply.
- What's the recent tenant-quality profile in this submarket — average credit score on applications, eviction rate, late-payment / NSF rate, and stable-employment percentage? A property-management company in the area should have these aggregated.
- How much new for-sale + rental construction is in the pipeline within 1–3 miles? Heavy new supply typically softens prices + rents 12–24 months out; constrained supply supports both.
Investment metrics
- 1% rule
- 0.86% ✗
- Cap rate
- 6.62%
- Cash-on-cash
- 1.17%
- DSCR
- 1.05
- GRM
- 9.7
CMA / ARV
No comps found within radius.
Projected returns pro-forma
-3.0% appreciation · 0.53% rent growth · sell at horizon
- IRR
- -17.1%
- Equity multiple
- 0.41×
- Total profit
- $-30,625
- Equity at exit
- $27,584
- IRR
- -14.1%
- Equity multiple
- 0.27×
- Total profit
- $-37,613
- Equity at exit
- $15,995
Cash invested: $51,800 (down + closing). Projections, not guarantees.
Landlord ↔ Tenant lean methodology
- Overall (STATE)
- 87 Strongly Landlord-Friendly
- State Florida
- 87 Strongly Landlord-Friendly · R+3
- County
- — inherits STATE
- City
- — inherits STATE
ZIP-level market 32935
- Rents YoY
- 0.5%
- Active inventory
- 335
- Price-to-rent
- 9.7×
Monthly cashflow live
- Estimated rent
- $1,582 medium interval (Pro) →
- Mortgage (P&I)
- −$970
- Tax from tax record
- −$152 /mo · $1,824/yr
- Insurance
- −$77
- HOA
- −$0
- Vacancy / Maint / Mgmt
- −$332
- Net cashflow
- $50
Break-even live
Sensitivity live
| Price | -10% $155 | -5% $103 | +0% $50 | +5% $-2 | +10% $-54 |
|---|---|---|---|---|---|
| Rent | -10% $-74 | -5% $-12 | +0% $50 | +5% $113 | +10% $175 |
| Rate | -1.0pp $144 | -0.5pp $98 | base $50 | +0.5pp $3 | +1.0pp $-46 |
UW: 25.0% down · 7.5% · 30yr · 1.5% tax · 5.0% vac · 8.0% maint · 8.0% mgmt
Financing live
Cash to close
- Down payment
- $46,250
- Closing costs
- $5,550
- Reserves months
- —
- Total cash needed
- —
Loan-product check · same deal, 3 products live
Conventional
25% down · 7.5% · 30yr
- Down + closing
- —
- Monthly P&I
- —
- Monthly cashflow
- —
- DSCR
- —
- Eligible?
- —
Personal DTI + credit; lowest rate.
DSCR
20% down · 8.5% · 30yr
- Down + closing
- —
- Monthly P&I
- —
- Monthly cashflow
- —
- DSCR
- —
- Eligible?
- —
No personal income docs; deal must DSCR.
Hard money
10% down · 12.0% · 12mo
- Down + closing
- —
- Monthly P&I
- —
- Monthly cashflow
- —
- DSCR
- —
- Eligible?
- —
Short-term bridge; refi at stabilization.
Rent comps 2 comps
| Address | Beds | Baths | Sqft | Rent | $/sqft | DOM | Units | Dist |
|---|---|---|---|---|---|---|---|---|
| 1900 Post Rd Melbourne, FL | 1.0–3.0 | 1.0–2.0 | 840 | $1,626 | $1.94 | 16d | 10 | 0.26mi |
| 1440 Parkway Dr Unit 11a Melbourne, FL | 1.0 | 1.0 | 700 | $1,300 | $1.86 | 25d | 1 | 1.09mi |
Listing history 11 events
-
2026-06-10statusdays on market $185,000 Pending 24 DOM
-
2026-06-08days on market $185,000 Active 23 DOM
-
2026-06-07days on market $185,000 Active 22 DOM
-
2026-06-05days on market $185,000 Active 19 DOM
-
2026-06-03days on market $185,000 Active 18 DOM
-
2026-06-02days on market $185,000 Active 17 DOM
-
2026-06-01days on market $185,000 Active 16 DOM
-
2026-05-31days on market $185,000 Active 15 DOM
-
2026-05-31days on market $185,000 Active 14 DOM
-
2026-05-16$185,000 Active
-
1984-11-01soldstatus $41,500
ⓘ Source: listings_history table (triggers on properties + properties_extension) + one-shot
backfill from property_details.listing_events for pre-trigger history.
Tax reassessment forecast FL · Resets to sale price
- Current annual tax
- $1,824 · $152/mo
- Projected year-2 tax
- $1,824 · $152/mo
- Expected delta
- $0/yr ($0/mo · 0.0%)
ⓘ Screening estimate from a state-policy table — verify with the county assessor before closing.
Climate risk First Street
- Flood 1/10 Low FEMA zone X (unshaded) · 0% chance over 30 yrs
- Wildfire 1/10 Low
- Heat 10/10 Extreme 7 d/yr ≥105°F today · 24 d/yr by 30 yrs out
- Wind 10/10 Extreme 99% chance of damaging wind over 30 yrs
- Air quality 1/10 Low 0 unhealthy d/yr today · 0 by 30 yrs out
Nearby sold comps map
Loading sold comps map…
Walkable amenities ~0.75 mi
Loading nearby amenities…
Taxation est. · year 1
- Rental income
- $18,983
- − Mortgage interest
- −$10,363
- − Property taxes
- −$1,824
- − Insurance
- −$925
- − Repairs & maintenance
- −$1,519
- − Management
- −$1,519
- − Depreciation
- −$5,382
- Taxable loss
- −$2,548
- Est. tax savings @ 24.0%
- +$611
- After-tax cash flow
- $1,217/yr
For passive investors: Depreciation is non-cash, so a rental often shows a tax loss while cash-flowing — sheltering income. Rental losses are passive: they offset passive income freely, and up to $25,000/yr can offset ordinary (W-2) income if you actively participate and your MAGI is under $100k (phasing out to $0 by $150k); unused losses carry forward. On sale, claimed depreciation is recaptured at up to 25%, and gains may owe capital-gains tax (a 1031 exchange can defer both). Figures are a year-1 estimate at your 24.0% rate — not tax advice; consult a CPA.
Schools (NCES district)
- District
- Brevard
- NCES district ID
- 1200150
- Math proficiency
- 53% ▼ -9.00%
- Reading proficiency
- 57% ▼ -4.00%
- Median HH income
- $49,426
- Composite
- 46.86/100
- National rank
- #2370
- State rank
- #19 of 73 in FL
Livability — Melbourne
No livability data for this city. (Only ~50 U.S. cities are tracked.)
Census & demographics
- Census place
- Melbourne, FL
- County
- Brevard County · 602,871 people
- City population
- 178,420
- Metro
- Palm Bay-Melbourne-Titusville, FL
- Population (ZIP)
- 41,965
- Household income
- $64,588
- Rent vs Own
- Severe rent burden
- 1747.0
Population outlook (Brevard County) Hauer SSP2
- Today (2025)
- 623,254 people
- By 2030
- 648,420 · +4.0%
- By 2040
- 690,009 · +10.7%
- By 2050
- 715,669 · +14.8%
- By 2075
- 775,744 · +24.5%
- By 2100
- 776,687 · +24.6%
Race, ethnicity, and origin ACS 2023
- Neighborhood character
- Predominantly White (74%)
- Race & ethnicity
- White 74% Hispanic / Latino 13% Two or more races 9% Black 5% Asian 2%
- Hispanic origin (detail)
- Mexican 3% Puerto Rican 5%
- Common ancestry
- Slovak 2% Romanian 2% Lithuanian 2%
- Foreign-born
- 9% · Canada, Vietnam, Jamaica
- Languages at home
- 88% English-only · Spanish 8% Other Indo-European 1% Tagalog/Filipino 1%
Political lean MEDSL · Brevard
- 2024 margin
- Strong R (+20.8) · D 39.1% · R 59.9% · Other 1.0%
- 2008→2024 swing
- -10.4pp toward R · 2008: -10.4pp · 2024: -20.8pp
- All cycles
- 2024: R+20.8 2020: R+16.4 2016: R+19.8 2012: R+12.7 2008: R+10.4
Not yet ingested
- Civics
- —
Market trends
- HPI YoY
- ▼ -185.48%
- Current HPI
- 308.7443
- Rent YoY
- ▲ 0.53%
- Metro
- Palm Bay-Melbourne-Titusville, FL
- State GDP YoY
- ▲ 3.28%
- F500 in state
- 36
Industry mix (Fortune 500 HQ in FL)
| Industry | F500 HQs | Revenue |
|---|---|---|
| Industrial Technology | 2 | $29B |
|
||
| Insurance | 2 | $17B |
|
||
| Retail | 1 | $60B |
|
||
| Technology Distribution | 1 | $58B |
|
||
| Homebuilding | 1 | $35B |
|
||
| Technology Manufacturing | 1 | $35B |
|
||
Price history
+345.8% since first listed2 events — show timeline
- 2026-05-16 Listed $185,000 SCMLS
- 1984-11-01 Sold (Public Records) $41,500 Public Records
Property tax history
+20.6%/yrLatest (2025): $1,824 · +7.3% YoY. Source: county tax records.
Cash-flow waterfall
monthlySold comps — $/sqft
last 12 mo · ≤1 miLoading sold comps…