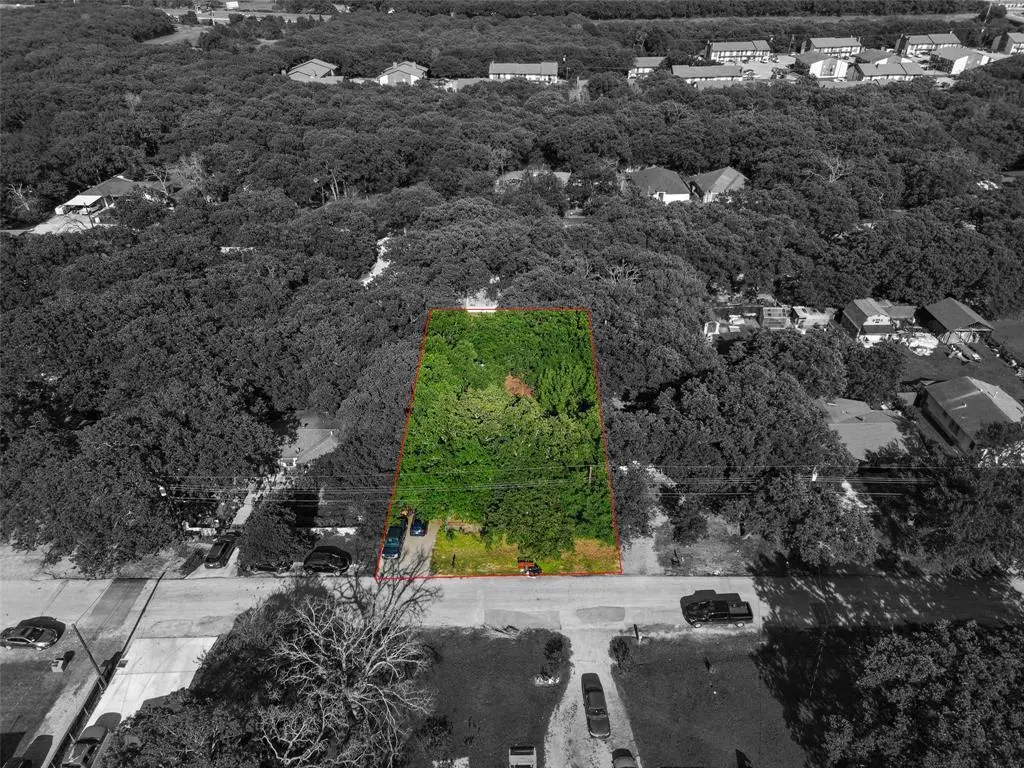
3016 Deep Well Rd · Balch Springs, TX
Flood risk 1/10 · Minimal
- FEMA flood zone
- X (unshaded)
- Chance of flooding over 30 yrs
- 0.0%
- Est. flood insurance / yr
- $507 – $1,088
Fire risk 1/10 · Minimal
- Est. fire insurance / yr
- $1,222 – $2,270
Heat risk 7/10 · Major
- Hot days now (above 110°F)
- 7 days/yr
- Hot days in 30 yrs
- 22 days/yr
Wind risk 6/10 · Moderate
- Chance of severe wind over 30 yrs
- 27.0%
Air-quality risk 2/10 · Minimal
- Unhealthy air days now
- 1 days/yr
- Unhealthy air days in 30 yrs
- 1 days/yr
Risk factors via First Street. Map © Google.
Why this score? — see what drove the C grade
The composite is a weighted blend of 9 inputs, each scored 0–100. Each bar is that input's sub-score; the figure is the points it added to the 100-point composite (weight × sub-score).
- Cash flow +20.0/30.0
- ARV discount +15.0/15.0
- 1% rule +7.0/10.0
- DSCR +6.3/10.0
- Livability +3.4/5.0
- Schools +2.9/10.0
- Rent growth +2.5/5.0
- Condition / age +2.5/5.0
- Appreciation +0.0/10.0
$195,000
🖨 Deal sheet 📄 Offer letter ✓ Due diligence
Listing remarks
Rare opportunity to own a heavily wooded retreat in the heart of the city! Nestled beneath a canopy of mature oak trees, this unique property offers privacy, shade, and a natural setting that feels worlds away from the hustle and bustle, yet remains conveniently located near shopping, dining, schools, and major commuter routes. The existing home offers spacious living areas, oversized rooms, and a functional layout ready for your personal vision. The large kitchen provides abundant cabinet and counter space, while the expansive living area offers plenty of room for gathering with family and friends. Original wood flooring throughout much of the home adds warmth and character. Outside, the t
Key facts
- Covered deck
- Private pool
- Heavily treed lot
Tags
Property features AI
Finance
- Other: Property listed for sale; listing terms include Cash and Conventional; Possession at closing/funding
- HOA & community: No homeowners association
Exterior
- Parking: Driveway parking
- Utilities: City water; City sewer; All-weather road access
- Home design: Single family residence; Residential property; One story
- Construction: Composition roof; Pillar/post/pier foundation; Built in 1950
- Exterior features: Covered patio/porch; Deck; Front porch; Above-ground outdoor pool; Utilities easement
Interior
- Kitchen: Dishwasher; Electric oven
- Bedrooms: 3 bedrooms (primary bedroom on level 1 with walk-in closet)
- Bathrooms: 3 bathrooms total (2 full, 1 half)
- Heating & cooling: Central heating (electric); Central air conditioning; Ceiling fan(s)
- Interior features: Eat-in kitchen; Kitchen island; High-speed internet available; One living area; One dining area; 5 total rooms; One-level layout
Neighborhood map
What this means for you Summary
Snapshot
- This is a 3-bed/2.5-bath single-family listed at $195k.
Deal economics
- At list price, monthly cash flow is $239 ($3k/yr) — positive.
- The deal already cash-flows at list — no discount required.
- Meets the 1% rule at list price ($2k rent vs $195k).
- Recommended offer: $189k (3.0% below list) — sets the bar for market timing.
- Cap rate 7.8% vs local median 4.7% in Balch Springs — top-decile yield for the area; either an underpriced asset or a hidden risk that comps aren't pricing in. Stress-test before assuming the spread holds.
Location & tenants
- Location reads 68/100 on livability (#487 in TX) — a middle-class / working-renter tenant base. Strengths: cost of living A+, housing A+, health & safety B+; Watch: employment D, schools F, crime F.
- Mesquite ISD (suburban): math 35% / reading 32% proficiency, ranked #536 of 826 in TX (top 65%) — families likely to look elsewhere, expect single-tenant / working-renter base with shorter leases; 63% free/reduced lunch — lower-income household profile, screen leases tightly.
- Market conditions: 85 active listings in the ZIP; 13 comparable units currently listed for rent nearby; rentals at typical pace (median 22d on market — plan ~3-4 weeks tenant-placement turnaround); 12,577 units permitted in Dallas County in 2024 (6,829 in 5+ unit buildings).
- This rent runs 42% of the median local income ($67k/yr) — at the standard rent-burdened threshold; future hikes will face affordability resistance.
Forward outlook
- Local home prices are declining (-3.0%/yr); year-one equity from $1k of loan paydown is wiped out by about $6k of value loss. Plan a longer hold.
- Dallas County population projected at +35% by 2050 — long-run rental-demand tailwind backs the buy-and-hold thesis.
Negotiation context
- It's been on market 43 days — a 3% lower offer ($189k) is reasonable based on typical stale-listing flexibility.
- 3 sale attempts since 19y ago; this cycle's ask has dropped $30k (13%) from the opening price — seller is motivated, your offer sets the floor, not the list.
Risks & watch-outs
- Watch-outs: property tax is 3.1% of price; built in 1950 — expect roof / HVAC / electrical / plumbing capex.
- Climate carrying-cost: major wind risk, 27% chance of damaging wind over 30y; extreme-heat days projected 7→22/yr by 2055 (HVAC capex compounding) — expect insurance premiums to compound above CPI over the hold.
Questions for the listing agent
- It's been on market 43 days. Have you received any prior offers? Is the seller open to a 3% concession, seller financing, or rate buy-down credit?
- Built in 1950 — when were the roof, HVAC, electrical panel, plumbing, and water heater last replaced?
- Property tax is high relative to price — has the assessment been appealed recently, and will the sale trigger a re-assessment?
- Is there a deadline driving the sale (1031 exchange, divorce, estate, relocation)? That informs how much negotiation room exists.
- Schools are F-rated, which usually means shorter tenancies and higher turnover. Who's the typical renter profile here, and what's been the actual vacancy rate?
- Crime grade is F in this area — have there been break-ins, vandalism, or insurance claims at this property in the last 3 years? What carrier currently insures it and at what premium?
- What's the average days-on-market for RENTAL listings here right now (not sales)? A rising rental-DOM trend means longer vacancies and softer asking-rent achievability than the comps imply.
- What's the recent tenant-quality profile in this submarket — average credit score on applications, eviction rate, late-payment / NSF rate, and stable-employment percentage? A property-management company in the area should have these aggregated.
- How much new for-sale + rental construction is in the pipeline within 1–3 miles? Heavy new supply typically softens prices + rents 12–24 months out; constrained supply supports both.
Investment metrics
- 1% rule
- 1.20% ✓
- Cap rate
- 7.76%
- Cash-on-cash
- 5.25%
- DSCR
- 1.23
- GRM
- 6.9
CMA / ARV
- ARV (median comp)
- $280,397
- List price
- $195,000
- Delta
- -30.46%
- Verdict
- UNDERPRICED
- Comps
- 20 within 1.0 mi
Show comp detail 1 sale within ~0.75 mi
| Address | Dist | Beds/Ba | Sqft | Sold | Price | $/sf | Match |
|---|---|---|---|---|---|---|---|
| 12415 Natalie Dr | 0.73mi | 3/2.5 | 2,312 (+0%) | 16mo | $286,000 | $124 | 52 |
Match score weights: distance 35% · size 25% · config 20% · recency 20%. Top-matched comps best support the ARV.
Projected returns pro-forma
-3.0% appreciation · 3.0% rent growth · sell at horizon
- IRR
- -8.0%
- Equity multiple
- 0.70×
- Total profit
- $-16,194
- Equity at exit
- $29,075
- IRR
- 1.6%
- Equity multiple
- 1.12×
- Total profit
- $6,281
- Equity at exit
- $16,860
Cash invested: $54,600 (down + closing). Projections, not guarantees.
Landlord ↔ Tenant lean methodology
- Overall (STATE)
- 87 Strongly Landlord-Friendly
- State Texas
- 87 Strongly Landlord-Friendly · R+5
- County
- — inherits STATE
- City
- — inherits STATE
ZIP-level market 75180
- Home prices YoY
- -8.0%
- Active inventory
- 85
- Price-to-rent
- 6.9×
Monthly cashflow live
- Estimated rent
- $2,342 high interval (Pro) →
- Mortgage (P&I)
- −$1,023
- Tax from tax record
- −$507 /mo · $6,089/yr
- Insurance
- −$81
- HOA
- −$0
- Vacancy / Maint / Mgmt
- −$492
- Net cashflow
- $239
Break-even live
UW: 25.0% down · 7.5% · 30yr · 1.5% tax · 5.0% vac · 8.0% maint · 8.0% mgmt
Financing live
Cash to close
- Down payment
- $48,750
- Closing costs
- $5,850
- Reserves months
- —
- Total cash needed
- —
Loan-product check · same deal, 3 products live
Conventional
25% down · 7.5% · 30yr
- Down + closing
- —
- Monthly P&I
- —
- Monthly cashflow
- —
- DSCR
- —
- Eligible?
- —
Personal DTI + credit; lowest rate.
DSCR
20% down · 8.5% · 30yr
- Down + closing
- —
- Monthly P&I
- —
- Monthly cashflow
- —
- DSCR
- —
- Eligible?
- —
No personal income docs; deal must DSCR.
Hard money
10% down · 12.0% · 12mo
- Down + closing
- —
- Monthly P&I
- —
- Monthly cashflow
- —
- DSCR
- —
- Eligible?
- —
Short-term bridge; refi at stabilization.
Rent comps 13 comps
| Address | Beds | Baths | Sqft | Rent | $/sqft | DOM | Units | Dist |
|---|---|---|---|---|---|---|---|---|
| 3521 Vicki Ln Balch Springs, TX | 4.0 | 2.0 | 1639 | $1,999 | $1.22 | 44d | 1 | 0.56mi |
| 3505 Vicki Ln Balch Springs, TX | 4.0 | 2.5 | 2399 | $2,435 | $1.02 | 44d | 1 | 0.70mi |
| 11815 Sunrise Dr Balch Springs, TX | 3.0 | 2.0 | 1719 | $1,895 | $1.10 | 5d | 1 | 0.76mi |
| 3808 Kenzie Ct Balch Springs, TX | 3.0 | 2.0 | 1690 | $2,085 | $1.23 | 2d | 1 | 0.86mi |
| 3916 Shepherd Ln Balch Springs, TX | 3.0 | 2.0 | 2120 | $2,400 | $1.13 | 44d | 1 | 0.88mi |
| 12129 Spring Branch Dr Balch Springs, TX | 3.0 | 2.5 | 1650 | $1,925 | $1.17 | 5d | 1 | 1.03mi |
| 2636 Cumberland Trl Balch Springs, TX | 3.0 | 2.0 | 2059 | $2,900 | $1.41 | 13d | 1 | 1.10mi |
| 1022 Cheyenne Rd Dallas, TX | 3.0 | 2.0 | 1850 | $2,500 | $1.35 | 24d | 1 | 1.16mi |
| 12719 Bluffview Dr Balch Springs, TX | 3.0 | 2.5 | 1788 | $2,300 | $1.29 | 44d | 1 | 1.29mi |
| 2008 Valley Falls Ave Mesquite, TX | 3.0 | 2.0 | 1674 | $2,350 | $1.40 | 2d | 1 | 1.31mi |
| 2800 Crockett Pl Mesquite, TX | 3.0 | 2.0 | 1660 | $1,895 | $1.14 | 22d | 1 | 1.35mi |
| 2801 Sonora Ln Mesquite, TX | 4.0 | 2.0 | 1938 | $2,245 | $1.16 | 24d | 1 | 1.39mi |
| 2113 Spring Mills Rd Mesquite, TX | 4.0 | 3.0 | 1643 | $3,500 | $2.13 | 8d | 1 | 1.44mi |
Listing history 23 events
-
2026-06-16days on market $195,000 Active 43 DOM
-
2026-06-15days on market $195,000 Active 42 DOM
-
2026-06-13days on market $195,000 Active 40 DOM
-
2026-06-13days on market $195,000 Active 39 DOM
-
2026-06-10price $195,000 Active 36 DOM
-
2026-06-09days on market $199,000 Active 36 DOM
-
2026-06-08days on market $199,000 Active 35 DOM
-
2026-06-07days on market $199,000 Active 34 DOM
-
2026-06-04days on market $199,000 Active 31 DOM
-
2026-06-03days on market $199,000 Active 30 DOM
-
2026-06-02remarks 699-char remark
-
2026-06-02pricedays on market $199,000 Active 29 DOM
-
2026-06-01days on market $210,000 Active 28 DOM
-
2026-05-31days on market $210,000 Active 27 DOM
-
2026-05-11price $215,000 290-char remark
-
2026-05-04$225,000 Active 290-char remark
-
2021-08-06historical
-
2021-06-22$239,000 Active
-
2007-03-02soldstatus
-
2007-02-13historical
-
2007-01-13$81,000
-
2004-10-07soldstatus
-
2004-10-07soldstatus
ⓘ Source: listings_history table (triggers on properties + properties_extension) + one-shot
backfill from property_details.listing_events for pre-trigger history.
Tax reassessment forecast TX · Resets to sale price
- Current annual tax
- $6,089 · $507/mo
- Projected year-2 tax
- $6,089 · $507/mo
- Expected delta
- $0/yr ($0/mo · 0.0%)
ⓘ Screening estimate from a state-policy table — verify with the county assessor before closing.
Climate risk First Street
- Flood 1/10 Low FEMA zone X (unshaded) · 0% chance over 30 yrs
- Wildfire 1/10 Low
- Heat 7/10 Severe 7 d/yr ≥110°F today · 22 d/yr by 30 yrs out
- Wind 6/10 Major 27% chance of damaging wind over 30 yrs
- Air quality 2/10 Low 1 unhealthy d/yr today · 1 by 30 yrs out
Nearby sold comps map
Loading sold comps map…
Walkable amenities ~0.75 mi
Loading nearby amenities…
Taxation est. · year 1
- Rental income
- $28,102
- − Mortgage interest
- −$10,923
- − Property taxes
- −$6,089
- − Insurance
- −$975
- − Repairs & maintenance
- −$2,248
- − Management
- −$2,248
- − Depreciation
- −$5,673
- Taxable loss
- −$54
- Est. tax savings @ 24.0%
- +$13
- After-tax cash flow
- $2,878/yr
For passive investors: Depreciation is non-cash, so a rental often shows a tax loss while cash-flowing — sheltering income. Rental losses are passive: they offset passive income freely, and up to $25,000/yr can offset ordinary (W-2) income if you actively participate and your MAGI is under $100k (phasing out to $0 by $150k); unused losses carry forward. On sale, claimed depreciation is recaptured at up to 25%, and gains may owe capital-gains tax (a 1031 exchange can defer both). Figures are a year-1 estimate at your 24.0% rate — not tax advice; consult a CPA.
Schools (NCES district)
- District
- Mesquite ISD
- NCES district ID
- 4830390
- Math proficiency
- 35% ▼ -11.00%
- Reading proficiency
- 32% ▼ -7.00%
- Median HH income
- $49,372
- Composite
- 29.06/100
- National rank
- #6606
- State rank
- #536 of 826 in TX
Livability — Balch Springs
- Score
- 68/100
- State rank
- #487
- US rank
- #9673
Category grades
Schools grade is shown separately in the Schools card above.
Census & demographics
- Census place
- Balch Springs, TX
- County
- Dallas County · 2,612,404 people
- City population
- 26,455
- Metro
- Dallas-Fort Worth-Arlington, TX
- Population (ZIP)
- 26,455
- Household income
- $67,019
- Rent vs Own
- Severe rent burden
- 660.0
Population outlook (Dallas County) Hauer SSP2
- Today (2025)
- 2,979,839 people
- By 2030
- 3,191,823 · +7.1%
- By 2040
- 3,619,611 · +21.5%
- By 2050
- 4,026,915 · +35.1%
- By 2075
- 4,957,073 · +66.4%
- By 2100
- 5,508,725 · +84.9%
Race, ethnicity, and origin ACS 2023
- Neighborhood character
- Diverse neighborhood (Simpson 0.61)
- Race & ethnicity
- Hispanic / Latino 51% Black 33% Two or more races 24% White 14% Native American 2%
- Hispanic origin (detail)
- Mexican 46%
- Foreign-born
- 23% · Canada
- Languages at home
- 55% English-only · Spanish 44%
Political lean MEDSL · Dallas
- 2024 margin
- Strong D (+22.2) · D 60.2% · R 38.0% · Other 1.8%
- 2008→2024 swing
- +6.9pp toward D · 2008: 15.3pp · 2024: 22.2pp
- All cycles
- 2024: D+22.2 2020: D+31.6 2016: D+26.2 2012: D+15.4 2008: D+15.3
Not yet ingested
- Civics
- —
Market trends
- HPI YoY
- ▼ -31.21%
- Current HPI
- 361.3668
- Rent YoY
- —
- Metro
- Dallas-Fort Worth-Arlington, TX
- State GDP YoY
- ▲ 3.95%
- F500 in state
- 110
Industry mix (Fortune 500 HQ in TX)
| Industry | F500 HQs | Revenue |
|---|---|---|
| Energy | 16 | $1,198B |
|
||
| Technology | 5 | $198B |
|
||
| Engineering / Construction | 4 | $72B |
|
||
| Energy Services | 3 | $60B |
|
||
| Utilities | 3 | $41B |
|
||
| Healthcare | 2 | $330B |
|
||
Price history
+140.7% since first listed13 events — show timeline
- 2026-06-16 Listing Removed — NTREIS
- 2026-06-09 Price Changed $195,000 NTREIS
- 2026-06-02 Price Changed $199,000 NTREIS
- 2026-05-26 Price Changed $210,000 NTREIS
- 2026-05-11 Price Changed $215,000 NTREIS
- 2026-05-04 Listed $225,000 NTREIS
- 2021-08-06 Listing Removed — NTREIS
- 2021-06-22 Listed $239,000 NTREIS
- 2007-03-02 Sold (Public Records) — Public Records
- 2007-02-13 Listing Removed — NTREIS
- 2007-01-13 Listed $81,000 NTREIS
- 2004-10-07 Sold (Public Records) — Public Records
- 2004-10-07 Sold (Public Records) — Public Records
Property tax history
+6.1%/yrLatest (2025): $6,089 · -17.3% YoY. Source: county tax records.
Cash-flow waterfall
monthlySold comps — $/sqft
last 12 mo · ≤1 miLoading sold comps…