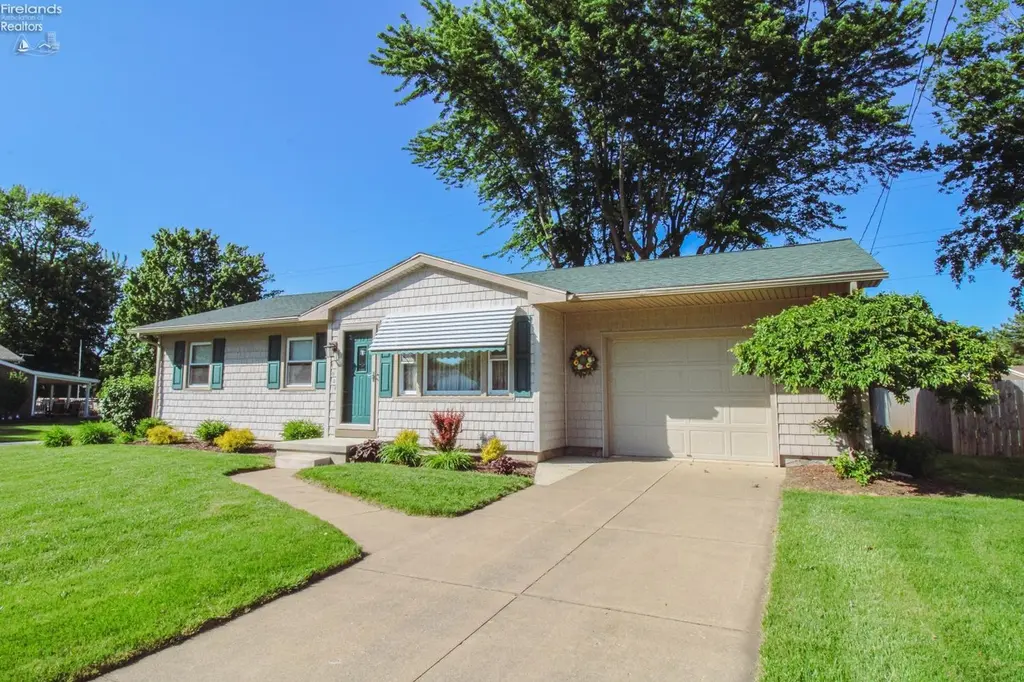
4004 Donair Dr · Sandusky, OH
Flood risk 1/10 · Minimal
- FEMA flood zone
- X (unshaded)
- Chance of flooding over 30 yrs
- 0.0%
- Est. flood insurance / yr
- $473 – $860
Fire risk 1/10 · Minimal
- Est. fire insurance / yr
- $713 – $1,323
Heat risk 3/10 · Minor
- Hot days now (above 95°F)
- 7 days/yr
- Hot days in 30 yrs
- 16 days/yr
Wind risk 2/10 · Minimal
- Chance of severe wind over 30 yrs
- —
Air-quality risk 2/10 · Minimal
- Unhealthy air days now
- 1 days/yr
- Unhealthy air days in 30 yrs
- 2 days/yr
Risk factors via First Street. Map © Google.
Why this score? — see what drove the D grade
The composite is a weighted blend of 9 inputs, each scored 0–100. Each bar is that input's sub-score; the figure is the points it added to the 100-point composite (weight × sub-score).
- Cash flow +13.6/30.0
- ARV discount +7.9/15.0
- Schools +5.0/10.0
- Livability +4.2/5.0
- DSCR +4.1/10.0
- 1% rule +2.9/10.0
- Rent growth +2.5/5.0
- Condition / age +2.5/5.0
- Appreciation +0.0/10.0
$199,000
🖨 Deal sheet (PDF) 📄 Offer letter ✓ Due diligence
Listing remarks
OPEN HOUSE SUNDAY, MAY 31st from Noon-2 PM!!This lovingly maintained, one-owner home is ready for a fresh start with its next lucky family. Move-in ready and impeccably cared for, you can settle in comfortably now and add your own cosmetic updates over time if desired. Major updates include: New roof (2023) New furnace and central A/C (2025) Hot water tank replaced in 2019 Siding approximately 8-10 years oldSituated on over a 1/4 acre lot in desirable Perkins Township, this property offers plenty of outdoor space to enjoy. The basement includes more than 200 square feet of additional area that could easily become a second living room, recreation space, home office, or entertaining area. A n
Key facts
- Hot water tank
- New furnace
- Central a c
Tags
Property features AI
Exterior
- Parking: Attached garage (1 car)
- Utilities: Public water; Public sewer
- Home design: Single-family residence; Residential property; Subdivision: Southgate Acres Subdn
- Construction: Asphalt roof
- Exterior features: Vinyl siding; Shed on the property
Interior
- Kitchen: Cooktop, Oven, Dishwasher, Refrigerator
- Bedrooms: Bedrooms not specified
- Bathrooms: 1 full bathroom
- Heating & cooling: Central air conditioning; Natural gas forced-air heating
- Interior features: Cooktop, Dishwasher, Oven, Refrigerator; Washer and Dryer included; Full basement
- Laundry & utility: Washer and Dryer; Utility connections present
Neighborhood map
What this means for you Summary
Snapshot
- This is a 3-bed/1.0-bath single-family listed at $199k.
Deal economics
- At list price, monthly cash flow is $11 ($132/yr) — positive.
- The deal already cash-flows at list — no discount required.
- To meet the 1% rule (rent ≥ 1% of price), the offer needs to be $157k (20.9% below list).
- Recommended offer: $157k (20.9% below list) — sets the bar for 1% rule.
Location & tenants
- Location reads 83/100 on livability (#63 in OH, #929 nationally) — a professional / high-income tenant draw. Strengths: commute A+, cost of living A+, housing A+; Watch: crime D-, employment F.
- Perkins Local (town): math 55% / reading 61% proficiency, ranked #303 of 656 in OH (top 46%) — acceptable for families but not a draw, mixed tenant base, ~2y average lease.
- Zoned schools: Furry Elementary School (506 students, 26% FRL); Briar Middle School (math 56% / reading 63%, grade B, #271 of 654 statewide, top 43%, 414 students, 34% FRL); Perkins High School (math 42% / reading 67%, grade C-, #303 of 781 statewide, top 42%, 562 students, 30% FRL) — zoned schools at 30% FRL track the district average.
- Market conditions: 212 active listings in the ZIP; 128 units permitted in Erie County in 2024 (5 in 5+ unit buildings).
- This rent runs 30% of the median local income ($62k/yr) — at the standard rent-burdened threshold; future hikes will face affordability resistance.
Forward outlook
- Local home prices are declining (-3.0%/yr); year-one equity from $1k of loan paydown is wiped out by about $6k of value loss. Plan a longer hold.
- Erie County population projected at -15% by 2050 — secular population decline; favor cash flow + early exit over multi-decade hold.
Negotiation context
- Only 3 days on market — expect competitive offers; lowballing is unlikely to land.
Questions for the listing agent
- Built in 1962 — when were the roof, HVAC, electrical panel, plumbing, and water heater last replaced?
- Is there a deadline driving the sale (1031 exchange, divorce, estate, relocation)? That informs how much negotiation room exists.
- Crime grade is D in this area — have there been break-ins, vandalism, or insurance claims at this property in the last 3 years? What carrier currently insures it and at what premium?
- The area grade is low — what's the realistic commute time and amenity access for the typical tenant pool here? Any planned neighborhood developments (good or bad) we should know about?
- What's the average days-on-market for RENTAL listings here right now (not sales)? A rising rental-DOM trend means longer vacancies and softer asking-rent achievability than the comps imply.
- What's the recent tenant-quality profile in this submarket — average credit score on applications, eviction rate, late-payment / NSF rate, and stable-employment percentage? A property-management company in the area should have these aggregated.
- How much new for-sale + rental construction is in the pipeline within 1–3 miles? Heavy new supply typically softens prices + rents 12–24 months out; constrained supply supports both.
Investment metrics
- 1% rule
- 0.79% ✗
- Cap rate
- 6.36%
- Cash-on-cash
- 0.24%
- DSCR
- 1.01
- GRM
- 10.5
CMA / ARV
- ARV (on-the-fly)
- $200,606
- Comps found
- 12
Show comp detail 12 sales within ~0.75 mi
| Address | Dist | Beds/Ba | Sqft | Sold | Price | $/sf | Match |
|---|---|---|---|---|---|---|---|
| 4004 Donair Dr | 0.00mi | 3/1.0 | 1,246 (0%) | 0mo | $222,000 | $178 | 100 |
| 3818 Donair Dr | 0.11mi | 3/1.0 | 1,181 (-5%) | 8mo | $185,000 | $157 | 80 |
| 3811 Matthes Ave | 0.40mi | 3/1.0 | 1,189 (-5%) | 4mo | $211,000 | $177 | 70 |
| 120 Schiller Ave | 0.37mi | 3/2.0 | 1,236 (-1%) | 12mo | $190,000 | $154 | 68 |
| 506 Birchwood Dr | 0.16mi | 3/2.0 | 1,152 (-8%) | 15mo | $163,000 | $141 | 64 |
| 119 Gildona Dr | 0.27mi | 4/1.5 (+1) | 1,315 (+6%) | 16mo | $155,000 | $118 | 58 |
| 402 Meadow Ln | 0.20mi | 3/2.0 | 1,367 (+10%) | 16mo | $220,000 | $161 | 58 |
| 317 Michigan Ave | 0.20mi | 3/2.0 | 1,400 (+12%) | 11mo | $262,000 | $187 | 57 |
| 3807 Matthes Ave | 0.41mi | 3/2.0 | 1,355 (+9%) | 10mo | $285,000 | $210 | 54 |
| 313 Michigan Ave | 0.20mi | 3/2.0 | 1,386 (+11%) | 21mo | $205,000 | $148 | 51 |
| 311 Michigan Ave | 0.20mi | 3/1.5 | 1,393 (+12%) | 23mo | $205,000 | $147 | 50 |
| 3619 Columbus Ave | 0.46mi | 3/1.5 | 1,148 (-8%) | 20mo | $199,000 | $173 | 47 |
Match score weights: distance 35% · size 25% · config 20% · recency 20%. Top-matched comps best support the ARV.
Projected returns pro-forma
-3.0% appreciation · 3.0% rent growth · sell at horizon
- IRR
- -16.0%
- Equity multiple
- 0.43×
- Total profit
- $-31,610
- Equity at exit
- $29,672
- IRR
- -7.7%
- Equity multiple
- 0.52×
- Total profit
- $-26,884
- Equity at exit
- $17,206
Cash invested: $55,720 (down + closing). Projections, not guarantees.
Landlord ↔ Tenant lean methodology
- Overall (STATE)
- 73 Landlord-Friendly
- State Ohio
- 73 Landlord-Friendly · R+6
- County
- — inherits STATE
- City
- — inherits STATE
ZIP-level market 44870
- Active inventory
- 212
- Price-to-rent
- 10.5×
Monthly cashflow live
- Estimated rent
- $1,574 medium interval (Pro) →
- Mortgage (P&I)
- −$1,044
- Tax from tax record
- −$106 /mo · $1,274/yr
- Insurance
- −$83
- HOA
- −$0
- Vacancy / Maint / Mgmt
- −$331
- Net cashflow
- $11
Break-even live
Sensitivity live
| Price | -10% $124 | -5% $67 | +0% $11 | +5% $-45 | +10% $-102 |
|---|---|---|---|---|---|
| Rent | -10% $-113 | -5% $-51 | +0% $11 | +5% $73 | +10% $135 |
| Rate | -1.0pp $111 | -0.5pp $62 | base $11 | +0.5pp $-41 | +1.0pp $-93 |
UW: 25.0% down · 7.5% · 30yr · 1.5% tax · 5.0% vac · 8.0% maint · 8.0% mgmt
Financing live
Cash to close
- Down payment
- $49,750
- Closing costs
- $5,970
- Reserves months
- —
- Total cash needed
- —
Loan-product check · same deal, 3 products live
Conventional
25% down · 7.5% · 30yr
- Down + closing
- —
- Monthly P&I
- —
- Monthly cashflow
- —
- DSCR
- —
- Eligible?
- —
Personal DTI + credit; lowest rate.
DSCR
20% down · 8.5% · 30yr
- Down + closing
- —
- Monthly P&I
- —
- Monthly cashflow
- —
- DSCR
- —
- Eligible?
- —
No personal income docs; deal must DSCR.
Hard money
10% down · 12.0% · 12mo
- Down + closing
- —
- Monthly P&I
- —
- Monthly cashflow
- —
- DSCR
- —
- Eligible?
- —
Short-term bridge; refi at stabilization.
Listing history 4 events
-
2026-06-02status $199,000 Pending 3 DOM
-
2026-06-01days on market $199,000 Active 3 DOM
-
2026-05-31days on market $199,000 Active 2 DOM
-
2026-05-29$199,000 Active
ⓘ Source: listings_history table (triggers on properties + properties_extension) + one-shot
backfill from property_details.listing_events for pre-trigger history.
Tax reassessment forecast OH · Partial reset (capped growth)
- Current annual tax
- $1,274 · $106/mo
- Projected year-2 tax
- $2,189 · $182/mo
- Expected delta
- +$915/yr (+$76/mo · 71.8%)
ⓘ Screening estimate from a state-policy table — verify with the county assessor before closing.
Climate risk First Street
- Flood 1/10 Low FEMA zone X (unshaded) · 0% chance over 30 yrs
- Wildfire 1/10 Low
- Heat 3/10 Moderate 7 d/yr ≥95°F today · 16 d/yr by 30 yrs out
- Wind 2/10 Low
- Air quality 2/10 Low 1 unhealthy d/yr today · 2 by 30 yrs out
Nearby sold comps map
Loading sold comps map…
Walkable amenities ~0.75 mi
Loading nearby amenities…
Taxation est. · year 1
- Rental income
- $18,891
- − Mortgage interest
- −$11,147
- − Property taxes
- −$1,274
- − Insurance
- −$995
- − Repairs & maintenance
- −$1,511
- − Management
- −$1,511
- − Depreciation
- −$5,789
- Taxable loss
- −$3,337
- Est. tax savings @ 24.0%
- +$801
- After-tax cash flow
- $933/yr
For passive investors: Depreciation is non-cash, so a rental often shows a tax loss while cash-flowing — sheltering income. Rental losses are passive: they offset passive income freely, and up to $25,000/yr can offset ordinary (W-2) income if you actively participate and your MAGI is under $100k (phasing out to $0 by $150k); unused losses carry forward. On sale, claimed depreciation is recaptured at up to 25%, and gains may owe capital-gains tax (a 1031 exchange can defer both). Figures are a year-1 estimate at your 24.0% rate — not tax advice; consult a CPA.
Schools (NCES district)
- District
- Perkins Local
- NCES district ID
- 3904681
- Math proficiency
- 55% ▼ -10.00%
- Reading proficiency
- 61% ▼ -7.00%
- Median HH income
- $59,013
- Composite
- 50.26/100
- National rank
- #1890
- State rank
- #303 of 656 in OH
Livability — Sandusky
- Score
- 83/100
- State rank
- #63
- US rank
- #929
Category grades
Schools grade is shown separately in the Schools card above.
Census & demographics
- County
- Erie County · 39,883 people
- City population
- 39,883
- Metro
- Sandusky, OH
- Population (ZIP)
- 39,883
- Household income
- $62,082
- Rent vs Own
- Severe rent burden
- 1602.0
Population outlook (Erie County) Hauer SSP2
- Today (2025)
- 73,204 people
- By 2030
- 71,341 · -2.5%
- By 2040
- 66,771 · -8.8%
- By 2050
- 62,512 · -14.6%
- By 2075
- 56,154 · -23.3%
- By 2100
- 49,045 · -33.0%
Race, ethnicity, and origin ACS 2023
- Neighborhood character
- Predominantly White (72%)
- Race & ethnicity
- White 72% Black 15% Two or more races 8% Hispanic / Latino 5%
- Common ancestry
- Romanian 3% Slovak 2% Subsaharan African 1%
- Foreign-born
- 1% · Canada
- Languages at home
- 96% English-only · Spanish 2%
Political lean MEDSL · Erie
- 2024 margin
- R (+14.1) · D 42.5% · R 56.6%
- 2008→2024 swing
- -28.0pp toward R · 2008: 13.9pp · 2024: -14.1pp
- All cycles
- 2024: R+14.1 2020: R+11.6 2016: R+9.8 2012: D+11.3 2008: D+13.9
Not yet ingested
- Civics
- —
Market trends
- HPI YoY
- ▼ -151.99%
- Current HPI
- 209.6383
- Rent YoY
- —
- Metro
- Sandusky, OH
- State GDP YoY
- ▲ 1.98%
- F500 in state
- 48
Industry mix (Fortune 500 HQ in OH)
| Industry | F500 HQs | Revenue |
|---|---|---|
| Insurance | 3 | $145B |
|
||
| Industrial Machinery | 3 | $49B |
|
||
| Financial Services | 3 | $24B |
|
||
| Consumer Goods | 2 | $93B |
|
||
| Aerospace / Defense | 2 | $47B |
|
||
| Utilities | 2 | $33B |
|
||
Price history
1 event — show timeline
- 2026-05-29 Listed $199,000 FAOR
Property tax history
-0.5%/yrLatest (2025): $1,274 · -28.9% YoY. Source: county tax records.
Cash-flow waterfall
monthlySold comps — $/sqft
last 12 mo · ≤1 miLoading sold comps…