 Triplex
151 SW 15th St · Pompano Beach, FL
Flood risk 4/10 · Minor
- FEMA flood zone
- X (shaded)
- Chance of flooding over 30 yrs
- 0.13%
- Est. flood insurance / yr
- $507 – $1,088
Fire risk 1/10 · Minimal
- Est. fire insurance / yr
- $947 – $1,759
Heat risk 10/10 · Severe
- Hot days now (above 106°F)
- 7 days/yr
- Hot days in 30 yrs
- 26 days/yr
Wind risk 10/10 · Severe
- Chance of severe wind over 30 yrs
- 99.0%
Air-quality risk 2/10 · Minimal
- Unhealthy air days now
- 1 days/yr
- Unhealthy air days in 30 yrs
- 2 days/yr
Risk factors via First Street. Map © Google.
Why this score? — see what drove the D grade
The composite is a weighted blend of 9 inputs, each scored 0–100. Each bar is that input's sub-score; the figure is the points it added to the 100-point composite (weight × sub-score).
- Cash flow +13.7/30.0
- ARV discount +7.5/15.0
- DSCR +4.1/10.0
- Schools +4.1/10.0
- 1% rule +3.8/10.0
- Livability +3.7/5.0
- Rent growth +3.0/5.0
- Condition / age +2.5/5.0
- Appreciation +0.0/10.0
$699,999
🖨 Deal sheet (PDF) 📄 Offer letter ✓ Due diligence
Multi-family units
County records classify this as Multi-Family (2-4 Unit). Listing-text estimate: 3 units. confirmed
Listing remarks
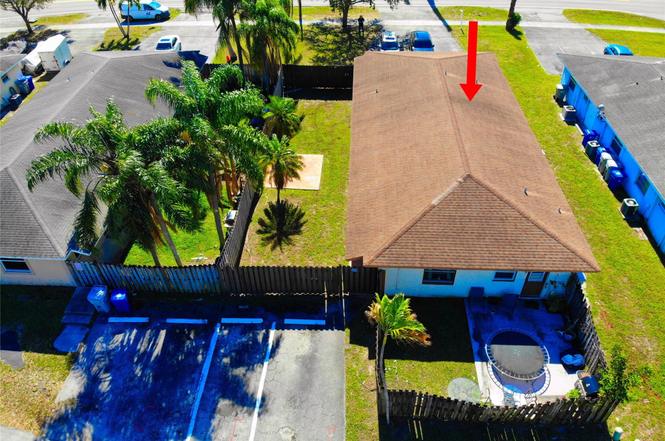
Investment opportunity! Cash only. This fully fenced triplex offers exceptional flexibility for investors and owner-occupants alike. The property features three separate units, each with spacious living rooms, bedrooms, and kitchens with eat-in areas designed to attract tenants. The 2-bedroom unit includes a private fenced yard for added appeal. Live in one unit while renting the others, or maximize cash flow with full tenancy. Ideally located near shopping, dining, beaches, and major highways, this property delivers both convenience and strong income potential. Unlock the value of this high-demand triplex and secure a smart real estate investment today.
Key facts
- Fully fenced triplex
- Private fenced yard
- Three separate units
Tags
Property features AI
Finance
- Financial info: Three units total; Gross scheduled income: $60,000; Operating expenses: $23,020; Net operating income: $22,580; Number of units in community: 3
- HOA & community: Association covers grounds maintenance, sewer, trash and water
Exterior
- Utilities: Public sewer; Cable available
- Home design: Triplex; Single-story; Resale property
- Construction: CBS construction; Composition and shingle roof
- Exterior features: Not waterfront; Cable service available
Interior
- Flooring: Tile
- Heating & cooling: Central heating with separate meters; Central air conditioning; Ceiling fans
- Interior features: Tile flooring
Neighborhood map
What this means for you Summary
Snapshot
- This is a 3 × 2-bed/1.5-bath units multifamily listed at $700k.
Deal economics
- At list price, monthly cash flow is $49 ($583/yr) — positive. Per door: $16/mo.
- The deal already cash-flows at list — no discount required.
- To meet the 1% rule (rent ≥ 1% of price), the offer needs to be $618k (11.6% below list).
- Recommended offer: $618k (11.6% below list) — sets the bar for 1% rule.
- Cap rate 6.4% vs local median 3.1% in Pompano Beach — top-decile yield for the area; either an underpriced asset or a hidden risk that comps aren't pricing in. Stress-test before assuming the spread holds.
Location & tenants
- Location reads 74/100 on livability (#284 in FL, #4,541 nationally) — a middle-class / working-renter tenant base. Strengths: commute A+, housing A+, cost of living B+; Watch: employment D+, amenities F.
- Broward (suburban): math 42% / reading 53% proficiency, ranked #46 of 73 in FL (top 63%) — families likely to look elsewhere, expect single-tenant / working-renter base with shorter leases.
- Zoned schools: Nova Blanche Forman Elementary (math 35% / reading 55%, grade D-, #1,271 of 2,144 statewide, top 60%, 769 students, 72% FRL); Nova Middle School (math 44% / reading 53%, grade C-, #274 of 571 statewide, top 50%, 1,284 students, 68% FRL); Nova High School (math 22% / reading 56%, grade F, #312 of 667 statewide, top 48%, 2,227 students, 59% FRL) — zoned schools average 66% FRL vs 51% district-wide (15 pts higher); higher-poverty schools than district average — tighter screening recommended.
- Market conditions: Rents rising (+2.1%/yr); 339 active listings in the ZIP; 40 comparable units currently listed for rent nearby; rentals at typical pace (median 26d on market — plan ~3-4 weeks tenant-placement turnaround); 2,111 units permitted in Broward County in 2024 (1,265 in 5+ unit buildings).
- At $6,185/mo this rent would consume 115% of the median local household income ($65k/yr) (locally 2870% of renters already pay >50% of income on rent) — very limited rent-growth headroom before tenants either downsize or default.
Forward outlook
- Local home prices are declining (-3.0%/yr); year-one equity from $5k of loan paydown is wiped out by about $21k of value loss. Plan a longer hold.
- Broward County population projected at +34% by 2050 — long-run rental-demand tailwind backs the buy-and-hold thesis.
Negotiation context
- It's been on market 102 days — a 9% lower offer ($637k) is reasonable based on typical stale-listing flexibility.
- 2 sale attempts; this cycle's ask is 43650% above the opening price — seller raised mid-cycle; expect resistance to lowballs.
Risks & watch-outs
- Climate carrying-cost: severe wind risk, 99% chance of damaging wind over 30y; extreme-heat days projected 7→26/yr by 2055 (HVAC capex compounding) — expect insurance premiums to compound above CPI over the hold.
Questions for the listing agent
- It's been on market 102 days. Have you received any prior offers? Is the seller open to a 12% concession, seller financing, or rate buy-down credit?
- Can we see the unit-by-unit rent roll, current vacancy, and any below-market leases? What's the average tenancy length?
- What capital expenditures (roof, boiler, parking lot, exteriors) have been made in the last 5 years, and what's planned in the next 2?
- Built in 1972 — when were the roof, HVAC, electrical panel, plumbing, and water heater last replaced?
- Why hasn't it sold? Are there any deal-killer items the seller is aware of (foundation, flood, title, zoning, code violations)?
- Is there a deadline driving the sale (1031 exchange, divorce, estate, relocation)? That informs how much negotiation room exists.
- Schools are D-rated, which usually means shorter tenancies and higher turnover. Who's the typical renter profile here, and what's been the actual vacancy rate?
- The area grade is low — what's the realistic commute time and amenity access for the typical tenant pool here? Any planned neighborhood developments (good or bad) we should know about?
- What's the average days-on-market for RENTAL listings here right now (not sales)? A rising rental-DOM trend means longer vacancies and softer asking-rent achievability than the comps imply.
- What's the recent tenant-quality profile in this submarket — average credit score on applications, eviction rate, late-payment / NSF rate, and stable-employment percentage? A property-management company in the area should have these aggregated.
- How much new apartment / multifamily construction is in the pipeline within 1–3 miles? Heavy new supply (>2% of stock underway) typically softens rents 12–24 months out; light construction supports rent growth.
Investment metrics
- 1% rule
- 0.88% ✗
- Cap rate
- 6.38%
- Cash-on-cash
- 0.30%
- DSCR
- 1.01
- GRM
- 9.4
CMA / ARV
No comps found within radius.
Projected returns pro-forma
-3.0% appreciation · 2.12% rent growth · sell at horizon
- IRR
- -16.8%
- Equity multiple
- 0.41×
- Total profit
- $-115,669
- Equity at exit
- $104,372
- IRR
- -10.3%
- Equity multiple
- 0.40×
- Total profit
- $-118,243
- Equity at exit
- $60,523
Cash invested: $196,000 (down + closing). Projections, not guarantees.
Landlord ↔ Tenant lean methodology
- Overall (STATE)
- 87 Strongly Landlord-Friendly
- State Florida
- 87 Strongly Landlord-Friendly · R+3
- County
- — inherits STATE
- City
- — inherits STATE
ZIP-level market 33060
- Home prices YoY
- -23.6%
- Rents YoY
- 2.1%
- Active inventory
- 339
- Price-to-rent
- 28.3×
Monthly cashflow live
- Estimated rent
- $6,185 high interval (Pro) →
- Mortgage (P&I)
- −$3,671
- Tax est. 1.5%
- −$875 /mo · $10,500/yr
- Insurance
- −$292
- HOA
- −$0
- Vacancy / Maint / Mgmt
- −$1,299
- Net cashflow
- $49
Break-even live
Sensitivity live
| Price | -10% $532 | -5% $290 | +0% $49 | +5% $-193 | +10% $-435 |
|---|---|---|---|---|---|
| Rent | -10% $-440 | -5% $-196 | +0% $49 | +5% $293 | +10% $537 |
| Rate | -1.0pp $401 | -0.5pp $227 | base $49 | +0.5pp $-133 | +1.0pp $-317 |
3-unit breakdown (identical units grouped — click to expand)
| Units | Beds | Baths | Est. rent |
|---|---|---|---|
| 3× units | 2 | 1.5 | $6,186 |
| #1 | 2 | 1.5 | $2,062 |
| #2 | 2 | 1.5 | $2,062 |
| #3 | 2 | 1.5 | $2,062 |
| Total (3 units) | $6,185 | ||
UW: 25.0% down · 7.5% · 30yr · 1.5% tax · 5.0% vac · 8.0% maint · 8.0% mgmt
Financing live
Cash to close
- Down payment
- $175,000
- Closing costs
- $21,000
- Reserves months
- —
- Total cash needed
- —
Loan-product check · same deal, 3 products live
Conventional
25% down · 7.5% · 30yr
- Down + closing
- —
- Monthly P&I
- —
- Monthly cashflow
- —
- DSCR
- —
- Eligible?
- —
Personal DTI + credit; lowest rate.
DSCR
20% down · 8.5% · 30yr
- Down + closing
- —
- Monthly P&I
- —
- Monthly cashflow
- —
- DSCR
- —
- Eligible?
- —
No personal income docs; deal must DSCR.
Hard money
10% down · 12.0% · 12mo
- Down + closing
- —
- Monthly P&I
- —
- Monthly cashflow
- —
- DSCR
- —
- Eligible?
- —
Short-term bridge; refi at stabilization.
Rent comps 40 comps
| Address | Beds | Baths | Sqft | Rent | $/sqft | DOM | Units | Dist |
|---|---|---|---|---|---|---|---|---|
| 100 SW 17th St Pompano Beach, FL | 3.0 | 2.0 | 1788 | $4,500 | $2.52 | 9d | 1 | 0.14mi |
| 100 SW 17th St Pompano Beach, FL | 3.0 | 2.0 | 1788 | $4,500 | $2.52 | 26d | 1 | 0.14mi |
| 342 SW 14th St Pompano Beach, FL | 3.0 | 2.0 | 1458 | $5,000 | $3.43 | 26d | 1 | 0.26mi |
| 1740 NE 64th St Fort Lauderdale, FL | 3.0 | 2.0 | 1364 | $4,800 | $3.52 | 6d | 1 | 0.26mi |
| 1740 NE 64th St Fort Lauderdale, FL | 3.0 | 2.0 | 1364 | $4,800 | $3.52 | 12d | 1 | 0.26mi |
| 160 SE 12th Ct Pompano Beach, FL | 3.0 | 2.0 | 1372 | $12,000 | $8.75 | 23d | 1 | 0.27mi |
| 1601 NE 63rd St Fort Lauderdale, FL | 3.0 | 2.0 | 1875 | $6,125 | $3.27 | 26d | 1 | 0.37mi |
| 1048 SW 1st Ter Pompano Beach, FL | 3.0 | 3.0 | 1649 | $3,800 | $2.30 | 15d | 1 | 0.38mi |
| 1040 Lyons Park Dr Pompano Beach, FL | 3.0 | 2.0 | 1564 | $3,500 | $2.24 | 26d | 1 | 0.38mi |
| 2080 NE 65th St Fort Lauderdale, FL | 3.0 | 2.0 | 1725 | $5,250 | $3.04 | 26d | 1 | 0.46mi |
| 2080 NE 65th St Fort Lauderdale, FL | 3.0 | 2.0 | 1725 | $5,000 | $2.90 | 17d | 1 | 0.46mi |
| 1065 SW 4th Ter Pompano Beach, FL | 3.0 | 2.0 | 1292 | $4,000 | $3.10 | 9d | 1 | 0.48mi |
| 6251 NE 20th Ter Fort Lauderdale, FL | 3.0 | 3.0 | 1954 | $7,000 | $3.58 | 13d | 1 | 0.49mi |
| 1961 NE 62nd Ct Fort Lauderdale, FL | 3.0 | 2.0 | 1630 | $7,000 | $4.29 | 26d | 1 | 0.51mi |
| 850 SE 1st Ave Pompano Beach, FL | 3.0 | 3.0 | 1673 | $4,450 | $2.66 | 26d | 1 | 0.55mi |
| 2101 NE 63rd St Unit 2101 Fort Lauderdale, FL | 3.0 | 2.0 | 1805 | $4,750 | $2.63 | 0d | 1 | 0.56mi |
| 2101 NE 63rd St Unit 2101 Fort Lauderdale, FL | 3.0 | 2.0 | 1805 | $4,925 | $2.73 | 22d | 1 | 0.56mi |
| 5921 NE 15th Ave Fort Lauderdale, FL | 3.0 | 3.0 | 1977 | $4,600 | $2.33 | 26d | 1 | 0.63mi |
| 1001 SE 5th Ave Pompano Beach, FL | 3.0 | 2.0 | 1492 | $4,500 | $3.02 | 26d | 1 | 0.64mi |
| 170 SE 7th St #170 Pompano Beach, FL | 3.0 | 2.5 | 1798 | $3,650 | $2.03 | 26d | 1 | 0.67mi |
| 170 SE 7th St #170 Pompano Beach, FL | 3.0 | 2.5 | 1798 | $3,550 | $1.97 | 12d | 1 | 0.67mi |
| 618 SW 1st Ter Pompano Beach, FL | 3.0 | 3.0 | 1803 | $3,295 | $1.83 | 26d | 1 | 0.75mi |
| 860 SW 10th St Pompano Beach, FL | 3.0 | 2.0 | 1354 | $3,300 | $2.44 | 26d | 1 | 0.76mi |
| 6341 NE 22nd Ave Fort Lauderdale, FL | 3.0 | 2.0 | 2086 | $5,500 | $2.64 | 16d | 1 | 0.79mi |
| 5910 NE 21st Way Fort Lauderdale, FL | 3.0 | 2.0 | 1823 | $4,950 | $2.72 | 23d | 1 | 0.81mi |
| 5790 NE 20th Ter Fort Lauderdale, FL | 3.0 | 2.0 | 1874 | $6,000 | $3.20 | 26d | 1 | 0.82mi |
| 2169 Imperial Point Dr Fort Lauderdale, FL | 2.0 | 2.0 | 1300 | $4,200 | $3.23 | 26d | 1 | 0.84mi |
| 161 SE 5th Ct Pompano Beach, FL | 3.0 | 2.0 | 1605 | $5,150 | $3.21 | 26d | 1 | 0.87mi |
| 1466 NE 57th Ct Fort Lauderdale, FL | 3.0 | 2.0 | 2020 | $8,200 | $4.06 | 26d | 1 | 0.89mi |
| 1466 NE 57th Ct Unit 1044539P Fort Lauderdale, FL | 3.0 | 2.0 | 2012 | $6,185 | $3.07 | 9d | 1 | 0.89mi |
| 2400 NE 65th St Fort Lauderdale, FL | 1.0–3.0 | 1.0–2.0 | 1103 | $2,814 | $2.55 | 0d | 15 | 0.91mi |
| 5700 NE 20th Ave Fort Lauderdale, FL | 3.0 | 2.0 | 2300 | $5,575 | $2.42 | 26d | 1 | 0.92mi |
| 1478 NE 57th St Fort Lauderdale, FL | 3.0 | 2.0 | 1590 | $5,400 | $3.40 | 26d | 1 | 0.94mi |
| 2010 NE 57th St Fort Lauderdale, FL | 3.0 | 2.0 | 1730 | $6,000 | $3.47 | 23d | 1 | 0.96mi |
| 2260 NE 62nd St Fort Lauderdale, FL | 3.0 | 2.0 | 1807 | $4,750 | $2.63 | 13d | 1 | 0.97mi |
| 1631 S Federal Hwy Pompano Beach, FL | 1.0–3.0 | 1.0–2.0 | 1092 | $2,774 | $2.54 | 0d | 16 | 1.01mi |
| 511 SE 5th St Pompano Beach, FL | 2.0 | 2.0 | 1276 | $4,200 | $3.29 | 26d | 1 | 1.01mi |
| 511 SE 5th St Pompano Beach, FL | 2.0 | 2.0 | 1276 | $4,200 | $3.29 | 23d | 1 | 1.01mi |
| 2155 NE 56th Ct Fort Lauderdale, FL | 3.0 | 2.0 | 1500 | $3,500 | $2.33 | 26d | 1 | 1.05mi |
| 280 SE 3rd Ct Pompano Beach, FL | 3.0 | 2.0 | 2042 | $5,900 | $2.89 | 26d | 1 | 1.07mi |
Listing history 17 events
-
2026-06-21days on market $699,999 Active 102 DOM
-
2026-06-18days on market $699,999 Active 99 DOM
-
2026-06-17days on market $699,999 Active 98 DOM
-
2026-06-16days on market $699,999 Active 97 DOM
-
2026-06-15days on market $699,999 Active 96 DOM
-
2026-06-13days on market $699,999 Active 94 DOM
-
2026-06-09days on market $699,999 Active 90 DOM
-
2026-06-07days on market $699,999 Active 88 DOM
-
2026-06-04days on market $699,999 Active 85 DOM
-
2026-06-03days on market $699,999 Active 84 DOM
-
2026-06-02days on market $699,999 Active 83 DOM
-
2026-06-01days on market $699,999 Active 82 DOM
-
2026-05-31days on market $699,999 Active 81 DOM
-
2026-05-06price $699,999
-
2026-03-06historical $1,600
-
2026-02-28$1,600
-
2026-01-23$709,999 Active
ⓘ Source: listings_history table (triggers on properties + properties_extension) + one-shot
backfill from property_details.listing_events for pre-trigger history.
Climate risk First Street
- Flood 4/10 Moderate FEMA zone X (shaded) · 13% chance over 30 yrs
- Wildfire 1/10 Low
- Heat 10/10 Extreme 7 d/yr ≥106°F today · 26 d/yr by 30 yrs out
- Wind 10/10 Extreme 99% chance of damaging wind over 30 yrs
- Air quality 2/10 Low 1 unhealthy d/yr today · 2 by 30 yrs out
Nearby sold comps map
Loading sold comps map…
Walkable amenities ~0.75 mi
Loading nearby amenities…
Taxation est. · year 1
- Rental income
- $74,220
- − Mortgage interest
- −$39,211
- − Property taxes
- −$10,500
- − Insurance
- −$3,500
- − Repairs & maintenance
- −$5,938
- − Management
- −$5,938
- − Depreciation
- −$20,364
- Taxable loss
- −$11,230
- Est. tax savings @ 24.0%
- +$2,695
- After-tax cash flow
- $3,278/yr
For passive investors: Depreciation is non-cash, so a rental often shows a tax loss while cash-flowing — sheltering income. Rental losses are passive: they offset passive income freely, and up to $25,000/yr can offset ordinary (W-2) income if you actively participate and your MAGI is under $100k (phasing out to $0 by $150k); unused losses carry forward. On sale, claimed depreciation is recaptured at up to 25%, and gains may owe capital-gains tax (a 1031 exchange can defer both). Figures are a year-1 estimate at your 24.0% rate — not tax advice; consult a CPA.
Schools (NCES district)
- District
- Broward
- NCES district ID
- 1200180
- Math proficiency
- 42% ▼ -18.00%
- Reading proficiency
- 53% ▼ -5.00%
- Median HH income
- $52,139
- Composite
- 40.88/100
- National rank
- #3621
- State rank
- #46 of 73 in FL
Livability — Pompano Beach
- Score
- 74/100
- State rank
- #284
- US rank
- #4541
Category grades
Schools grade is shown separately in the Schools card above.
Census & demographics
- Census place
- Pompano Beach, FL
- County
- Broward County · 1,963,430 people
- City population
- 155,861
- Metro
- Miami-Fort Lauderdale-Pompano Beach, FL
- Population (ZIP)
- 37,233
- Household income
- $64,819
- Rent vs Own
- Severe rent burden
- 2870.0
Population outlook (Broward County) Hauer SSP2
- Today (2025)
- 2,207,033 people
- By 2030
- 2,360,704 · +7.0%
- By 2040
- 2,661,208 · +20.6%
- By 2050
- 2,946,698 · +33.5%
- By 2075
- 3,602,273 · +63.2%
- By 2100
- 3,970,984 · +79.9%
Race, ethnicity, and origin ACS 2023
- Neighborhood character
- Diverse neighborhood (Simpson 0.69)
- Race & ethnicity
- Black 38% White 33% Hispanic / Latino 26% Two or more races 14%
- Hispanic origin (detail)
- Mexican 9% Puerto Rican 2% Cuban 3% Dominican 1%
- Common ancestry
- Hispanic 13% Romanian 2% Slovak 1%
- Foreign-born
- 31% · Canada, Jamaica
- Languages at home
- 60% English-only · Spanish 23% French/Haitian/Cajun 13% Other Indo-European 2%
Political lean MEDSL · Broward
- 2024 margin
- D (+17.0) · D 58.0% · R 41.0%
- 2008→2024 swing
- -17.8pp toward R · 2008: 34.7pp · 2024: 17.0pp
- All cycles
- 2024: D+17.0 2020: D+29.8 2016: D+35.0 2012: D+34.9 2008: D+34.7
Not yet ingested
- Civics
- —
Market trends
- HPI YoY
- ▼ -131.09%
- Current HPI
- 425.3083
- Rent YoY
- ▲ 2.12%
- Metro
- Miami-Fort Lauderdale-Pompano Beach, FL
- State GDP YoY
- ▲ 3.28%
- F500 in state
- 36
Industry mix (Fortune 500 HQ in FL)
| Industry | F500 HQs | Revenue |
|---|---|---|
| Industrial Technology | 2 | $29B |
|
||
| Insurance | 2 | $17B |
|
||
| Retail | 1 | $60B |
|
||
| Technology Distribution | 1 | $58B |
|
||
| Homebuilding | 1 | $35B |
|
||
| Technology Manufacturing | 1 | $35B |
|
||
Price history
-1.4% since first listed4 events — show timeline
- 2026-05-06 Price Changed $699,999 Beaches MLS
- 2026-03-06 Rental Removed $1,600 LISTANZA
- 2026-02-28 Listed for Rent $1,600 LISTANZA
- 2026-01-23 Listed $709,999 Beaches MLS
Cash-flow waterfall
monthlySold comps — $/sqft
last 12 mo · ≤1 miLoading sold comps…