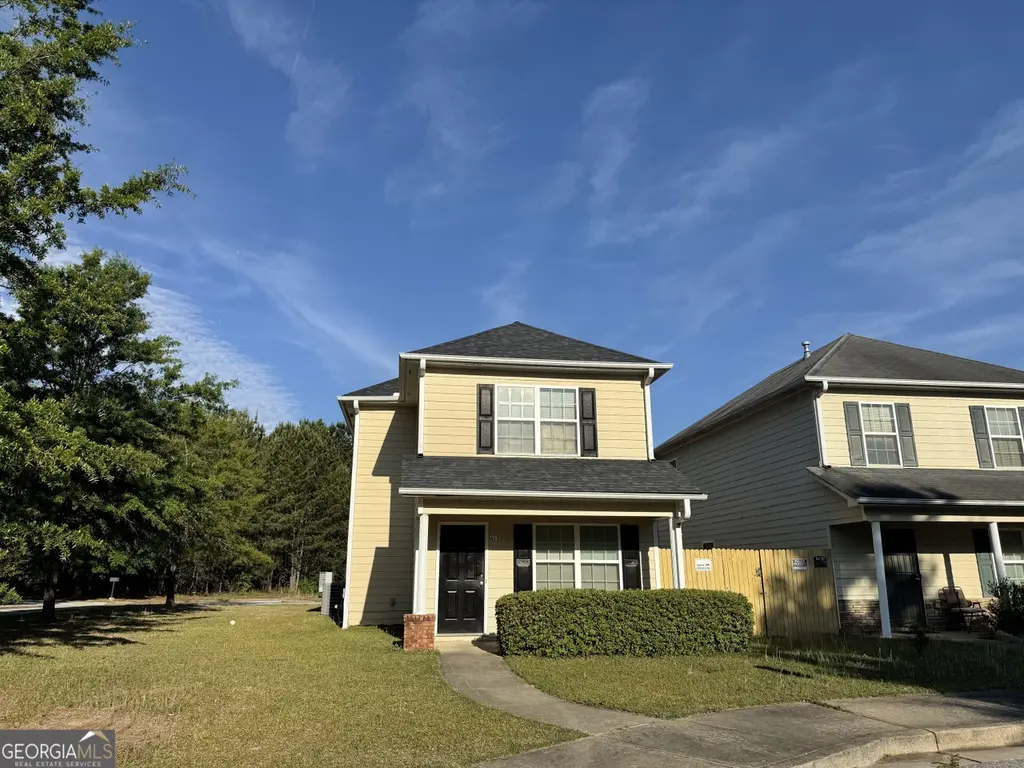
6132 Ruth St SW · Covington, GA
Flood risk 1/10 · Minimal
- FEMA flood zone
- X (unshaded)
- Chance of flooding over 30 yrs
- 0.0%
- Est. flood insurance / yr
- $507 – $1,088
Fire risk 3/10 · Minor
- Est. fire insurance / yr
- $963 – $1,789
Heat risk 6/10 · Moderate
- Hot days now (above 106°F)
- 7 days/yr
- Hot days in 30 yrs
- 18 days/yr
Wind risk 6/10 · Moderate
- Chance of severe wind over 30 yrs
- 27.0%
Air-quality risk 4/10 · Minor
- Unhealthy air days now
- 5 days/yr
- Unhealthy air days in 30 yrs
- 6 days/yr
Risk factors via First Street. Map © Google.
Why this score? — see what drove the C+ grade
The composite is a weighted blend of 9 inputs, each scored 0–100. Each bar is that input's sub-score; the figure is the points it added to the 100-point composite (weight × sub-score).
- Cash flow +24.4/30.0
- ARV discount +15.0/15.0
- DSCR +7.9/10.0
- 1% rule +6.0/10.0
- Livability +3.0/5.0
- Rent growth +2.6/5.0
- Condition / age +2.5/5.0
- Schools +1.9/10.0
- Appreciation +0.0/10.0
$239,900
🖨 Deal sheet 📄 Offer letter ✓ Due diligence
Listing remarks
Back on the Market! No fault of the seller. Unbelievable Price for a 5 Bedroom with 100% financing available! Renovated and Move-In Ready! Convenience is the key word located on a corner lot in Walker's Bend subdivision waiting for you to enjoy everything that Covington has to offer. Unique layout with bedroom on the main and 4 additional bedrooms upstairs. You will love the oversized closets, dual vanity, welcoming front porch and covered parking with attached carport. Make this one yours and remove the stress knowing you can move right in and start enjoying YOUR new home!
Key facts
- Covered parking
- Attached carport
- Oversized closets
Tags
Property features AI
Finance
- Other: Property type: Residential, single family residence; Location: Covington, GA (Walkers Bend subdivision)
- HOA & community: No HOA; Community features include sidewalks, street lights, and nearby shopping
Exterior
- Parking: Attached carport with side/rear entrance
- Utilities: Public water; Public sewer; Electricity available; Cable available; High-speed internet available; Phone available; Underground utilities; Sewer connected; Water available
- Home design: Single family house; Two levels; Updated / remodeled
- Construction: Built in 2005; Concrete construction; Composition roof; Slab foundation
- Exterior features: Porch; Corner lot; Level lot
Interior
- Kitchen: Dishwasher; Refrigerator; Electric water heater
- Bedrooms: 5 bedrooms (1 bedroom on the main level)
- Flooring: Carpet; Laminate; Vinyl
- Bathrooms: 2 full bathrooms
- Heating & cooling: Central electric heating; Central air conditioning; Ceiling fans
- Interior features: Double vanity; Split bedroom plan; Walk-in closets; Family room
- Laundry & utility: Laundry area (other)
Neighborhood map
What this means for you Summary
Snapshot
- This is a 5-bed/1.5-bath single-family listed at $240k.
Deal economics
- At list price, monthly cash flow is $485 ($6k/yr) — positive.
- The deal already cash-flows at list — no discount required.
- Meets the 1% rule at list price ($3k rent vs $240k).
- Cap rate 8.7% vs local median 3.8% in Covington — top-decile yield for the area; either an underpriced asset or a hidden risk that comps aren't pricing in. Stress-test before assuming the spread holds.
Location & tenants
- Location reads 59/100 on livability (#396 in GA) — a working-class tenant base; expect higher turnover. Strengths: cost of living A+, housing A+, health & safety B+; Watch: crime F, amenities F, commute F.
- Newton County (suburban): math 17% / reading 26% proficiency, ranked #137 of 174 in GA (top 79%) — low school quality limits family demand, transient renter base, plan for 1-2y turnover.
- Zoned schools: Porterdale Elementary School (math 8% / reading 12%, grade F, #1,092 of 1,228 statewide, top 91%, 417 students, 85% FRL); Clements Middle School (math 6% / reading 17%, grade F, #424 of 470 statewide, top 90%, 754 students, 85% FRL); Eastside High School (math 7% / reading 17%, grade F, #342 of 424 statewide, top 81%, 1,621 students, 46% FRL).
- Market conditions: Rents flat; 479 active listings in the ZIP; 2 comparable units currently listed for rent nearby; 1,480 units permitted in Newton County in 2024 (702 in 5+ unit buildings).
- This rent runs 44% of the median local income ($72k/yr) — at the standard rent-burdened threshold; future hikes will face affordability resistance.
Forward outlook
- Local home prices are declining (-3.0%/yr); year-one equity from $2k of loan paydown is wiped out by about $7k of value loss. Plan a longer hold.
- Newton County population projected at +23% by 2050 — long-run rental-demand tailwind backs the buy-and-hold thesis.
Negotiation context
- Only 7 days on market — expect competitive offers; lowballing is unlikely to land.
- 2 sale attempts since 16y ago with the ask held roughly flat each time — persistent listings suggest the price (not the market) is what's stuck; bring a comps-based counter.
Risks & watch-outs
- Climate carrying-cost: major wind risk, 27% chance of damaging wind over 30y; extreme-heat days projected 7→18/yr by 2055 (HVAC capex compounding) — expect insurance premiums to compound above CPI over the hold.
Questions for the listing agent
- Is there a deadline driving the sale (1031 exchange, divorce, estate, relocation)? That informs how much negotiation room exists.
- Schools are F-rated, which usually means shorter tenancies and higher turnover. Who's the typical renter profile here, and what's been the actual vacancy rate?
- Crime grade is F in this area — have there been break-ins, vandalism, or insurance claims at this property in the last 3 years? What carrier currently insures it and at what premium?
- What's the average days-on-market for RENTAL listings here right now (not sales)? A rising rental-DOM trend means longer vacancies and softer asking-rent achievability than the comps imply.
- What's the recent tenant-quality profile in this submarket — average credit score on applications, eviction rate, late-payment / NSF rate, and stable-employment percentage? A property-management company in the area should have these aggregated.
- How much new for-sale + rental construction is in the pipeline within 1–3 miles? Heavy new supply typically softens prices + rents 12–24 months out; constrained supply supports both.
Investment metrics
- 1% rule
- 1.10% ✓
- Cap rate
- 8.72%
- Cash-on-cash
- 8.67%
- DSCR
- 1.39
- GRM
- 7.6
CMA / ARV
- ARV (on-the-fly)
- $287,964
- Comps found
- 12
Show comp detail 12 sales within ~0.75 mi
| Address | Dist | Beds/Ba | Sqft | Sold | Price | $/sf | Match |
|---|---|---|---|---|---|---|---|
| 7776 Sudbury Circle Ave | 0.14mi | 4/2.5 (-1) | 1,801 (+7%) | 6mo | $309,990 | $172 | 68 |
| 7674 Saffron Ave | 0.17mi | 4/2.5 (-1) | 1,801 (+7%) | 7mo | $299,990 | $167 | 65 |
| 7763 Sudbury Cir | 0.10mi | 4/2.5 (-1) | 1,801 (+7%) | 13mo | $271,000 | $150 | 64 |
| 7713 Sudbury Cir | 0.06mi | 4/2.5 (-1) | 1,801 (+7%) | 16mo | $314,990 | $175 | 64 |
| 7407 Cranleigh St | 0.11mi | 4/2.5 (-1) | 1,801 (+7%) | 22mo | $313,990 | $174 | 56 |
| 7536 Saffron Ave | 0.19mi | 4/2.5 (-1) | 1,801 (+7%) | 17mo | $263,933 | $147 | 56 |
| 8302 N Sterling Lakes Dr | 0.64mi | 4/2.5 (-1) | 1,694 (+1%) | 12mo | $210,000 | $124 | 50 |
| 2182 Brown St | 0.75mi | 4/2.0 (-1) | 1,728 (+3%) | 8mo | $315,000 | $182 | 47 |
| 8120 Highland Dr SW | 0.49mi | 4/2.0 (-1) | 1,908 (+13%) | 4mo | $326,500 | $171 | 45 |
| 8201 N Sterling Lakes Dr | 0.52mi | 4/2.5 (-1) | 1,862 (+11%) | 6mo | $250,000 | $134 | 44 |
| 9415 Bandywood Dr SW | 0.43mi | 4/2.5 (-1) | 1,840 (+9%) | 19mo | $319,000 | $173 | 39 |
| 9105 Sterling Lakes Cir | 0.69mi | 4/3.0 (-1) | 1,500 (-11%) | 12mo | $223,000 | $149 | 29 |
Match score weights: distance 35% · size 25% · config 20% · recency 20%. Top-matched comps best support the ARV.
Projected returns pro-forma
-3.0% appreciation · 0.52% rent growth · sell at horizon
- IRR
- -5.9%
- Equity multiple
- 0.79×
- Total profit
- $-14,374
- Equity at exit
- $35,770
- IRR
- 0.5%
- Equity multiple
- 1.03×
- Total profit
- $2,254
- Equity at exit
- $20,742
Cash invested: $67,172 (down + closing). Projections, not guarantees.
Landlord ↔ Tenant lean methodology
- Overall (STATE)
- 90 Strongly Landlord-Friendly
- State Georgia
- 90 Strongly Landlord-Friendly · R+3
- County
- — inherits STATE
- City
- — inherits STATE
ZIP-level market 30014
- Home prices YoY
- -19.2%
- Rents YoY
- 0.5%
- Active inventory
- 479
- Price-to-rent
- 7.6×
Monthly cashflow live
- Estimated rent
- $2,633 medium interval (Pro) →
- Mortgage (P&I)
- −$1,258
- Tax from tax record
- −$237 /mo · $2,841/yr
- Insurance
- −$100
- HOA
- −$0
- Vacancy / Maint / Mgmt
- −$553
- Net cashflow
- $485
Break-even live
UW: 25.0% down · 7.5% · 30yr · 1.5% tax · 5.0% vac · 8.0% maint · 8.0% mgmt
Financing live
Cash to close
- Down payment
- $59,975
- Closing costs
- $7,197
- Reserves months
- —
- Total cash needed
- —
Loan-product check · same deal, 3 products live
Conventional
25% down · 7.5% · 30yr
- Down + closing
- —
- Monthly P&I
- —
- Monthly cashflow
- —
- DSCR
- —
- Eligible?
- —
Personal DTI + credit; lowest rate.
DSCR
20% down · 8.5% · 30yr
- Down + closing
- —
- Monthly P&I
- —
- Monthly cashflow
- —
- DSCR
- —
- Eligible?
- —
No personal income docs; deal must DSCR.
Hard money
10% down · 12.0% · 12mo
- Down + closing
- —
- Monthly P&I
- —
- Monthly cashflow
- —
- DSCR
- —
- Eligible?
- —
Short-term bridge; refi at stabilization.
Rent comps 2 comps
| Address | Beds | Baths | Sqft | Rent | $/sqft | DOM | Units | Dist |
|---|---|---|---|---|---|---|---|---|
| 9161 Thrash St SW Covington, GA | 4.0 | 2.0 | 1272 | $1,481 | $1.16 | 43d | 1 | 0.84mi |
| 4112 Dorchester Dr SE Covington, GA | 3.0–5.0 | 2.5–4.0 | 2299 | $3,424 | $1.49 | 1d | 1 | 1.21mi |
Listing history 31 events
-
2026-06-18statusdays on market $239,900 Active 7 DOM
-
2026-06-17days on market $239,900 Back On Market 6 DOM
-
2026-06-16days on market $239,900 Back On Market 5 DOM
-
2026-06-15remarks 584-char remark
-
2026-06-15statusdays on market $239,900 Back On Market 4 DOM
-
2026-05-25$239,900 New
-
2016-02-10price $58,800
-
2010-07-16price $58,800 Reduced
-
2010-07-07price $58,900
-
2010-07-01historical
-
2010-06-29price $59,000
-
2010-06-28price $59,000
-
2010-06-22price $59,100
-
2010-06-21price $59,100
-
2010-06-15price $59,200
-
2010-06-14price $59,200
-
2010-06-07price $59,300
-
2010-06-02price $59,400
-
2010-06-01price $59,400
-
2010-05-25price $59,500
-
2010-05-24price $59,500
-
2010-05-20price $59,600
-
2010-05-17price $59,600
-
2010-05-12price $59,700
-
2010-05-10price $59,700
-
2010-05-05price $59,800 Reduced
-
2010-05-04price $59,800
-
2010-04-20$59,900 Active
-
2008-03-12soldstatus $656,250
-
2007-03-05soldstatus $118,000
-
2005-02-24soldstatus $245,000
ⓘ Source: listings_history table (triggers on properties + properties_extension) + one-shot
backfill from property_details.listing_events for pre-trigger history.
Tax reassessment forecast GA · Resets to sale price
- Current annual tax
- $2,841 · $237/mo
- Projected year-2 tax
- $2,841 · $237/mo
- Expected delta
- $0/yr ($0/mo · 0.0%)
ⓘ Screening estimate from a state-policy table — verify with the county assessor before closing.
Climate risk First Street
- Flood 1/10 Low FEMA zone X (unshaded) · 0% chance over 30 yrs
- Wildfire 3/10 Moderate
- Heat 6/10 Major 7 d/yr ≥106°F today · 18 d/yr by 30 yrs out
- Wind 6/10 Major 27% chance of damaging wind over 30 yrs
- Air quality 4/10 Moderate 5 unhealthy d/yr today · 6 by 30 yrs out
Nearby sold comps map
Loading sold comps map…
Walkable amenities ~0.75 mi
Loading nearby amenities…
Taxation est. · year 1
- Rental income
- $31,597
- − Mortgage interest
- −$13,438
- − Property taxes
- −$2,841
- − Insurance
- −$1,200
- − Repairs & maintenance
- −$2,528
- − Management
- −$2,528
- − Depreciation
- −$6,979
- Taxable income
- $2,083
- Est. tax owed @ 24.0%
- −$500
- After-tax cash flow
- $5,324/yr
For passive investors: Depreciation is non-cash, so a rental often shows a tax loss while cash-flowing — sheltering income. Rental losses are passive: they offset passive income freely, and up to $25,000/yr can offset ordinary (W-2) income if you actively participate and your MAGI is under $100k (phasing out to $0 by $150k); unused losses carry forward. On sale, claimed depreciation is recaptured at up to 25%, and gains may owe capital-gains tax (a 1031 exchange can defer both). Figures are a year-1 estimate at your 24.0% rate — not tax advice; consult a CPA.
Schools (NCES district)
- District
- Newton County
- NCES district ID
- 1303930
- Math proficiency
- 17% ▼ -13.00%
- Reading proficiency
- 26% ▼ -8.00%
- Median HH income
- $50,768
- Composite
- 19.2/100
- National rank
- #8816
- State rank
- #137 of 174 in GA
Livability — Covington
- Score
- 59/100
- State rank
- #396
- US rank
- #19602
Category grades
Schools grade is shown separately in the Schools card above.
Census & demographics
- Census place
- Covington, GA
- County
- Newton County · 104,393 people
- City population
- 104,393
- Metro
- Atlanta-Sandy Springs-Alpharetta, GA
- Population (ZIP)
- 41,425
- Household income
- $72,254
- Rent vs Own
- Severe rent burden
- 1934.0
Population outlook (Newton County) Hauer SSP2
- Today (2025)
- 118,372 people
- By 2030
- 124,234 · +5.0%
- By 2040
- 135,550 · +14.5%
- By 2050
- 145,309 · +22.8%
- By 2075
- 166,843 · +40.9%
- By 2100
- 175,800 · +48.5%
Race, ethnicity, and origin ACS 2023
- Neighborhood character
- Diverse neighborhood (Simpson 0.59)
- Race & ethnicity
- White 53% Black 35% Hispanic / Latino 7% Two or more races 6% Asian 2%
- Hispanic origin (detail)
- Mexican 3%
- Common ancestry
- Italian 2% Slovak 2% Serbian 1%
- Foreign-born
- 7% · Canada
- Languages at home
- 93% English-only · Spanish 5% Other Indo-European 1%
Political lean MEDSL · Newton
- 2024 margin
- D (+15.1) · D 57.3% · R 42.2%
- 2008→2024 swing
- +14.0pp toward D · 2008: 1.2pp · 2024: 15.1pp
- All cycles
- 2024: D+15.1 2020: D+10.9 2016: D+2.4 2012: D+2.0 2008: D+1.2
Not yet ingested
- Civics
- —
Market trends
- HPI YoY
- ▼ -64.50%
- Current HPI
- 270.9868
- Rent YoY
- ▲ 0.52%
- Metro
- Atlanta-Sandy Springs-Alpharetta, GA
- State GDP YoY
- ▲ 2.66%
- F500 in state
- 28
Industry mix (Fortune 500 HQ in GA)
| Industry | F500 HQs | Revenue |
|---|---|---|
| Paper / Packaging | 2 | $29B |
|
||
| Retail | 1 | $160B |
|
||
| Transportation / Logistics | 1 | $91B |
|
||
| Airlines | 1 | $62B |
|
||
| Consumer Goods | 1 | $47B |
|
||
| Utilities | 1 | $25B |
|
||
Price history
-2.1% since first listed26 events — show timeline
- 2026-05-25 Listed $239,900 GAMLS
- 2016-02-10 Price Changed $58,800 FMLS
- 2010-07-16 Price Changed $58,800 GAMLS
- 2010-07-07 Price Changed $58,900 GAMLS
- 2010-07-01 Listing Removed — FMLS
- 2010-06-29 Price Changed $59,000 GAMLS
- 2010-06-28 Price Changed $59,000 FMLS
- 2010-06-22 Price Changed $59,100 GAMLS
- 2010-06-21 Price Changed $59,100 FMLS
- 2010-06-15 Price Changed $59,200 GAMLS
- 2010-06-14 Price Changed $59,200 FMLS
- 2010-06-07 Price Changed $59,300 FMLS
- 2010-06-02 Price Changed $59,400 GAMLS
- 2010-06-01 Price Changed $59,400 FMLS
- 2010-05-25 Price Changed $59,500 GAMLS
- 2010-05-24 Price Changed $59,500 FMLS
- 2010-05-20 Price Changed $59,600 GAMLS
- 2010-05-17 Price Changed $59,600 FMLS
- 2010-05-12 Price Changed $59,700 GAMLS
- 2010-05-10 Price Changed $59,700 FMLS
- 2010-05-05 Price Changed $59,800 GAMLS
- 2010-05-04 Price Changed $59,800 FMLS
- 2010-04-20 Listed $59,900 FMLS
- 2008-03-12 Sold (Public Records) $656,250 Public Records
- 2007-03-05 Sold (Public Records) $118,000 Public Records
- 2005-02-24 Sold (Public Records) $245,000 Public Records
Property tax history
+9.6%/yrLatest (2025): $2,841 · +5.4% YoY. Source: county tax records.
Cash-flow waterfall
monthlySold comps — $/sqft
last 12 mo · ≤1 miLoading sold comps…