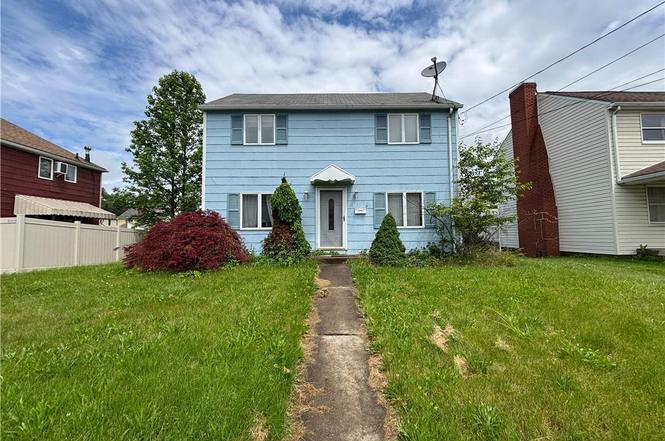
617 Grandview Ave · Clairton, PA
Flood risk 1/10 · Minimal
- FEMA flood zone
- X (unshaded)
- Chance of flooding over 30 yrs
- 0.0%
- Est. flood insurance / yr
- $473 – $860
Fire risk 1/10 · Minimal
- Est. fire insurance / yr
- $511 – $949
Heat risk 4/10 · Minor
- Hot days now (above 96°F)
- 7 days/yr
- Hot days in 30 yrs
- 18 days/yr
Wind risk 2/10 · Minimal
- Chance of severe wind over 30 yrs
- —
Air-quality risk 5/10 · Moderate
- Unhealthy air days now
- 8 days/yr
- Unhealthy air days in 30 yrs
- 8 days/yr
Risk factors via First Street. Map © Google.
Why this score? — see what drove the B+ grade
The composite is a weighted blend of 9 inputs, each scored 0–100. Each bar is that input's sub-score; the figure is the points it added to the 100-point composite (weight × sub-score).
- Cash flow +30.0/30.0
- ARV discount +13.8/15.0
- 1% rule +10.0/10.0
- DSCR +10.0/10.0
- Rent growth +5.0/5.0
- Livability +3.2/5.0
- Condition / age +2.5/5.0
- Schools +1.1/10.0
- Appreciation +0.0/10.0
$80,000
🖨 Deal sheet (PDF) 📄 Offer letter ✓ Due diligence
Listing remarks MLS
Looking for an easy-as-it gets quick flip or rental? Look no further. As you can see in the pictures, this home has been exceptionally well maintained. The roof may need swapping and a window needs repair, but other than that the renovations ups are all cosmetic in nature. You could open up the kitchen for a more open concept layout or simply leave it as is and cash flow from day one.
Key facts
- Tons of storage
- Large flat backyard
- Covered back porch
Tags
Property features AI
Finance
- Financial info: Annual taxes reported
Exterior
- Utilities: Public water; Public sewer
- Home design: 2-story residence; Resale property
- Exterior features: Small lot (approximately 0.124 acres)
Interior
- Bathrooms: 2 full bathrooms
- Heating & cooling: Gas heating
- Interior features: Unfinished basement
Neighborhood map
What this means for you Summary
Snapshot
- This is a 3-bed/1.0-bath single-family listed at $80k.
Deal economics
- At list price, monthly cash flow is $340 ($4k/yr) — positive.
- The deal already cash-flows at list — no discount required.
- Meets the 1% rule at list price ($1k rent vs $80k).
Location & tenants
- Location reads 63/100 on livability (#1,308 in PA) — a middle-class / working-renter tenant base. Strengths: cost of living A+, housing A; Watch: crime C-, health & safety D+, schools F.
- Clairton City SD (suburban): math 7% / reading 21% proficiency, ranked #520 of 539 in PA (top 96%) — low school quality limits family demand, transient renter base, plan for 1-2y turnover; 82% free/reduced lunch — lower-income household profile, screen leases tightly.
- Market conditions: Rents rising fast (+10.5%/yr); 94 active listings in the ZIP; 15 comparable units currently listed for rent nearby; rentals lingering (median 45d on market — plan ~5-8 weeks vacancy on turnover, expect pricing pressure); 60% of comp listings sitting > 30 days — soft ceiling on asking rent; solid renter incomes; 2,996 units permitted in Allegheny County in 2024 (1,588 in 5+ unit buildings).
Forward outlook
- Local home prices are declining (-3.0%/yr); year-one equity from $553 of loan paydown is wiped out by about $2k of value loss. Plan a longer hold.
- At projected returns (-3.0% appreciation + 8.0% rent growth), your $22k cash investment doubles in ~6 years — after that, you're playing with house money.
Negotiation context
- Only 6 days on market — expect competitive offers; lowballing is unlikely to land.
- 6 sale attempts since 23y ago with the ask held roughly flat each time — persistent listings suggest the price (not the market) is what's stuck; bring a comps-based counter.
- Current owner paid $65k; 23% above their basis — modest negotiation headroom, anchor on the comps not their cost.
Risks & watch-outs
- Watch-outs: property tax is 2.7% of price; built in 1938 — expect roof / HVAC / electrical / plumbing capex.
Questions for the listing agent
- Built in 1938 — when were the roof, HVAC, electrical panel, plumbing, and water heater last replaced?
- Property tax is high relative to price — has the assessment been appealed recently, and will the sale trigger a re-assessment?
- Is there a deadline driving the sale (1031 exchange, divorce, estate, relocation)? That informs how much negotiation room exists.
- Schools are F-rated, which usually means shorter tenancies and higher turnover. Who's the typical renter profile here, and what's been the actual vacancy rate?
- What's the average days-on-market for RENTAL listings here right now (not sales)? A rising rental-DOM trend means longer vacancies and softer asking-rent achievability than the comps imply.
- What's the recent tenant-quality profile in this submarket — average credit score on applications, eviction rate, late-payment / NSF rate, and stable-employment percentage? A property-management company in the area should have these aggregated.
- How much new for-sale + rental construction is in the pipeline within 1–3 miles? Heavy new supply typically softens prices + rents 12–24 months out; constrained supply supports both.
Investment metrics
- 1% rule
- 1.54% ✓
- Cap rate
- 11.39%
- Cash-on-cash
- 18.20%
- DSCR
- 1.81
- GRM
- 5.4
CMA / ARV
- ARV (on-the-fly)
- $93,080
- Comps found
- 12
Show comp detail 12 sales within ~0.75 mi
| Address | Dist | Beds/Ba | Sqft | Sold | Price | $/sf | Match |
|---|---|---|---|---|---|---|---|
| 712 Lafayette Dr | 0.15mi | 2/1.0 (-1) | 1,467 (+2%) | 2mo | $176,000 | $120 | 82 |
| 534 Independence Dr | 0.26mi | 3/1.0 | 1,445 (+1%) | 7mo | $55,000 | $38 | 81 |
| 636 Constitution | 0.22mi | 3/2.0 | 1,453 (+2%) | 4mo | $95,000 | $65 | 80 |
| 1706 Polk Ave | 0.47mi | 3/1.0 | 1,278 (-11%) | 6mo | $36,000 | $28 | 55 |
| 333 Wylie Ave | 0.55mi | 3/1.5 | 1,544 (+8%) | 7mo | $61,000 | $40 | 54 |
| 306 Chicago Ave | 0.69mi | 2/1.0 (-1) | 1,360 (-5%) | 4mo | $97,500 | $72 | 51 |
| 901 Gary Ave | 0.49mi | 3/2.0 | 1,640 (+14%) | 1mo | $90,000 | $55 | 48 |
| 819 Toman Ave | 0.54mi | 3/2.0 | 1,242 (-13%) | 1mo | $78,000 | $63 | 48 |
| 429 Baker Ave | 0.44mi | 2/1.5 (-1) | 1,250 (-13%) | 6mo | $120,000 | $96 | 46 |
| 1117 Mckinley Dr | 0.64mi | 4/2.0 (+1) | 1,552 (+8%) | 5mo | $192,000 | $124 | 43 |
| 737 Saint Clair Ave | 0.72mi | 3/2.0 | 1,264 (-12%) | 2mo | $159,900 | $127 | 41 |
| 101 Church St | 0.62mi | 4/1.0 (+1) | 1,264 (-12%) | 10mo | $60,000 | $47 | 38 |
Match score weights: distance 35% · size 25% · config 20% · recency 20%. Top-matched comps best support the ARV.
Projected returns pro-forma
-3.0% appreciation · 8.0% rent growth · sell at horizon
- IRR
- 15.9%
- Equity multiple
- 1.68×
- Total profit
- $15,247
- Equity at exit
- $11,928
- IRR
- 28.2%
- Equity multiple
- 4.17×
- Total profit
- $71,038
- Equity at exit
- $6,917
Cash invested: $22,400 (down + closing). Projections, not guarantees.
Landlord ↔ Tenant lean methodology
- Overall (STATE)
- 62 Landlord-Friendly
- State Pennsylvania
- 62 Landlord-Friendly · EVEN
- County
- — inherits STATE
- City
- — inherits STATE
ZIP-level market 15025
- Home prices YoY
- -34.4%
- Rents YoY
- 10.5%
- Active inventory
- 94
- Price-to-rent
- 5.4×
Monthly cashflow live
- Estimated rent
- $1,232 high interval (Pro) →
- Mortgage (P&I)
- −$420
- Tax from tax record
- −$181 /mo · $2,167/yr
- Insurance
- −$33
- HOA
- −$0
- Vacancy / Maint / Mgmt
- −$259
- Net cashflow
- $340
Break-even live
Sensitivity live
| Price | -10% $385 | -5% $362 | +0% $340 | +5% $317 | +10% $294 |
|---|---|---|---|---|---|
| Rent | -10% $242 | -5% $291 | +0% $340 | +5% $388 | +10% $437 |
| Rate | -1.0pp $380 | -0.5pp $360 | base $340 | +0.5pp $319 | +1.0pp $298 |
UW: 25.0% down · 7.5% · 30yr · 1.5% tax · 5.0% vac · 8.0% maint · 8.0% mgmt
Financing live
Cash to close
- Down payment
- $20,000
- Closing costs
- $2,400
- Reserves months
- —
- Total cash needed
- —
Loan-product check · same deal, 3 products live
Conventional
25% down · 7.5% · 30yr
- Down + closing
- —
- Monthly P&I
- —
- Monthly cashflow
- —
- DSCR
- —
- Eligible?
- —
Personal DTI + credit; lowest rate.
DSCR
20% down · 8.5% · 30yr
- Down + closing
- —
- Monthly P&I
- —
- Monthly cashflow
- —
- DSCR
- —
- Eligible?
- —
No personal income docs; deal must DSCR.
Hard money
10% down · 12.0% · 12mo
- Down + closing
- —
- Monthly P&I
- —
- Monthly cashflow
- —
- DSCR
- —
- Eligible?
- —
Short-term bridge; refi at stabilization.
Rent comps 15 comps
| Address | Beds | Baths | Sqft | Rent | $/sqft | DOM | Units | Dist |
|---|---|---|---|---|---|---|---|---|
| 618 Farnsworth Ave Clairton, PA | 2.0 | 1.0 | 896 | $1,050 | $1.17 | 45d | 1 | 0.01mi |
| 601 Farnsworth Ave Clairton, PA | 2.0 | 1.0 | 1004 | $995 | $0.99 | 5d | 1 | 0.06mi |
| 127 Constitution Cir Clairton, PA | 2.0 | 1.0 | 1063 | $1,275 | $1.20 | 12d | 1 | 0.26mi |
| 127 Constitution Cir Clairton, PA | 2.0 | 1.0 | 972 | $1,275 | $1.31 | 3d | 1 | 0.26mi |
| 866 Vankirk St Unit 1 Clairton, PA | 2.0 | 1.5 | 1440 | $1,200 | $0.83 | 45d | 1 | 0.29mi |
| 874 Vankirk St Clairton, PA | 3.0 | 1.5 | 1296 | $1,150 | $0.89 | 45d | 1 | 0.29mi |
| 753 East Dr Clairton, PA | 3.0 | 1.0 | 1000 | $1,100 | $1.10 | 45d | 1 | 0.30mi |
| 350 Wylie Ave Unit 1 Clairton, PA | 2.0 | 1.0 | 1152 | $1,050 | $0.91 | 45d | 1 | 0.50mi |
| 809 3rd St Unit 624 Clairton, PA | 2.0 | 1.5 | 1240 | $1,008 | $0.81 | 45d | 1 | 0.52mi |
| 809 3rd St Unit 194 Clairton, PA | 2.0 | 1.5 | 1244 | $1,081 | $0.87 | 45d | 1 | 0.52mi |
| 701-703 Waddell Ave Clairton, PA | 4.0 | 1.0 | 1200 | $1,850 | $1.54 | 3d | 1 | 0.74mi |
| 513 S 2nd Ave Elizabeth, PA | 3.0 | 1.5 | 1625 | $1,195 | $0.74 | 3d | 1 | 0.94mi |
| 2140 Lincoln Blvd Elizabeth, PA | 2.0 | 1.0 | 968 | $790 | $0.82 | 45d | 1 | 0.99mi |
| 168 Center Ave Unit 1 left) Elizabeth, PA | 2.0 | 1.0 | 950 | $895 | $0.94 | 25d | 1 | 1.11mi |
| 507 N 6th St Clairton, PA | 2.0 | 1.5 | 1120 | $1,250 | $1.12 | 45d | 1 | 1.49mi |
Listing history 5 events
-
2026-06-21days on market $80,000 Active 6 DOM
-
2026-06-18days on market $80,000 Active 3 DOM
-
2026-06-17days on market $80,000 Active 2 DOM
-
2026-06-16remarks 655-char remark
-
2026-06-16$80,000 Active 1 DOM
ⓘ Source: listings_history table (triggers on properties + properties_extension) + one-shot
backfill from property_details.listing_events for pre-trigger history.
Tax reassessment forecast PA · Partial reset (capped growth)
- Current annual tax
- $2,167 · $181/mo
- Projected year-2 tax
- $2,167 · $181/mo
- Expected delta
- $0/yr ($0/mo · 0.0%)
ⓘ Screening estimate from a state-policy table — verify with the county assessor before closing.
Climate risk First Street
- Flood 1/10 Low FEMA zone X (unshaded) · 0% chance over 30 yrs
- Wildfire 1/10 Low
- Heat 4/10 Moderate 7 d/yr ≥96°F today · 18 d/yr by 30 yrs out
- Wind 2/10 Low
- Air quality 5/10 Major 8 unhealthy d/yr today · 8 by 30 yrs out
Nearby sold comps map
Loading sold comps map…
Walkable amenities ~0.75 mi
Loading nearby amenities…
Taxation est. · year 1
- Rental income
- $14,781
- − Mortgage interest
- −$4,481
- − Property taxes
- −$2,167
- − Insurance
- −$400
- − Repairs & maintenance
- −$1,182
- − Management
- −$1,182
- − Depreciation
- −$2,327
- Taxable income
- $3,041
- Est. tax owed @ 24.0%
- −$730
- After-tax cash flow
- $3,346/yr
For passive investors: Depreciation is non-cash, so a rental often shows a tax loss while cash-flowing — sheltering income. Rental losses are passive: they offset passive income freely, and up to $25,000/yr can offset ordinary (W-2) income if you actively participate and your MAGI is under $100k (phasing out to $0 by $150k); unused losses carry forward. On sale, claimed depreciation is recaptured at up to 25%, and gains may owe capital-gains tax (a 1031 exchange can defer both). Figures are a year-1 estimate at your 24.0% rate — not tax advice; consult a CPA.
Schools (NCES district)
- District
- Clairton City SD
- NCES district ID
- 4206030
- Math proficiency
- 7% ▼ -11.00%
- Reading proficiency
- 21% ▼ -12.00%
- Median HH income
- $30,250
- Composite
- 11.0/100
- National rank
- #9742
- State rank
- #520 of 539 in PA
Livability — Clairton
- Score
- 63/100
- State rank
- #1308
- US rank
- #16085
Category grades
Schools grade is shown separately in the Schools card above.
Census & demographics
- Census place
- Clairton, PA
- County
- Allegheny County · 1,022,028 people
- City population
- 16,939
- Metro
- Pittsburgh, PA
- Population (ZIP)
- 16,939
- Household income
- $76,531
- Rent vs Own
- Severe rent burden
- 572.0
Population outlook (Allegheny County) Hauer SSP2
- Today (2025)
- 1,250,282 people
- By 2030
- 1,256,482 · +0.5%
- By 2040
- 1,256,318 · +0.5%
- By 2050
- 1,244,169 · -0.5%
- By 2075
- 1,197,693 · -4.2%
- By 2100
- 1,093,187 · -12.6%
Race, ethnicity, and origin ACS 2023
- Neighborhood character
- Predominantly White (74%)
- Race & ethnicity
- White 74% Black 18% Two or more races 4% Asian 2% Hispanic / Latino 2%
- Common ancestry
- Romanian 6% Lithuanian 2% Slovak 1%
- Foreign-born
- 4% · China, Canada, India
- Languages at home
- 96% English-only · Other Indo-European 1% Chinese 1% Spanish 1%
Political lean MEDSL · Allegheny
- 2024 margin
- Strong D (+20.3) · D 59.7% · R 39.4%
- 2008→2024 swing
- +4.8pp toward D · 2008: 15.5pp · 2024: 20.3pp
- All cycles
- 2024: D+20.3 2020: D+20.4 2016: D+16.4 2012: D+14.4 2008: D+15.5
Not yet ingested
- Civics
- —
Market trends
- HPI YoY
- ▼ -96.35%
- Current HPI
- 183.858
- Rent YoY
- ▲ 10.47%
- Metro
- Pittsburgh, PA
- State GDP YoY
- ▲ 1.68%
- F500 in state
- 34
Industry mix (Fortune 500 HQ in PA)
| Industry | F500 HQs | Revenue |
|---|---|---|
| Healthcare | 2 | $309B |
|
||
| Insurance | 2 | $27B |
|
||
| Telecommunications / Media | 1 | $124B |
|
||
| Industrial Distribution | 1 | $22B |
|
||
| Financial Services | 1 | $20B |
|
||
| Chemicals / Materials | 1 | $18B |
|
||
Price history
+110.5% since first listed18 events — show timeline
- 2026-06-11 Listed $80,000 West Penn MLS
- 2024-05-22 Contingent — West Penn MLS
- 2024-05-16 Relisted — West Penn MLS
- 2024-04-19 Contingent — West Penn MLS
- 2024-04-17 Listed $109,995 West Penn MLS
- 2020-10-26 Sold (Public Records) $64,900 Public Records
- 2020-10-19 Sold (MLS) $64,900 West Penn MLS
- 2020-10-02 Pending — West Penn MLS
- 2020-08-28 Listed $64,900 West Penn MLS
- 2016-10-17 Delisted — West Penn MLS
- 2016-09-10 Price Changed $49,900 West Penn MLS
- 2016-08-24 Price Changed $54,900 West Penn MLS
- 2016-07-27 Listed $59,900 West Penn MLS
- 2003-07-08 Sold (Public Records) $55,000 Public Records
- 2003-07-01 Sold (MLS) $55,000 West Penn MLS
- 2003-05-05 Listed $58,500 West Penn MLS
- 1995-04-07 Sold (Public Records) $45,000 Public Records
- 1985-09-25 Sold (Public Records) $38,000 Public Records
Property tax history
+12.7%/yrLatest (2026): $2,167 · +11.0% YoY. Source: county tax records.
Cash-flow waterfall
monthlySold comps — $/sqft
last 12 mo · ≤1 miLoading sold comps…