900 Tallwood Ave #306 · Hollywood, FL
Flood risk No data
- FEMA flood zone
- —
- Chance of flooding over 30 yrs
- —
- Est. flood insurance / yr
- —
Fire risk No data
- Est. fire insurance / yr
- —
Heat risk No data
- Hot days now (above threshold)
- —
- Hot days in 30 yrs
- —
Wind risk No data
- Chance of severe wind over 30 yrs
- —
Air-quality risk No data
- Unhealthy air days now
- —
- Unhealthy air days in 30 yrs
- —
Risk factors via First Street. Map © Google.
Why this score? — see what drove the D grade
The composite is a weighted blend of 9 inputs, each scored 0–100. Each bar is that input's sub-score; the figure is the points it added to the 100-point composite (weight × sub-score).
- Cash flow +9.1/30.0
- 1% rule +7.8/10.0
- ARV discount +7.5/15.0
- Schools +4.1/10.0
- Livability +3.8/5.0
- Rent growth +3.1/5.0
- DSCR +2.5/10.0
- Condition / age +2.5/5.0
- Appreciation +0.0/10.0
$130,000
🖨 Deal sheet 📄 Offer letter ✓ Due diligence
Listing remarks
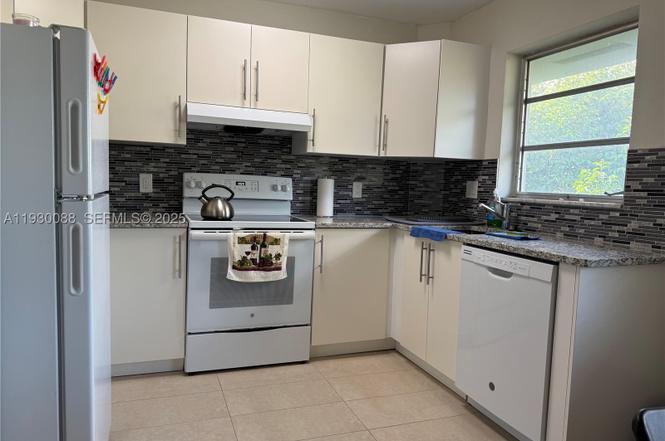
SPACIOUS UPDATED CONDO ON THE THIRD FLOOR IN THE HEART OF WEST HOLLYWOOD ON WASHINGTON STREET AND TALLWOOD AVE. CLOSE TO BOTH TURNPIKE & I-95. UPGRADED BATHROOM AND KITCHEN WITH NEWER APPLIANCES AND BACKSPLASH. LAMINATE WOOD FLOORING THROUGHOUT, EXCEPT FOR KITCHEN AND BATHROOM. BUILDING WENT THROUGH RECERTIFICATION. NEW A/C TOWER, NEW PAINT, NEW ROOF. WELL-MAINTAINED BUILDING IN QUIET NEIGHBORHOOD. LOCATED NEAR RETAIL, POST OFFICE & BANKS. CLOSE TO MEMORIAL REGIONAL & MEMORIAL SOUTH HOSPITALS. NO AGE RESTRICTIONS. NO LEASE FIRST YEAR. ONE PARKING SPOT. ASSOCIATION HAS 10% RESERVES FOR FINANCING.
Key facts
- Upgraded bathroom
- New a/c tower
- Updated condo
Tags
Property features AI
Finance
- Financial info: Pets not allowed
- HOA & community: Monthly HOA fee of $445; HOA covers association management, common areas, insurance, laundry, grounds maintenance, structure maintenance, reserve fund, sewer, trash and water; Community amenities include elevator(s), laundry and storage
Exterior
- Parking: Assigned detached parking (1 space); 1 covered parking space; 1-car garage
- Utilities: Central air (cooling)
- Home design: Attached property; Single-story unit within a 3-story building; Entry on level 3
- Construction: Block construction; Effective year built
- Exterior features: No notable exterior features listed; Exterior lighting
Interior
- Kitchen: Dishwasher; Electric range; Self-cleaning oven; Refrigerator
- Bedrooms: Bedroom on main level
- Flooring: Laminate flooring; Tile flooring
- Bathrooms: 1 full bathroom
- Heating & cooling: Central air conditioning
- Interior features: Furnishing negotiable; First floor entry; Living/dining room
- Laundry & utility: Common area laundry
Neighborhood map
What this means for you Summary
Snapshot
- This is a 1-bed/1.0-bath condo listed at $130k.
Deal economics
- At list price, monthly cash flow is $-99 ($-1k/yr) — negative.
- To cash-flow at today's rent, offer at most $113k (13.5% below list).
- Meets the 1% rule at list price ($2k rent vs $130k).
- Recommended offer: $113k (13.5% below list) — sets the bar for cash-flow.
- Cap rate 5.4% vs local median 3.2% in Hollywood — top-decile yield for the area; either an underpriced asset or a hidden risk that comps aren't pricing in. Stress-test before assuming the spread holds.
Location & tenants
- Location reads 76/100 on livability (#232 in FL, #3,548 nationally) — a middle-class / working-renter tenant base. Strengths: commute A+, housing A+, crime B+; Watch: amenities D.
- Broward (suburban): math 42% / reading 53% proficiency, ranked #46 of 73 in FL (top 63%) — families likely to look elsewhere, expect single-tenant / working-renter base with shorter leases.
- Market conditions: Rents rising (+2.4%/yr); 529 active listings in the ZIP; 40 comparable units currently listed for rent nearby; rentals at typical pace (median 16d on market — plan ~3-4 weeks tenant-placement turnaround); 2,111 units permitted in Broward County in 2024 (1,265 in 5+ unit buildings).
Forward outlook
- Local home prices are declining (-3.0%/yr); year-one equity from $899 of loan paydown is wiped out by about $4k of value loss. Plan a longer hold.
- Broward County population projected at +34% by 2050 — long-run rental-demand tailwind backs the buy-and-hold thesis.
Negotiation context
- It's been on market 159 days — a 12% lower offer ($114k) is reasonable based on typical stale-listing flexibility.
- 3 sale attempts since 9y ago with the ask held roughly flat each time — persistent listings suggest the price (not the market) is what's stuck; bring a comps-based counter.
- Current owner paid $95k; 37% above their basis — modest negotiation headroom, anchor on the comps not their cost.
Risks & watch-outs
- Watch-outs: HOA is 27% of rent.
Questions for the listing agent
- What do current leases actually rent for vs. the listed asking? Can we see a recent rent roll and the last 12 months of T-12 income?
- It's been on market 159 days. Have you received any prior offers? Is the seller open to a 13% concession, seller financing, or rate buy-down credit?
- Built in 1967 — when were the roof, HVAC, electrical panel, plumbing, and water heater last replaced?
- What does the HOA fee cover, when was the last increase, and are there any pending special assessments or reserve-fund shortfalls?
- Any open or pending special assessments — roof, HVAC, plumbing, elevator, façade? What's the per-unit balance and payoff schedule, and is the seller paying it off at close or rolling it to the buyer?
- Why hasn't it sold? Are there any deal-killer items the seller is aware of (foundation, flood, title, zoning, code violations)?
- Is there a deadline driving the sale (1031 exchange, divorce, estate, relocation)? That informs how much negotiation room exists.
- The area grade is low — what's the realistic commute time and amenity access for the typical tenant pool here? Any planned neighborhood developments (good or bad) we should know about?
- What's the average days-on-market for RENTAL listings here right now (not sales)? A rising rental-DOM trend means longer vacancies and softer asking-rent achievability than the comps imply.
- What's the recent tenant-quality profile in this submarket — average credit score on applications, eviction rate, late-payment / NSF rate, and stable-employment percentage? A property-management company in the area should have these aggregated.
- How much new apartment / multifamily construction is in the pipeline within 1–3 miles? Heavy new supply (>2% of stock underway) typically softens rents 12–24 months out; light construction supports rent growth.
Investment metrics
- 1% rule
- 1.28% ✓
- Cap rate
- 5.38%
- Cash-on-cash
- -3.26%
- DSCR
- 0.85
- GRM
- 6.5
CMA / ARV
No comps found within radius.
Projected returns pro-forma
-3.0% appreciation · 2.41% rent growth · sell at horizon
- IRR
- -22.5%
- Equity multiple
- 0.23×
- Total profit
- $-28,012
- Equity at exit
- $19,383
- IRR
- -18.3%
- Equity multiple
- 0.04×
- Total profit
- $-35,107
- Equity at exit
- $11,240
Cash invested: $36,400 (down + closing). Projections, not guarantees.
Landlord ↔ Tenant lean methodology
- Overall (STATE)
- 87 Strongly Landlord-Friendly
- State Florida
- 87 Strongly Landlord-Friendly · R+3
- County
- — inherits STATE
- City
- — inherits STATE
ZIP-level market 33021
- Rents YoY
- 2.4%
- Active inventory
- 529
- Price-to-rent
- 6.5×
Monthly cashflow live
- Estimated rent
- $1,664 high interval (Pro) →
- Mortgage (P&I)
- −$682
- Tax from tax record
- −$232 /mo · $2,788/yr
- Insurance
- −$54
- HOA
- −$445
- Vacancy / Maint / Mgmt
- −$349
- Net cashflow
- $-99
Break-even live
UW: 25.0% down · 7.5% · 30yr · 1.5% tax · 5.0% vac · 8.0% maint · 8.0% mgmt
Financing live
Cash to close
- Down payment
- $32,500
- Closing costs
- $3,900
- Reserves months
- —
- Total cash needed
- —
Loan-product check · same deal, 3 products live
Conventional
25% down · 7.5% · 30yr
- Down + closing
- —
- Monthly P&I
- —
- Monthly cashflow
- —
- DSCR
- —
- Eligible?
- —
Personal DTI + credit; lowest rate.
DSCR
20% down · 8.5% · 30yr
- Down + closing
- —
- Monthly P&I
- —
- Monthly cashflow
- —
- DSCR
- —
- Eligible?
- —
No personal income docs; deal must DSCR.
Hard money
10% down · 12.0% · 12mo
- Down + closing
- —
- Monthly P&I
- —
- Monthly cashflow
- —
- DSCR
- —
- Eligible?
- —
Short-term bridge; refi at stabilization.
Rent comps 40 comps
| Address | Beds | Baths | Sqft | Rent | $/sqft | DOM | Units | Dist |
|---|---|---|---|---|---|---|---|---|
| 900 Tallwood Ave #207 Hollywood, FL | 1.0 | 1.0 | 640 | $1,575 | $2.46 | 20d | 1 | 0.04mi |
| 4917 Washington St Hollywood, FL | 1.0 | 1.0 | 600 | $1,300 | $2.17 | 7d | 1 | 0.37mi |
| 532 S Crescent Dr Unit 106 Hollywood, FL | — | 1.0 | 550 | $1,425 | $2.59 | 14d | 1 | 0.47mi |
| 315 S Crescent Dr Hollywood, FL | — | 1.0 | 544 | $1,425 | $2.62 | 15d | 1 | 0.53mi |
| 3711 Van Buren St #2 Hollywood, FL | 1.0 | 1.0 | 660 | $1,550 | $2.35 | 24d | 1 | 0.61mi |
| 4130 SW 19th St Unit 3 West Park, FL | 1.0 | 1.0 | 450 | $1,400 | $3.11 | 20d | 1 | 0.61mi |
| 812 S Park Rd Hollywood, FL | 1.0–3.0 | 1.0–2.0 | 999 | $1,869 | $1.87 | 2d | 24 | 0.65mi |
| 3601 Van Buren St Hollywood, FL | 1.0–2.0 | 1.0–2.0 | 941 | $1,725 | $1.83 | 3d | 3 | 0.65mi |
| 550 S Park Rd Unit 14-8 Hollywood, FL | 1.0 | 1.0 | 650 | $1,750 | $2.69 | 7d | 1 | 0.69mi |
| 470 S Park Rd Unit 7-110 Hollywood, FL | 1.0 | 1.0 | 659 | $1,800 | $2.73 | 24d | 1 | 0.70mi |
| 5500 Washington St Hollywood, FL | 1.0–3.0 | 1.0–2.0 | 1000 | $1,590 | $1.59 | 3d | 18 | 0.70mi |
| 4933 Hollywood Blvd Unit 5141-206 Hollywood, FL | 1.0 | 1.0 | 650 | $1,750 | $2.69 | 24d | 1 | 0.72mi |
| 4933 Hollywood Blvd Unit 5420-202 Hollywood, FL | 1.0 | 1.0 | 650 | $1,750 | $2.69 | 22d | 1 | 0.72mi |
| 5112 Hollywood Blvd #3 Hollywood, FL | 1.0 | 1.0 | 650 | $1,550 | $2.38 | 17d | 1 | 0.75mi |
| 5112 Hollywood Blvd Hollywood, FL | 1.0–2.0 | 1.0 | 727 | $1,600 | $2.20 | 19d | 2 | 0.75mi |
| 5141 Hollywood Blvd Unit 209 Hollywood, FL | 2.0 | 1.0 | 700 | $2,175 | $3.11 | 3d | 1 | 0.79mi |
| 5141 Hollywood Blvd Apt 206 Hollywood, FL | 1.0 | 1.0 | 700 | $1,825 | $2.61 | 3d | 1 | 0.80mi |
| 5230 Hollywood Blvd Hollywood, FL | 1.0–4.0 | 1.0–2.0 | 956 | $1,500 | $1.57 | 24d | 1 | 0.80mi |
| 3525 Polk St #7 Hollywood, FL | 1.0 | 1.0 | 700 | $1,600 | $2.29 | 24d | 1 | 0.86mi |
| 5420 Hollywood Blvd Unit 208 Hollywood, FL | 1.0 | 1.0 | 700 | $1,775 | $2.54 | 4d | 1 | 0.88mi |
| 5420 Hollywood Blvd Unit 208 Hollywood, FL | 1.0 | 1.0 | 700 | $1,775 | $2.54 | 3d | 1 | 0.88mi |
| 5401 SW 20th St Unit B West Park, FL | 1.0 | 1.0 | 600 | $1,500 | $2.50 | 24d | 1 | 0.90mi |
| 5685 Flagler St Unit 2 Hollywood, FL | 2.0 | 1.0 | 420 | $1,900 | $4.52 | 14d | 1 | 0.92mi |
| 5685 Flagler St Unit 2 Hollywood, FL | 2.0 | 1.0 | 420 | $1,900 | $4.52 | 3d | 1 | 0.92mi |
| 5821 Washington St Hollywood, FL | 1.0 | 1.0 | 650 | $1,775 | $2.73 | 24d | 2 | 0.96mi |
| 5835 Washington St #52 Hollywood, FL | 1.0 | 1.0 | 650 | $1,625 | $2.50 | 11d | 1 | 0.99mi |
| 5835 Washington St #52 Hollywood, FL | 1.0 | 1.0 | 650 | $1,600 | $2.46 | 5d | 1 | 0.99mi |
| 5901 Washington St #247 Hollywood, FL | 1.0 | 1.0 | 650 | $1,650 | $2.54 | 7d | 1 | 1.01mi |
| 5901 Washington St #247 Hollywood, FL | 1.0 | 1.0 | 650 | $1,600 | $2.46 | 24d | 1 | 1.01mi |
| 5740 Mayo St #4 Hollywood, FL | 2.0 | 1.0 | 550 | $1,895 | $3.45 | 24d | 1 | 1.01mi |
| 5981 Washington St #219 Hollywood, FL | 1.0 | 1.0 | 450 | $1,500 | $3.33 | 24d | 1 | 1.08mi |
| 5849 Wiley St Hollywood, FL | 1.0 | 1.0 | 350 | $1,475 | $4.21 | 24d | 1 | 1.15mi |
| 5931 Wiley St Unit 5931 Hollywood, FL | 1.0 | 1.0 | 650 | $1,600 | $2.46 | 24d | 1 | 1.22mi |
| 504 N 57th Ave Unit N Hollywood, FL | 1.0 | 1.0 | 496 | $1,575 | $3.18 | 20d | 1 | 1.26mi |
| 5819 Polk St Unit 4 Hollywood, FL | 1.0 | 1.0 | 602 | $1,425 | $2.37 | 15d | 1 | 1.31mi |
| 5819 Polk St Apt 2 Hollywood, FL | 1.0 | 1.0 | 682 | $1,559 | $2.29 | 7d | 1 | 1.31mi |
| 2915 Plunkett St Unit 10D Hollywood, FL | 1.0 | 1.0 | 640 | $1,700 | $2.66 | 17d | 1 | 1.32mi |
| 2918 Jackson St Hollywood, FL | 2.0 | 1.0 | 750 | $1,700 | $2.27 | 4d | 1 | 1.38mi |
| 2918 Jackson St Unit 1 Hollywood, FL | 2.0 | 1.0 | 750 | $1,700 | $2.27 | 7d | 1 | 1.38mi |
| 5807 SW 25th St West Park, FL | — | 1.0 | 500 | $1,495 | $2.99 | 7d | 1 | 1.39mi |
HOA detail condo
- Monthly dues
- $445 · $5,340/yr
- Assessments
- None detected in remarks — confirm with the listing agent.
Listing history 10 events
-
2026-05-22status Pending
-
2026-04-27historical Active Under Contract
-
2026-02-13status Active
-
2026-01-31historical Active Under Contract
-
2025-12-14$130,000 Active
-
2020-01-09soldstatus $95,000
-
2018-02-22soldstatus $52,000
-
2017-06-23historical
-
2017-05-04$59,900
-
1998-09-10soldstatus $27,000
ⓘ Source: listings_history table (triggers on properties + properties_extension) + one-shot
backfill from property_details.listing_events for pre-trigger history.
Tax reassessment forecast FL · Resets to sale price
- Current annual tax
- $2,788 · $232/mo
- Projected year-2 tax
- $2,788 · $232/mo
- Expected delta
- $0/yr ($0/mo · 0.0%)
ⓘ Screening estimate from a state-policy table — verify with the county assessor before closing.
Nearby sold comps map
Loading sold comps map…
Walkable amenities ~0.75 mi
Loading nearby amenities…
Taxation est. · year 1
- Rental income
- $19,963
- − Mortgage interest
- −$7,282
- − Property taxes
- −$2,788
- − Insurance
- −$650
- − Repairs & maintenance
- −$1,597
- − Management
- −$1,597
- − HOA
- −$5,340
- − Depreciation
- −$3,782
- Taxable loss
- −$3,073
- Est. tax savings @ 24.0%
- +$738
- After-tax cash flow
- $-451/yr
For passive investors: Depreciation is non-cash, so a rental often shows a tax loss while cash-flowing — sheltering income. Rental losses are passive: they offset passive income freely, and up to $25,000/yr can offset ordinary (W-2) income if you actively participate and your MAGI is under $100k (phasing out to $0 by $150k); unused losses carry forward. On sale, claimed depreciation is recaptured at up to 25%, and gains may owe capital-gains tax (a 1031 exchange can defer both). Figures are a year-1 estimate at your 24.0% rate — not tax advice; consult a CPA.
Schools (NCES district)
- District
- Broward
- NCES district ID
- 1200180
- Math proficiency
- 42% ▼ -18.00%
- Reading proficiency
- 53% ▼ -5.00%
- Median HH income
- $52,139
- Composite
- 40.88/100
- National rank
- #3621
- State rank
- #46 of 73 in FL
Livability — Hollywood
- Score
- 76/100
- State rank
- #232
- US rank
- #3548
Category grades
Schools grade is shown separately in the Schools card above.
Census & demographics
- Census place
- Hollywood, FL
- County
- Broward County · 1,963,430 people
- City population
- 109,079
- Metro
- Miami-Fort Lauderdale-Pompano Beach, FL
- Population (ZIP)
- 48,464
- Household income
- $71,318
- Rent vs Own
- Severe rent burden
- 2151.0
Population outlook (Broward County) Hauer SSP2
- Today (2025)
- 2,207,033 people
- By 2030
- 2,360,704 · +7.0%
- By 2040
- 2,661,208 · +20.6%
- By 2050
- 2,946,698 · +33.5%
- By 2075
- 3,602,273 · +63.2%
- By 2100
- 3,970,984 · +79.9%
Race, ethnicity, and origin ACS 2023
- Neighborhood character
- Diverse neighborhood (Simpson 0.65)
- Race & ethnicity
- White 45% Hispanic / Latino 37% Two or more races 17% Black 13% Asian 3%
- Hispanic origin (detail)
- Puerto Rican 5% Cuban 10% Dominican 2%
- Common ancestry
- Romanian 3% Scotch-Irish 2% Hispanic 2%
- Foreign-born
- 35% · Canada, Jamaica, Dominican Republic
- Languages at home
- 53% English-only · Spanish 33% French/Haitian/Cajun 4% Russian/Polish/Slavic 2%
Political lean MEDSL · Broward
- 2024 margin
- D (+17.0) · D 58.0% · R 41.0%
- 2008→2024 swing
- -17.8pp toward R · 2008: 34.7pp · 2024: 17.0pp
- All cycles
- 2024: D+17.0 2020: D+29.8 2016: D+35.0 2012: D+34.9 2008: D+34.7
Not yet ingested
- Civics
- —
Market trends
- HPI YoY
- ▼ -404.28%
- Current HPI
- 429.7129
- Rent YoY
- ▲ 2.41%
- Metro
- Miami-Fort Lauderdale-Pompano Beach, FL
- State GDP YoY
- ▲ 3.28%
- F500 in state
- 36
Industry mix (Fortune 500 HQ in FL)
| Industry | F500 HQs | Revenue |
|---|---|---|
| Industrial Technology | 2 | $29B |
|
||
| Insurance | 2 | $17B |
|
||
| Retail | 1 | $60B |
|
||
| Technology Distribution | 1 | $58B |
|
||
| Homebuilding | 1 | $35B |
|
||
| Technology Manufacturing | 1 | $35B |
|
||
Price history
+381.5% since first listed10 events — show timeline
- 2026-05-22 Pending — MARMLS
- 2026-04-27 Contingent — MARMLS
- 2026-02-13 Relisted — MARMLS
- 2026-01-31 Contingent — MARMLS
- 2025-12-14 Listed $130,000 MARMLS
- 2020-01-09 Sold (Public Records) $95,000 Public Records
- 2018-02-22 Sold (Public Records) $52,000 Public Records
- 2017-06-23 Listing Removed — Stellar MLS as Distributed by MLS Grid
- 2017-05-04 Listed $59,900 Stellar MLS as Distributed by MLS Grid
- 1998-09-10 Sold (Public Records) $27,000 Public Records
Property tax history
+21.2%/yrLatest (2025): $2,788 · +2.8% YoY. Source: county tax records.
Cash-flow waterfall
monthlySold comps — $/sqft
last 12 mo · ≤1 miLoading sold comps…