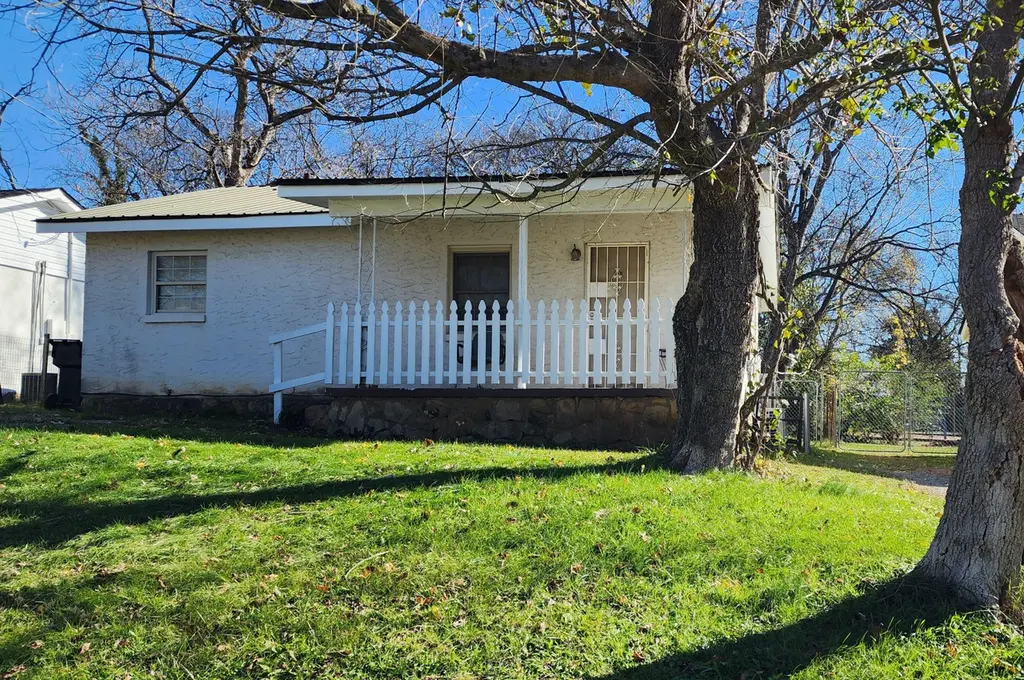
3314 Tarlton Ave · Chattanooga, TN
Flood risk 8/10 · Major
- FEMA flood zone
- X (unshaded)
- Chance of flooding over 30 yrs
- 0.78%
- Est. flood insurance / yr
- $507 – $1,088
Fire risk 3/10 · Minor
- Est. fire insurance / yr
- $949 – $1,763
Heat risk 6/10 · Moderate
- Hot days now (above 106°F)
- 7 days/yr
- Hot days in 30 yrs
- 21 days/yr
Wind risk 4/10 · Minor
- Chance of severe wind over 30 yrs
- 11.0%
Air-quality risk 3/10 · Minor
- Unhealthy air days now
- 2 days/yr
- Unhealthy air days in 30 yrs
- 2 days/yr
Risk factors via First Street. Map © Google.
Why this score? — see what drove the B+ grade
The composite is a weighted blend of 9 inputs, each scored 0–100. Each bar is that input's sub-score; the figure is the points it added to the 100-point composite (weight × sub-score).
- Cash flow +29.2/30.0
- ARV discount +15.0/15.0
- DSCR +10.0/10.0
- 1% rule +6.8/10.0
- Appreciation +5.7/10.0
- Livability +3.9/5.0
- Schools +2.7/10.0
- Rent growth +2.5/5.0
- Condition / age +2.5/5.0
$125,000
🖨 Deal sheet (PDF) 📄 Offer letter ✓ Due diligence
Listing remarks
For comps only
Key facts
- 5,662 sq ft lot
- Built 1950
Neighborhood map
What this means for you Summary
Snapshot
- This is a 2-bed/1.0-bath single-family listed at $125k.
Deal economics
- At list price, monthly cash flow is $371 ($4k/yr) — positive.
- The deal already cash-flows at list — no discount required.
- Meets the 1% rule at list price ($1k rent vs $125k).
- Cap rate 10.5% vs local median 3.4% in Chattanooga — top-decile yield for the area; either an underpriced asset or a hidden risk that comps aren't pricing in. Stress-test before assuming the spread holds.
Location & tenants
- Location reads 78/100 on livability (#3 in TN, #2,582 nationally) — a middle-class / working-renter tenant base. Strengths: amenities A+, commute A+, cost of living A+; Watch: employment D+, crime F.
- Hamilton County (urban): math 31% / reading 31% proficiency, ranked #42 of 139 in TN (top 30%) — families likely to look elsewhere, expect single-tenant / working-renter base with shorter leases.
- Zoned schools: Battle Academy For Teaching Learning (math 42% / reading 42%, grade F, #191 of 952 statewide, top 22%, 487 students, 0% FRL); Orchard Knob Middle (math 5% / reading 6%, grade F, #291 of 333 statewide, top 88%, 334 students, 0% FRL); The Howard School (math 3% / reading 8%, grade F, #309 of 332 statewide, top 93%, 1,485 students, 0% FRL) — zoned schools average 0% FRL vs 52% district-wide (52 pts lower); this property's tenant base skews higher-income than the district average.
- Zoned-school proficiency averages 18% at this address vs 31% district-wide (-13 pts) — the specific schools serving this property underperform the Hamilton County average; the district grade overstates school quality for this exact location.
- Market conditions: 62 active listings in the ZIP; 20 comparable units currently listed for rent nearby; rentals at typical pace (median 26d on market — plan ~3-4 weeks tenant-placement turnaround); lower-income renter base — watch delinquency; 2,133 units permitted in Hamilton County in 2024 (405 in 5+ unit buildings).
- At $1,478/mo this rent would consume 62% of the median local household income ($29k/yr) (locally 406% of renters already pay >50% of income on rent) — very limited rent-growth headroom before tenants either downsize or default.
Forward outlook
- In year one you build about $3k of equity ($864 loan paydown + $2k appreciation (1.3% local appreciation)).
- Hamilton County population projected at +23% by 2050 — long-run rental-demand tailwind backs the buy-and-hold thesis.
- At projected returns (1.3% appreciation + 3.0% rent growth), your $35k cash investment doubles in ~5 years — after that, you're playing with house money.
Negotiation context
- Only 0 days on market — expect competitive offers; lowballing is unlikely to land.
- Current owner paid $36k; list at $125k implies a 247% gain — meaningful room to come down on a strong offer.
Risks & watch-outs
- Watch-outs: flood insurance adds $66/mo; built in 1950 — expect roof / HVAC / electrical / plumbing capex.
- Climate carrying-cost: severe flood risk; extreme-heat days projected 7→21/yr by 2055 (HVAC capex compounding) — expect insurance premiums to compound above CPI over the hold.
Questions for the listing agent
- Built in 1950 — when were the roof, HVAC, electrical panel, plumbing, and water heater last replaced?
- What's the actual annual flood-insurance premium (NFIP or private), and is the property in a SFHA with mandatory coverage?
- Is there a deadline driving the sale (1031 exchange, divorce, estate, relocation)? That informs how much negotiation room exists.
- Schools are F-rated, which usually means shorter tenancies and higher turnover. Who's the typical renter profile here, and what's been the actual vacancy rate?
- Crime grade is F in this area — have there been break-ins, vandalism, or insurance claims at this property in the last 3 years? What carrier currently insures it and at what premium?
- What's the average days-on-market for RENTAL listings here right now (not sales)? A rising rental-DOM trend means longer vacancies and softer asking-rent achievability than the comps imply.
- What's the recent tenant-quality profile in this submarket — average credit score on applications, eviction rate, late-payment / NSF rate, and stable-employment percentage? A property-management company in the area should have these aggregated.
- How much new for-sale + rental construction is in the pipeline within 1–3 miles? Heavy new supply typically softens prices + rents 12–24 months out; constrained supply supports both.
Investment metrics
- 1% rule
- 1.18% ✓
- Cap rate
- 10.49%
- Cash-on-cash
- 14.98%
- DSCR
- 1.67
- GRM
- 7.0
CMA / ARV
- ARV (on-the-fly)
- $153,600
- Comps found
- 1
Show comp detail 1 sale within ~0.75 mi
| Address | Dist | Beds/Ba | Sqft | Sold | Price | $/sf | Match |
|---|---|---|---|---|---|---|---|
| 1513 Mountain View Ct | 0.46mi | 3/1.0 (+1) | 832 (+4%) | 10mo | $160,000 | $192 | 58 |
Match score weights: distance 35% · size 25% · config 20% · recency 20%. Top-matched comps best support the ARV.
Projected returns pro-forma
1.33% appreciation · 3.0% rent growth · sell at horizon
- IRR
- 15.4%
- Equity multiple
- 1.80×
- Total profit
- $27,971
- Equity at exit
- $44,856
- IRR
- 18.5%
- Equity multiple
- 3.31×
- Total profit
- $80,705
- Equity at exit
- $61,337
Cash invested: $35,000 (down + closing). Projections, not guarantees.
Landlord ↔ Tenant lean methodology
- Overall (STATE)
- 87 Strongly Landlord-Friendly
- State Tennessee
- 87 Strongly Landlord-Friendly · R+13
- County
- — inherits STATE
- City
- — inherits STATE
ZIP-level market 37410
- Home prices YoY
- 0.6%
- Active inventory
- 62
- Price-to-rent
- 7.0×
Monthly cashflow live
- Estimated rent
- $1,478 high interval (Pro) →
- Mortgage (P&I)
- −$656
- Tax from tax record
- −$23 /mo · $272/yr
- Insurance
- −$52
- Flood insurance flood zone
- −$66 /mo · $798/yr
- HOA
- −$0
- Vacancy / Maint / Mgmt
- −$310
- Net cashflow
- $371
Break-even live
Sensitivity live
| Price | -10% $441 | -5% $406 | +0% $371 | +5% $335 | +10% $151 |
|---|---|---|---|---|---|
| Rent | -10% $254 | -5% $312 | +0% $371 | +5% $429 | +10% $487 |
| Rate | -1.0pp $433 | -0.5pp $402 | base $371 | +0.5pp $338 | +1.0pp $305 |
UW: 25.0% down · 7.5% · 30yr · 1.5% tax · 5.0% vac · 8.0% maint · 8.0% mgmt
Financing live
Cash to close
- Down payment
- $31,250
- Closing costs
- $3,750
- Reserves months
- —
- Total cash needed
- —
Loan-product check · same deal, 3 products live
Conventional
25% down · 7.5% · 30yr
- Down + closing
- —
- Monthly P&I
- —
- Monthly cashflow
- —
- DSCR
- —
- Eligible?
- —
Personal DTI + credit; lowest rate.
DSCR
20% down · 8.5% · 30yr
- Down + closing
- —
- Monthly P&I
- —
- Monthly cashflow
- —
- DSCR
- —
- Eligible?
- —
No personal income docs; deal must DSCR.
Hard money
10% down · 12.0% · 12mo
- Down + closing
- —
- Monthly P&I
- —
- Monthly cashflow
- —
- DSCR
- —
- Eligible?
- —
Short-term bridge; refi at stabilization.
Rent comps 20 comps
| Address | Beds | Baths | Sqft | Rent | $/sqft | DOM | Units | Dist |
|---|---|---|---|---|---|---|---|---|
| 1133 Bexley Sq Chattanooga, TN | 3.0 | 1.0–2.0 | 913 | $2,134 | $2.34 | 16d | 22 | 0.15mi |
| 3609 Carl White Pl Chattanooga, TN | 2.0 | 1.0 | 1100 | $799 | $0.73 | 25d | 1 | 0.28mi |
| 3059 Saint Elmo Ave Chattanooga, TN | 1.0 | 2.0 | 1104 | $1,450 | $1.31 | 25d | 1 | 0.52mi |
| 3818 Chandler Ave Chattanooga, TN | 2.0 | 1.5 | 900 | $1,450 | $1.61 | 16d | 1 | 0.63mi |
| 3603 Dorris St Chattanooga, TN | 2.0 | 1.0 | 700 | $825 | $1.18 | 25d | 1 | 0.75mi |
| 3605 Dorris St Chattanooga, TN | 2.0 | 1.0 | 700 | $825 | $1.18 | 25d | 1 | 0.75mi |
| 3713 Dorris St Chattanooga, TN | 3.0 | 1.0 | 974 | $1,025 | $1.05 | 16d | 1 | 0.79mi |
| 2605 Carr St Apt A Chattanooga, TN | 2.0 | 1.0 | 850 | $1,600 | $1.88 | 25d | 1 | 0.81mi |
| 245 W 26th St Chattanooga, TN | 1.0 | 1.0 | 750 | $1,285 | $1.71 | 16d | 21 | 0.86mi |
| 4101 Alabama Ave Unit D Chattanooga, TN | 1.0 | 1.0 | 800 | $800 | $1.00 | 25d | 1 | 0.91mi |
| 4113 Dorris St Apt B Chattanooga, TN | 2.0 | 1.0 | 750 | $950 | $1.27 | 25d | 1 | 0.95mi |
| 706 W 47th St Chattanooga, TN | 2.0 | 1.0 | 680 | $825 | $1.21 | 25d | 1 | 0.96mi |
| 4129 Quinn Adams St Unit 2 Chattanooga, TN | 2.0 | 1.0 | 856 | $1,050 | $1.23 | 25d | 1 | 1.06mi |
| 4521 Balcomb St Chattanooga, TN | 1.0 | 1.0 | 534 | $1,050 | $1.97 | 25d | 1 | 1.27mi |
| 2100 Rossville Ave Chattanooga, TN | 1.0–2.0 | 1.0–2.0 | 1140 | $2,199 | $1.93 | 16d | 13 | 1.34mi |
| 1920 Chestnut St Chattanooga, TN | 1.0–2.0 | 1.0–2.0 | 688 | $1,685 | $2.45 | 16d | 1 | 1.35mi |
| 4905 Central Ave Chattanooga, TN | 2.0–3.0 | 2.0 | 1169 | $556 | $0.48 | 16d | 2 | 1.37mi |
| 1808 Cowart St Chattanooga, TN | 1.0 | 1.0 | 528 | $950 | $1.80 | 16d | 1 | 1.37mi |
| 1711 Read Ave Unit A Chattanooga, TN | 3.0 | 1.5 | 1010 | $1,700 | $1.68 | 23d | 1 | 1.41mi |
| 1701 Broad St Chattanooga, TN | 1.0–2.0 | 1.0–2.0 | 890 | $1,911 | $2.15 | 16d | 15 | 1.46mi |
Listing history 1 events
-
2005-09-12soldstatus $36,000
ⓘ Source: listings_history table (triggers on properties + properties_extension) + one-shot
backfill from property_details.listing_events for pre-trigger history.
Tax reassessment forecast TN · Resets to sale price
- Current annual tax
- $272 · $23/mo
- Projected year-2 tax
- $888 · $74/mo
- Expected delta
- +$615/yr (+$51/mo · 226.2%)
ⓘ Screening estimate from a state-policy table — verify with the county assessor before closing.
Climate risk First Street
- Flood 8/10 Severe FEMA zone X (unshaded) · 78% chance over 30 yrs
- Wildfire 3/10 Moderate
- Heat 6/10 Major 7 d/yr ≥106°F today · 21 d/yr by 30 yrs out
- Wind 4/10 Moderate 11% chance of damaging wind over 30 yrs
- Air quality 3/10 Moderate 2 unhealthy d/yr today · 2 by 30 yrs out
Nearby sold comps map
Loading sold comps map…
Walkable amenities ~0.75 mi
Loading nearby amenities…
Taxation est. · year 1
- Rental income
- $17,731
- − Mortgage interest
- −$7,002
- − Property taxes
- −$272
- − Insurance
- −$1,422
- − Repairs & maintenance
- −$1,418
- − Management
- −$1,418
- − Depreciation
- −$3,636
- Taxable income
- $2,561
- Est. tax owed @ 24.0%
- −$615
- After-tax cash flow
- $3,832/yr
For passive investors: Depreciation is non-cash, so a rental often shows a tax loss while cash-flowing — sheltering income. Rental losses are passive: they offset passive income freely, and up to $25,000/yr can offset ordinary (W-2) income if you actively participate and your MAGI is under $100k (phasing out to $0 by $150k); unused losses carry forward. On sale, claimed depreciation is recaptured at up to 25%, and gains may owe capital-gains tax (a 1031 exchange can defer both). Figures are a year-1 estimate at your 24.0% rate — not tax advice; consult a CPA.
Schools (NCES district)
- District
- Hamilton County
- NCES district ID
- 4701590
- Math proficiency
- 31% ▼ -10.00%
- Reading proficiency
- 31% ▼ -3.00%
- Median HH income
- $47,456
- Composite
- 26.8/100
- National rank
- #7122
- State rank
- #42 of 139 in TN
Livability — Chattanooga
- Score
- 78/100
- State rank
- #3
- US rank
- #2582
Category grades
Schools grade is shown separately in the Schools card above.
Census & demographics
- Census place
- Chattanooga, TN
- County
- Hamilton County · 312,777 people
- City population
- 131,999
- Metro
- Chattanooga, TN-GA
- Population (ZIP)
- 4,129
- Household income
- $28,708
- Rent vs Own
- Severe rent burden
- 406.0
Population outlook (Hamilton County) Hauer SSP2
- Today (2025)
- 393,784 people
- By 2030
- 412,983 · +4.9%
- By 2040
- 449,502 · +14.1%
- By 2050
- 484,341 · +23.0%
- By 2075
- 565,746 · +43.7%
- By 2100
- 618,394 · +57.0%
Race, ethnicity, and origin ACS 2023
- Neighborhood character
- Predominantly Black (81%)
- Race & ethnicity
- Black 81% Two or more races 10% White 8% Hispanic / Latino 7%
- Hispanic origin (detail)
- Mexican 2%
- Common ancestry
- Scotch-Irish 1%
- Foreign-born
- 6% · Canada
- Languages at home
- 94% English-only · Spanish 6%
Political lean MEDSL · Hamilton
- 2024 margin
- R (+13.1) · D 42.7% · R 55.7% · Other 1.6%
- 2008→2024 swing
- -1.2pp toward R · 2008: -11.8pp · 2024: -13.1pp
- All cycles
- 2024: R+13.1 2020: R+9.7 2016: R+16.6 2012: R+14.8 2008: R+11.8
Not yet ingested
- Civics
- —
Market trends
- HPI YoY
- ▲ 1.33%
- Current HPI
- 228.3522
- Rent YoY
- —
- Metro
- Chattanooga, TN-GA
- State GDP YoY
- ▲ 2.78%
- F500 in state
- 22
Industry mix (Fortune 500 HQ in TN)
| Industry | F500 HQs | Revenue |
|---|---|---|
| Healthcare | 3 | $91B |
|
||
| Retail | 3 | $72B |
|
||
| Transportation / Logistics | 1 | $88B |
|
||
| Paper / Packaging | 1 | $19B |
|
||
| Insurance | 1 | $13B |
|
||
| Energy | 1 | $12B |
|
||
Price history
1 event — show timeline
- 2005-09-12 Sold (Public Records) $36,000 Public Records
Property tax history
+3.9%/yrLatest (2025): $272 · +47.4% YoY. Source: county tax records.
Cash-flow waterfall
monthlySold comps — $/sqft
last 12 mo · ≤1 miLoading sold comps…