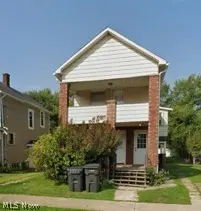
 Duplex
447 Buffalo St · Conneaut, OH
Flood risk 1/10 · Minimal
- FEMA flood zone
- X (unshaded)
- Chance of flooding over 30 yrs
- 0.0%
- Est. flood insurance / yr
- $473 – $860
Fire risk 1/10 · Minimal
- Est. fire insurance / yr
- $713 – $1,323
Heat risk 3/10 · Minor
- Hot days now (above 93°F)
- 7 days/yr
- Hot days in 30 yrs
- 17 days/yr
Wind risk 1/10 · Minimal
- Chance of severe wind over 30 yrs
- —
Air-quality risk 3/10 · Minor
- Unhealthy air days now
- 2 days/yr
- Unhealthy air days in 30 yrs
- 4 days/yr
Risk factors via First Street. Map © Google.
Why this score? — see what drove the B- grade
The composite is a weighted blend of 9 inputs, each scored 0–100. Each bar is that input's sub-score; the figure is the points it added to the 100-point composite (weight × sub-score).
- Cash flow +30.0/30.0
- DSCR +10.0/10.0
- 1% rule +9.8/10.0
- ARV discount +4.1/15.0
- Schools +3.5/10.0
- Livability +3.2/5.0
- Rent growth +2.5/5.0
- Condition / age +2.5/5.0
- Appreciation +0.0/10.0
$134,500
🖨 Deal sheet 📄 Offer letter ✓ Due diligence
Multi-family units
County records classify this as Multi-Family (2-4 Unit). Listing-text estimate: 2 units. confirmed
Listing remarks
4BR 2BA Renovated Up/Down Conneaut Duplex! Make money day one when you purchase this updated, fully occupied and furnished duplex. Current total rents are $2,125/mo. Currently landlord covers all utilities including internet for both units which average $445/mo. Lower unit pays $1050/mo, lease expires 9/30/26. Upper unit pays $1075/mo, lease converts to month-to-month on 5/31/26. Basement laundry accessible with key code. Units metered separately for electricity. One natural gas meter and one water meter for the building. New Furnace and AC in 2024. Furnishings and appliances for both units are included. Both kitchens and bathrooms were completely updated in 2024. Don't miss your opportunit
Key facts
- New furnace and ac
- 5,445 sq ft lot
- Parking
Tags
Property features AI
Finance
- Other: Total of 8 rooms in the building; Property lot size reported (assessor)
- Financial info: Upper unit current rent: $1,075 (leased through May 31, 2026); Lower unit current rent: $1,050 (leased through Sept 30, 2026); Annual tax amount reported
- HOA & community: No HOA information provided
Exterior
- Parking: Driveway
- Security: No security features provided
- Utilities: Public water service; Public sewer
- Home design: Two-story building; Multi-unit property with 1 building; Upper and lower two-bedroom units
- Construction: Built (year source: assessor); Aluminum siding and brick exterior; Asphalt roof; Above-grade finished area reported as 1,666
- Exterior features: Public water; Public sewer
Interior
- Kitchen: No specific kitchen appliance details provided
- Bedrooms: Upper unit: 2 bedrooms; Lower unit: 2 bedrooms
- Flooring: No flooring details provided
- Bathrooms: Two full bathrooms (total)
- Heating & cooling: Baseboard heating; Central air conditioning
- Interior features: Full, unfinished basement
- Laundry & utility: Laundry in basement
Neighborhood map
What this means for you Summary
Snapshot
- This is a 2 × 4.0-bed/2.0-bath units multifamily listed at $134k.
Deal economics
- At list price, monthly cash flow is $721 ($9k/yr) — positive. Per door: $361/mo.
- The deal already cash-flows at list — no discount required.
- Meets the 1% rule at list price ($2k rent vs $134k).
- Recommended offer: $132k (1.5% below list) — sets the bar for market timing.
- Cap rate 12.7% vs local median 4.6% in Conneaut — top-decile yield for the area; either an underpriced asset or a hidden risk that comps aren't pricing in. Stress-test before assuming the spread holds.
Location & tenants
- Location reads 63/100 on livability (#808 in OH) — a middle-class / working-renter tenant base. Strengths: cost of living A+, housing A+; Watch: schools C-, crime C-, health & safety D.
- Conneaut Area City (town): math 35% / reading 50% proficiency, ranked #527 of 656 in OH (top 80%) — families likely to look elsewhere, expect single-tenant / working-renter base with shorter leases.
- Market conditions: 59 active listings in the ZIP; 155 units permitted in Ashtabula County in 2024 (0 in 5+ unit buildings).
- This rent runs 42% of the median local income ($57k/yr) — at the standard rent-burdened threshold; future hikes will face affordability resistance.
Forward outlook
- Local home prices are declining (-3.0%/yr); year-one equity from $930 of loan paydown is wiped out by about $4k of value loss. Plan a longer hold.
- Ashtabula County population projected at -22% by 2050 — secular population decline; favor cash flow + early exit over multi-decade hold.
- At projected returns (-3.0% appreciation + 3.0% rent growth), your $38k cash investment doubles in ~6 years — after that, you're playing with house money.
Negotiation context
- It's been on market 30 days — a 2% lower offer ($132k) is reasonable based on typical stale-listing flexibility.
- 13 sale attempts since 29y ago with the ask held roughly flat each time — persistent listings suggest the price (not the market) is what's stuck; bring a comps-based counter.
- Current owner paid $47k; list at $134k implies a 186% gain — meaningful room to come down on a strong offer.
Risks & watch-outs
- Watch-outs: built in 1940 — expect roof / HVAC / electrical / plumbing capex.
Questions for the listing agent
- Can we see the unit-by-unit rent roll, current vacancy, and any below-market leases? What's the average tenancy length?
- What capital expenditures (roof, boiler, parking lot, exteriors) have been made in the last 5 years, and what's planned in the next 2?
- Built in 1940 — when were the roof, HVAC, electrical panel, plumbing, and water heater last replaced?
- Is there a deadline driving the sale (1031 exchange, divorce, estate, relocation)? That informs how much negotiation room exists.
- What's the average days-on-market for RENTAL listings here right now (not sales)? A rising rental-DOM trend means longer vacancies and softer asking-rent achievability than the comps imply.
- What's the recent tenant-quality profile in this submarket — average credit score on applications, eviction rate, late-payment / NSF rate, and stable-employment percentage? A property-management company in the area should have these aggregated.
- How much new apartment / multifamily construction is in the pipeline within 1–3 miles? Heavy new supply (>2% of stock underway) typically softens rents 12–24 months out; light construction supports rent growth.
Investment metrics
- 1% rule
- 1.48% ✓
- Cap rate
- 12.73%
- Cash-on-cash
- 22.98%
- DSCR
- 2.02
- GRM
- 5.6
CMA / ARV
- ARV (on-the-fly)
- $124,950
- Comps found
- 1
Show comp detail 1 sale within ~0.75 mi
| Address | Dist | Beds/Ba | Sqft | Sold | Price | $/sf | Match |
|---|---|---|---|---|---|---|---|
| 541 Madison St | 0.56mi | 4/2.0 | 1,472 (-12%) | 21mo | $110,000 | $75 | 37 |
Match score weights: distance 35% · size 25% · config 20% · recency 20%. Top-matched comps best support the ARV.
Projected returns pro-forma
-3.0% appreciation · 3.0% rent growth · sell at horizon
- IRR
- 15.9%
- Equity multiple
- 1.64×
- Total profit
- $24,122
- Equity at exit
- $20,054
- IRR
- 24.5%
- Equity multiple
- 3.13×
- Total profit
- $80,076
- Equity at exit
- $11,629
Cash invested: $37,660 (down + closing). Projections, not guarantees.
Landlord ↔ Tenant lean methodology
- Overall (STATE)
- 73 Landlord-Friendly
- State Ohio
- 73 Landlord-Friendly · R+6
- County
- — inherits STATE
- City
- — inherits STATE
ZIP-level market 44030
- Home prices YoY
- -10.8%
- Active inventory
- 59
- Price-to-rent
- 11.3×
Monthly cashflow live
- Estimated rent
- $1,988 medium interval (Pro) →
- Mortgage (P&I)
- −$705
- Tax from tax record
- −$88 /mo · $1,055/yr
- Insurance
- −$56
- HOA
- −$0
- Vacancy / Maint / Mgmt
- −$417
- Net cashflow
- $721
Break-even live
2-unit breakdown (identical units grouped — click to expand)
| Units | Beds | Baths | Est. rent |
|---|---|---|---|
| 2× units | 4.0 | 2 | $1,988 |
| #1 | 4.0 | 2 | $994 |
| #2 | 4.0 | 2 | $994 |
| Total (2 units) | $1,988 | ||
UW: 25.0% down · 7.5% · 30yr · 1.5% tax · 5.0% vac · 8.0% maint · 8.0% mgmt
Financing live
Cash to close
- Down payment
- $33,625
- Closing costs
- $4,035
- Reserves months
- —
- Total cash needed
- —
Loan-product check · same deal, 3 products live
Conventional
25% down · 7.5% · 30yr
- Down + closing
- —
- Monthly P&I
- —
- Monthly cashflow
- —
- DSCR
- —
- Eligible?
- —
Personal DTI + credit; lowest rate.
DSCR
20% down · 8.5% · 30yr
- Down + closing
- —
- Monthly P&I
- —
- Monthly cashflow
- —
- DSCR
- —
- Eligible?
- —
No personal income docs; deal must DSCR.
Hard money
10% down · 12.0% · 12mo
- Down + closing
- —
- Monthly P&I
- —
- Monthly cashflow
- —
- DSCR
- —
- Eligible?
- —
Short-term bridge; refi at stabilization.
Listing history 44 events
-
2026-06-18days on market $134,500 Active 30 DOM
-
2026-06-17days on market $134,500 Active 29 DOM
-
2026-06-16days on market $134,500 Active 28 DOM
-
2026-06-15days on market $134,500 Active 27 DOM
-
2026-06-13days on market $134,500 Active 25 DOM
-
2026-06-12days on market $134,500 Active 24 DOM
-
2026-06-09days on market $134,500 Active 21 DOM
-
2026-06-08days on market $134,500 Active 20 DOM
-
2026-06-08days on market $134,500 Active 19 DOM
-
2026-06-07days on market $134,500 Active 18 DOM
-
2026-06-04days on market $134,500 Active 15 DOM
-
2026-06-02days on market $134,500 Active 14 DOM
-
2026-06-01days on market $134,500 Active 13 DOM
-
2026-05-31days on market $134,500 Active 12 DOM
-
2026-05-19$134,500 Active
-
2021-08-02soldstatus $47,000
-
2019-08-12historical
-
2019-08-07soldstatus $30,000
-
2019-03-14price $44,900
-
2018-02-20status Active
-
2018-02-17historical
-
2017-02-23$49,900 Active
-
2016-11-24historical
-
2015-12-03$45,900 Active
-
2015-05-29historical
-
2015-03-05$49,900 Active
-
2014-01-09historical
-
2013-11-07$49,900
-
2013-10-27historical
-
2013-04-27$49,900
-
2009-05-30historical
-
2008-06-05$59,000
-
2008-05-30historical
-
2007-06-10$59,000
-
2006-01-15historical
-
2005-05-04$59,500
-
2005-03-30historical
-
2004-10-18$58,500
-
2004-07-28historical
-
2004-01-28$69,900
-
1997-12-24soldstatus $32,000
-
1997-12-15soldstatus $32,000
-
1997-10-03$34,900
-
1994-10-26soldstatus $26,000
ⓘ Source: listings_history table (triggers on properties + properties_extension) + one-shot
backfill from property_details.listing_events for pre-trigger history.
Tax reassessment forecast OH · Partial reset (capped growth)
- Current annual tax
- $1,055 · $88/mo
- Projected year-2 tax
- $1,577 · $131/mo
- Expected delta
- +$522/yr (+$43/mo · 49.4%)
ⓘ Screening estimate from a state-policy table — verify with the county assessor before closing.
Climate risk First Street
- Flood 1/10 Low FEMA zone X (unshaded) · 0% chance over 30 yrs
- Wildfire 1/10 Low
- Heat 3/10 Moderate 7 d/yr ≥93°F today · 17 d/yr by 30 yrs out
- Wind 1/10 Low
- Air quality 3/10 Moderate 2 unhealthy d/yr today · 4 by 30 yrs out
Nearby sold comps map
Loading sold comps map…
Walkable amenities ~0.75 mi
Loading nearby amenities…
Taxation est. · year 1
- Rental income
- $23,856
- − Mortgage interest
- −$7,534
- − Property taxes
- −$1,055
- − Insurance
- −$672
- − Repairs & maintenance
- −$1,908
- − Management
- −$1,908
- − Depreciation
- −$3,913
- Taxable income
- $6,865
- Est. tax owed @ 24.0%
- −$1,648
- After-tax cash flow
- $7,007/yr
For passive investors: Depreciation is non-cash, so a rental often shows a tax loss while cash-flowing — sheltering income. Rental losses are passive: they offset passive income freely, and up to $25,000/yr can offset ordinary (W-2) income if you actively participate and your MAGI is under $100k (phasing out to $0 by $150k); unused losses carry forward. On sale, claimed depreciation is recaptured at up to 25%, and gains may owe capital-gains tax (a 1031 exchange can defer both). Figures are a year-1 estimate at your 24.0% rate — not tax advice; consult a CPA.
Schools (NCES district)
- District
- Conneaut Area City
- NCES district ID
- 3904381
- Math proficiency
- 35% ▼ -18.00%
- Reading proficiency
- 50% ▼ -12.00%
- Median HH income
- $38,064
- Composite
- 35.37/100
- National rank
- #4953
- State rank
- #527 of 656 in OH
Livability — Conneaut
- Score
- 63/100
- State rank
- #808
- US rank
- #14907
Category grades
Schools grade is shown separately in the Schools card above.
Census & demographics
- Census place
- Conneaut, OH
- County
- Ashtabula · 97,617 people
- City population
- 16,317
- Metro
- Cleveland, OH
- Population (ZIP)
- 16,317
- Household income
- $57,264
- Rent vs Own
- Severe rent burden
- 11.2
Population outlook (Ashtabula County) Hauer SSP2
- Today (2025)
- 92,950 people
- By 2030
- 89,146 · -4.1%
- By 2040
- 80,715 · -13.2%
- By 2050
- 72,270 · -22.2%
- By 2075
- 55,780 · -40.0%
- By 2100
- 40,928 · -56.0%
Race, ethnicity, and origin ACS 2023
- Neighborhood character
- Predominantly White (88%)
- Race & ethnicity
- White 88% Black 6% Two or more races 4% Hispanic / Latino 2%
- Common ancestry
- Lithuanian 4% Romanian 3% Slovak 2%
- Foreign-born
- 1%
- Languages at home
- 98% English-only · Spanish 1%
Political lean MEDSL · Ashtabula
- 2024 margin
- Strong R (+28.4) · D 35.4% · R 63.8%
- 2008→2024 swing
- -41.9pp toward R · 2008: 13.5pp · 2024: -28.4pp
- All cycles
- 2024: R+28.4 2020: R+23.5 2016: R+19.0 2012: D+12.1 2008: D+13.5
Not yet ingested
- Civics
- —
Market trends
- HPI YoY
- ▼ -32.21%
- Current HPI
- 265.5019
- Rent YoY
- —
- Metro
- —
- State GDP YoY
- ▲ 1.98%
- F500 in state
- 48
Industry mix (Fortune 500 HQ in OH)
| Industry | F500 HQs | Revenue |
|---|---|---|
| Insurance | 3 | $145B |
|
||
| Industrial Machinery | 3 | $49B |
|
||
| Financial Services | 3 | $24B |
|
||
| Consumer Goods | 2 | $93B |
|
||
| Aerospace / Defense | 2 | $47B |
|
||
| Utilities | 2 | $33B |
|
||
Price history
+417.3% since first listed30 events — show timeline
- 2026-05-19 Listed $134,500 MLSNOW
- 2021-08-02 Sold (Public Records) $47,000 Public Records
- 2019-08-12 Listing Removed — MLSNOW
- 2019-08-07 Sold (Public Records) $30,000 Public Records
- 2019-03-14 Price Changed $44,900 MLSNOW
- 2018-02-20 Relisted — MLSNOW
- 2018-02-17 Listing Removed — MLSNOW
- 2017-02-23 Listed $49,900 MLSNOW
- 2016-11-24 Listing Removed — MLSNOW
- 2015-12-03 Listed $45,900 MLSNOW
- 2015-05-29 Listing Removed — MLSNOW
- 2015-03-05 Listed $49,900 MLSNOW
- 2014-01-09 Listing Removed — MLSNOW
- 2013-11-07 Listed $49,900 MLSNOW
- 2013-10-27 Listing Removed — MLSNOW
- 2013-04-27 Listed $49,900 MLSNOW
- 2009-05-30 Listing Removed — MLSNOW
- 2008-06-05 Listed $59,000 MLSNOW
- 2008-05-30 Listing Removed — MLSNOW
- 2007-06-10 Listed $59,000 MLSNOW
- 2006-01-15 Listing Removed — MLSNOW
- 2005-05-04 Listed $59,500 MLSNOW
- 2005-03-30 Listing Removed — MLSNOW
- 2004-10-18 Listed $58,500 MLSNOW
- 2004-07-28 Listing Removed — MLSNOW
- 2004-01-28 Listed $69,900 MLSNOW
- 1997-12-24 Sold (MLS) $32,000 MLSNOW
- 1997-12-15 Sold (Public Records) $32,000 Public Records
- 1997-10-03 Listed $34,900 MLSNOW
- 1994-10-26 Sold (Public Records) $26,000 Public Records
Property tax history
+6.2%/yrLatest (2025): $1,055 · -0.3% YoY. Source: county tax records.
Cash-flow waterfall
monthlySold comps — $/sqft
last 12 mo · ≤1 miLoading sold comps…