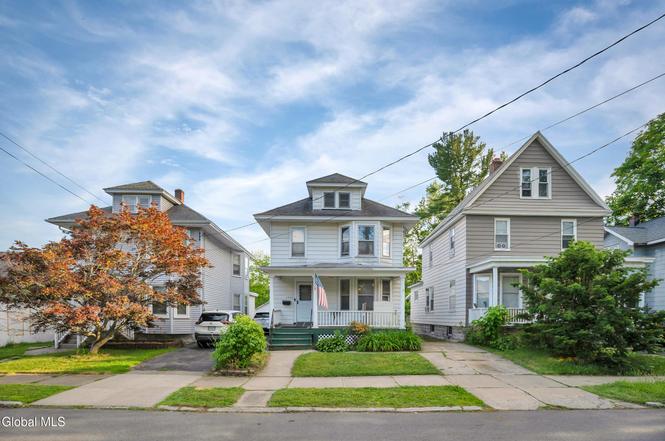
1322 Alden Pl · Schenectady, NY
Flood risk 1/10 · Minimal
- FEMA flood zone
- X (unshaded)
- Chance of flooding over 30 yrs
- 0.0%
- Est. flood insurance / yr
- $473 – $860
Fire risk 1/10 · Minimal
- Est. fire insurance / yr
- $691 – $1,283
Heat risk 4/10 · Minor
- Hot days now (above 95°F)
- 7 days/yr
- Hot days in 30 yrs
- 16 days/yr
Wind risk 3/10 · Minor
- Chance of severe wind over 30 yrs
- 4.0%
Air-quality risk 1/10 · Minimal
- Unhealthy air days now
- 0 days/yr
- Unhealthy air days in 30 yrs
- 0 days/yr
Risk factors via First Street. Map © Google.
Why this score? — see what drove the B+ grade
The composite is a weighted blend of 9 inputs, each scored 0–100. Each bar is that input's sub-score; the figure is the points it added to the 100-point composite (weight × sub-score).
- Cash flow +30.0/30.0
- ARV discount +15.0/15.0
- DSCR +10.0/10.0
- 1% rule +8.9/10.0
- Livability +3.9/5.0
- Schools +3.0/10.0
- Rent growth +2.5/5.0
- Condition / age +2.5/5.0
- Appreciation +0.0/10.0
$180,000
🖨 Deal sheet (PDF) 📄 Offer letter ✓ Due diligence
Listing remarks
Investors & Owner-Occupants Take Notice! Classic Colonial with Character & Incredible Potential. Step into over a century of charm that is a stately colonial offering 4 bedrooms, 2 full baths, and 1,752 sq ft of living space on a level, cleared larege lot including an additional deeded parcel yond the garage that comes with the sale. Whether you're an investor seeking your next value-add opportunity or a buyer ready to make a house truly your own, this property delivers the bones, the space, and the price point to make it happen. From the moment you enter, the warmth of rich natural woodwork and hardwood floors sets the tone. The gracious foyer with its striking staircase makes
Key facts
- Formal dining room
- Gracious foyer
- Arched doorways
Tags
Property features AI
Finance
- Other: Lot is level and cleared
Exterior
- Parking: One garage space (garage present); Driveway parking; Four total parking spaces
- Utilities: Public water; Public sewer
- Home design: Single family residence; Property listed in fixer condition
- Construction: Aluminum siding; Vinyl siding; Asphalt roof
- Exterior features: Enclosed rear porch; Exterior lighting; Other exterior features
Interior
- Kitchen: Dishwasher; Oven; Range; Refrigerator
- Bedrooms: One bedroom on the first floor; Three bedrooms on the second floor
- Flooring: Hardwood; Laminate; Linoleum
- Bathrooms: Two full bathrooms (one on the first floor, one on the second floor)
- Heating & cooling: Hot water heating
- Interior features: Paddle fan; Full basement; 10 total rooms
- Laundry & utility: Washer and dryer included
Neighborhood map
What this means for you Summary
Snapshot
- This is a 4-bed/2.0-bath single-family listed at $180k.
Deal economics
- At list price, monthly cash flow is $730 ($9k/yr) — positive.
- The deal already cash-flows at list — no discount required.
- Meets the 1% rule at list price ($3k rent vs $180k).
- Cap rate 11.2% vs local median 6.3% in Schenectady — top-decile yield for the area; either an underpriced asset or a hidden risk that comps aren't pricing in. Stress-test before assuming the spread holds.
Location & tenants
- Location reads 78/100 on livability (#167 in NY, #2,597 nationally) — a middle-class / working-renter tenant base. Strengths: commute A+, health & safety A+, cost of living A; Watch: employment D+, crime F.
- Schenectady City School District (urban): math 38% / reading 34% proficiency, ranked #556 of 590 in NY (top 94%) — families likely to look elsewhere, expect single-tenant / working-renter base with shorter leases; 65% free/reduced lunch — lower-income household profile, screen leases tightly.
- Zoned schools: Schenectady High School (math 75% / reading 90%, grade A, #446 of 1,100 statewide, top 41%, 2,743 students, 71% FRL).
- Zoned-school proficiency averages 82% at this address vs 36% district-wide (+46 pts) — the actual schools serving this property are materially stronger than the Schenectady City School District average implies; a family-tenant draw the district grade alone would hide.
- Market conditions: 78 active listings in the ZIP; 7 comparable units currently listed for rent nearby; rentals lingering (median 45d on market — plan ~5-8 weeks vacancy on turnover, expect pricing pressure); 57% of comp listings sitting > 30 days — soft ceiling on asking rent; 154 units permitted in Schenectady County in 2024 (54 in 5+ unit buildings).
- At $2,509/mo this rent would consume 47% of the median local household income ($63k/yr) (locally 1016% of renters already pay >50% of income on rent) — very limited rent-growth headroom before tenants either downsize or default.
Forward outlook
- Local home prices are declining (-3.0%/yr); year-one equity from $1k of loan paydown is wiped out by about $5k of value loss. Plan a longer hold.
- Schenectady County population projected to shrink 4% by 2050 — rents likely to lag national; underwrite the cash flow, not the appreciation.
- At projected returns (-3.0% appreciation + 3.0% rent growth), your $50k cash investment doubles in ~7 years — after that, you're playing with house money.
Negotiation context
- Only 1 days on market — expect competitive offers; lowballing is unlikely to land.
Risks & watch-outs
- Watch-outs: built in 1910 — expect roof / HVAC / electrical / plumbing capex.
Questions for the listing agent
- Built in 1910 — when were the roof, HVAC, electrical panel, plumbing, and water heater last replaced?
- Is there a deadline driving the sale (1031 exchange, divorce, estate, relocation)? That informs how much negotiation room exists.
- Crime grade is F in this area — have there been break-ins, vandalism, or insurance claims at this property in the last 3 years? What carrier currently insures it and at what premium?
- What's the average days-on-market for RENTAL listings here right now (not sales)? A rising rental-DOM trend means longer vacancies and softer asking-rent achievability than the comps imply.
- What's the recent tenant-quality profile in this submarket — average credit score on applications, eviction rate, late-payment / NSF rate, and stable-employment percentage? A property-management company in the area should have these aggregated.
- How much new for-sale + rental construction is in the pipeline within 1–3 miles? Heavy new supply typically softens prices + rents 12–24 months out; constrained supply supports both.
Investment metrics
- 1% rule
- 1.39% ✓
- Cap rate
- 11.16%
- Cash-on-cash
- 17.38%
- DSCR
- 1.77
- GRM
- 6.0
CMA / ARV
- ARV (on-the-fly)
- $308,352
- Comps found
- 12
Show comp detail 12 sales within ~0.75 mi
| Address | Dist | Beds/Ba | Sqft | Sold | Price | $/sf | Match |
|---|---|---|---|---|---|---|---|
| 1028 Maryland Ave | 0.24mi | 3/1.5 (-1) | 1,790 (+2%) | 1mo | $260,000 | $145 | 77 |
| 818 Bedford Rd | 0.08mi | 5/2.0 (+1) | 1,920 (+10%) | 1mo | $315,000 | $164 | 75 |
| 209 Elmer Ave | 0.18mi | 5/1.5 (+1) | 1,900 (+8%) | 2mo | $350,000 | $184 | 68 |
| 1522 Union St | 0.51mi | 4/1.5 | 1,701 (-3%) | 2mo | $325,000 | $191 | 68 |
| 317 Victory Ave | 0.57mi | 4/2.0 | 1,822 (+4%) | 1mo | $117,500 | $64 | 66 |
| 846 Wright Ave | 0.67mi | 3/2.0 (-1) | 1,754 (+0%) | 0mo | $427,000 | $243 | 63 |
| 828 Decamp Ave | 0.60mi | 3/1.5 (-1) | 1,724 (-2%) | 2mo | $371,100 | $215 | 60 |
| 1053 Brierwood Blvd | 0.33mi | 3/1.5 (-1) | 1,922 (+10%) | 3mo | $309,000 | $161 | 59 |
| 1064 Lexington Ave | 0.74mi | 5/2.0 (+1) | 1,707 (-3%) | 1mo | $300,000 | $176 | 55 |
| 1256 Parkwood Blvd | 0.63mi | 4/1.0 | 1,654 (-6%) | 2mo | $140,000 | $85 | 55 |
| 1149 Sumner Ave | 0.61mi | 3/1.5 (-1) | 1,868 (+7%) | 2mo | $290,000 | $155 | 52 |
| 1594 The Plz | 0.74mi | 3/2.0 (-1) | 1,645 (-6%) | 1mo | $300,000 | $182 | 49 |
Match score weights: distance 35% · size 25% · config 20% · recency 20%. Top-matched comps best support the ARV.
Projected returns pro-forma
-3.0% appreciation · 3.0% rent growth · sell at horizon
- IRR
- 8.8%
- Equity multiple
- 1.34×
- Total profit
- $17,372
- Equity at exit
- $26,839
- IRR
- 18.0%
- Equity multiple
- 2.49×
- Total profit
- $75,173
- Equity at exit
- $15,563
Cash invested: $50,400 (down + closing). Projections, not guarantees.
Landlord ↔ Tenant lean methodology
- Overall (STATE)
- 15 Strongly Tenant-Friendly
- State New York
- 15 Strongly Tenant-Friendly · D+10
- County
- — inherits STATE
- City
- — inherits STATE
ZIP-level market 12308
- Home prices YoY
- -14.6%
- Active inventory
- 78
- Price-to-rent
- 6.0×
Monthly cashflow live
- Estimated rent
- $2,509 high interval (Pro) →
- Mortgage (P&I)
- −$944
- Tax from tax record
- −$233 /mo · $2,800/yr
- Insurance
- −$75
- HOA
- −$0
- Vacancy / Maint / Mgmt
- −$527
- Net cashflow
- $730
Break-even live
Sensitivity live
| Price | -10% $832 | -5% $781 | +0% $730 | +5% $679 | +10% $628 |
|---|---|---|---|---|---|
| Rent | -10% $532 | -5% $631 | +0% $730 | +5% $829 | +10% $928 |
| Rate | -1.0pp $821 | -0.5pp $776 | base $730 | +0.5pp $683 | +1.0pp $636 |
UW: 25.0% down · 7.5% · 30yr · 1.5% tax · 5.0% vac · 8.0% maint · 8.0% mgmt
Financing live
Cash to close
- Down payment
- $45,000
- Closing costs
- $5,400
- Reserves months
- —
- Total cash needed
- —
Loan-product check · same deal, 3 products live
Conventional
25% down · 7.5% · 30yr
- Down + closing
- —
- Monthly P&I
- —
- Monthly cashflow
- —
- DSCR
- —
- Eligible?
- —
Personal DTI + credit; lowest rate.
DSCR
20% down · 8.5% · 30yr
- Down + closing
- —
- Monthly P&I
- —
- Monthly cashflow
- —
- DSCR
- —
- Eligible?
- —
No personal income docs; deal must DSCR.
Hard money
10% down · 12.0% · 12mo
- Down + closing
- —
- Monthly P&I
- —
- Monthly cashflow
- —
- DSCR
- —
- Eligible?
- —
Short-term bridge; refi at stabilization.
Rent comps 7 comps
| Address | Beds | Baths | Sqft | Rent | $/sqft | DOM | Units | Dist |
|---|---|---|---|---|---|---|---|---|
| 1347 Union St Schenectady, NY | 4.0 | 1.5 | 2188 | $3,750 | $1.71 | 44d | 1 | 0.24mi |
| 901 Nott St Unit 1R Schenectady, NY | 3.0 | 1.0 | 1500 | $1,250 | $0.83 | 24d | 1 | 0.86mi |
| 1747 Oneida St Schenectady, NY | 4.0 | 2.0 | 1620 | $2,700 | $1.67 | 15d | 1 | 0.97mi |
| 509 Nott St Unit 507 Schenectady, NY | 4.0 | 1.0 | 1400 | $1,695 | $1.21 | 44d | 1 | 1.00mi |
| 1687 Avenue A Schenectady, NY | 4.0 | 1.0 | 1672 | $2,300 | $1.38 | 44d | 1 | 1.08mi |
| 1673 Van Vranken Ave Schenectady, NY | 3.0 | 1.0 | 1335 | $1,750 | $1.31 | 44d | 1 | 1.10mi |
| 117 Washington Ave Schenectady, NY | 2.0–4.0 | 1.0–2.0 | 1033 | $2,163 | $2.09 | 14d | 9 | 1.48mi |
Listing history 2 events
-
2026-06-18remarks 691-char remark
-
2026-06-18$180,000 Active 1 DOM
ⓘ Source: listings_history table (triggers on properties + properties_extension) + one-shot
backfill from property_details.listing_events for pre-trigger history.
Tax reassessment forecast NY · Partial reset (capped growth)
- Current annual tax
- $2,800 · $233/mo
- Projected year-2 tax
- $2,921 · $243/mo
- Expected delta
- +$121/yr (+$10/mo · 4.3%)
ⓘ Screening estimate from a state-policy table — verify with the county assessor before closing.
Climate risk First Street
- Flood 1/10 Low FEMA zone X (unshaded) · 0% chance over 30 yrs
- Wildfire 1/10 Low
- Heat 4/10 Moderate 7 d/yr ≥95°F today · 16 d/yr by 30 yrs out
- Wind 3/10 Moderate 4% chance of damaging wind over 30 yrs
- Air quality 1/10 Low 0 unhealthy d/yr today · 0 by 30 yrs out
Nearby sold comps map
Loading sold comps map…
Walkable amenities ~0.75 mi
Loading nearby amenities…
Taxation est. · year 1
- Rental income
- $30,111
- − Mortgage interest
- −$10,083
- − Property taxes
- −$2,800
- − Insurance
- −$900
- − Repairs & maintenance
- −$2,409
- − Management
- −$2,409
- − Depreciation
- −$5,236
- Taxable income
- $6,274
- Est. tax owed @ 24.0%
- −$1,506
- After-tax cash flow
- $7,255/yr
For passive investors: Depreciation is non-cash, so a rental often shows a tax loss while cash-flowing — sheltering income. Rental losses are passive: they offset passive income freely, and up to $25,000/yr can offset ordinary (W-2) income if you actively participate and your MAGI is under $100k (phasing out to $0 by $150k); unused losses carry forward. On sale, claimed depreciation is recaptured at up to 25%, and gains may owe capital-gains tax (a 1031 exchange can defer both). Figures are a year-1 estimate at your 24.0% rate — not tax advice; consult a CPA.
Schools (NCES district)
- District
- Schenectady City School District
- NCES district ID
- 3626010
- Math proficiency
- 38% ▲ 12.00%
- Reading proficiency
- 34% ▲ 2.00%
- Median HH income
- $39,453
- Composite
- 30.2/100
- National rank
- #6309
- State rank
- #556 of 590 in NY
Livability — Schenectady
- Score
- 78/100
- State rank
- #167
- US rank
- #2597
Category grades
Schools grade is shown separately in the Schools card above.
Census & demographics
- Census place
- Schenectady, NY
- County
- Schenectady County · 141,369 people
- City population
- 141,369
- Metro
- Albany-Schenectady-Troy, NY
- Population (ZIP)
- 15,511
- Household income
- $63,434
- Rent vs Own
- Severe rent burden
- 1016.0
Population outlook (Schenectady County) Hauer SSP2
- Today (2025)
- 155,046 people
- By 2030
- 154,322 · -0.5%
- By 2040
- 151,796 · -2.1%
- By 2050
- 148,621 · -4.1%
- By 2075
- 141,229 · -8.9%
- By 2100
- 126,014 · -18.7%
Race, ethnicity, and origin ACS 2023
- Neighborhood character
- Diverse neighborhood (Simpson 0.63)
- Race & ethnicity
- White 57% Black 17% Hispanic / Latino 13% Two or more races 7% Asian 3%
- Hispanic origin (detail)
- Mexican 2% Puerto Rican 8%
- Common ancestry
- Lithuanian 4% Romanian 4% Slovak 3%
- Foreign-born
- 10% · Canada
- Languages at home
- 89% English-only · Spanish 5% Other Indo-European 2% Arabic 1%
Political lean MEDSL · Schenectady
- 2024 margin
- D (+10.8) · D 55.4% · R 44.6%
- 2008→2024 swing
- -1.8pp toward R · 2008: 12.7pp · 2024: 10.8pp
- All cycles
- 2024: D+10.8 2020: D+15.7 2016: D+5.8 2012: D+15.4 2008: D+12.7
Not yet ingested
- Civics
- —
Market trends
- HPI YoY
- ▼ -59.17%
- Current HPI
- 344.8675
- Rent YoY
- —
- Metro
- Albany-Schenectady-Troy, NY
- State GDP YoY
- ▲ 2.60%
- F500 in state
- 92
Industry mix (Fortune 500 HQ in NY)
| Industry | F500 HQs | Revenue |
|---|---|---|
| Financial Services | 10 | $950B |
|
||
| Consumer Goods | 9 | $162B |
|
||
| Insurance | 4 | $225B |
|
||
| Telecommunications | 2 | $144B |
|
||
| Pharmaceuticals | 2 | $112B |
|
||
| Media / Entertainment | 2 | $69B |
|
||
Price history
1 event — show timeline
- 2026-06-17 Listed $180,000 Global MLS
Property tax history
+8.0%/yrLatest (2025): $2,800 · +8.2% YoY. Source: county tax records.
Cash-flow waterfall
monthlySold comps — $/sqft
last 12 mo · ≤1 miLoading sold comps…