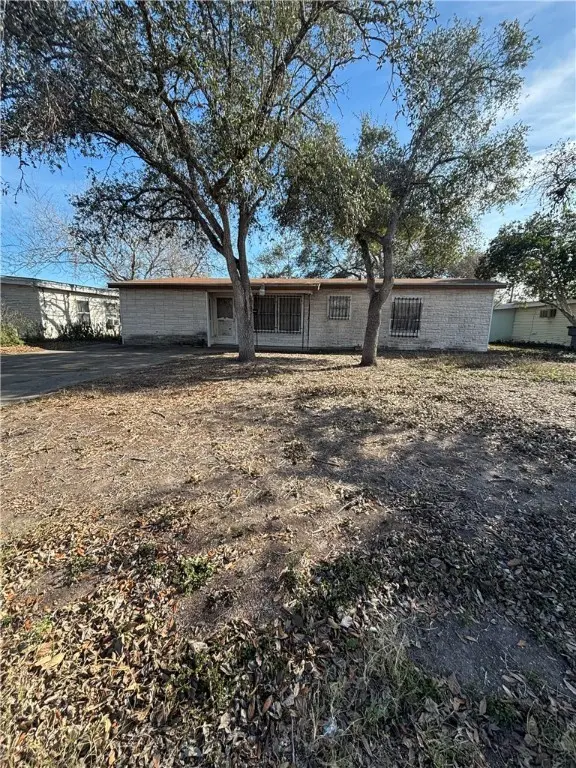
1409 Lalita St · Alice, TX
Flood risk 4/10 · Minor
- FEMA flood zone
- X (shaded)
- Chance of flooding over 30 yrs
- 0.2%
- Est. flood insurance / yr
- $507 – $1,088
Fire risk 6/10 · Moderate
- Est. fire insurance / yr
- $1,222 – $2,270
Heat risk 9/10 · Severe
- Hot days now (above 113°F)
- 7 days/yr
- Hot days in 30 yrs
- 21 days/yr
Wind risk 8/10 · Major
- Chance of severe wind over 30 yrs
- 99.0%
Air-quality risk 1/10 · Minimal
- Unhealthy air days now
- 0 days/yr
- Unhealthy air days in 30 yrs
- 0 days/yr
Risk factors via First Street. Map © Google.
Why this score? — see what drove the B grade
The composite is a weighted blend of 9 inputs, each scored 0–100. Each bar is that input's sub-score; the figure is the points it added to the 100-point composite (weight × sub-score).
- Cash flow +30.0/30.0
- ARV discount +15.0/15.0
- DSCR +10.0/10.0
- 1% rule +9.1/10.0
- Livability +3.4/5.0
- Rent growth +2.5/5.0
- Condition / age +2.5/5.0
- Schools +1.5/10.0
- Appreciation +0.0/10.0
$85,000
🖨 Deal sheet 📄 Offer letter ✓ Due diligence
Listing remarks MLS
Attention investors! Yes this HOME needs lots of updates! This could be your project to an absolute great home with its Large living area with dinning area open to the kitchen and living area. This home also features large bed rooms and baths! Make your appointment today! Its going to go quick!
Key facts
- 7,680 sq ft lot
- Garage
- Built 1900
Neighborhood map
What this means for you Summary
Snapshot
- This is a 3-bed/1.0-bath single-family listed at $85k.
Deal economics
- At list price, monthly cash flow is $333 ($4k/yr) — positive.
- The deal already cash-flows at list — no discount required.
- Meets the 1% rule at list price ($1k rent vs $85k).
- Recommended offer: $75k (12.0% below list) — sets the bar for market timing.
- Cap rate 11.0% vs local median 4.1% in Alice — top-decile yield for the area; either an underpriced asset or a hidden risk that comps aren't pricing in. Stress-test before assuming the spread holds.
Location & tenants
- Location reads 67/100 on livability (#558 in TX) — a middle-class / working-renter tenant base. Strengths: cost of living A+, health & safety A+, housing A; Watch: employment D, schools D-, crime F.
- Alice ISD (town): math 12% / reading 23% proficiency, ranked #799 of 826 in TX (top 97%) — low school quality limits family demand, transient renter base, plan for 1-2y turnover; 70% free/reduced lunch — lower-income household profile, screen leases tightly.
- Market conditions: 220 active listings in the ZIP; 1 comparable units currently listed for rent nearby; 6 units permitted in Jim Wells County in 2024 (0 in 5+ unit buildings).
Forward outlook
- Local home prices are declining (-3.0%/yr); year-one equity from $588 of loan paydown is wiped out by about $3k of value loss. Plan a longer hold.
- Jim Wells County population projected at +10% by 2050 — modest demand growth; plan on rents tracking national, not racing it.
- At projected returns (-3.0% appreciation + 3.0% rent growth), your $24k cash investment doubles in ~8 years — after that, you're playing with house money.
Negotiation context
- It's been on market 165 days — a 12% lower offer ($75k) is reasonable based on typical stale-listing flexibility.
Risks & watch-outs
- Watch-outs: built in 1900 — expect roof / HVAC / electrical / plumbing capex.
- Climate carrying-cost: severe wind risk, 99% chance of damaging wind over 30y; major wildfire risk; extreme-heat days projected 7→21/yr by 2055 (HVAC capex compounding) — expect insurance premiums to compound above CPI over the hold.
Questions for the listing agent
- It's been on market 165 days. Have you received any prior offers? Is the seller open to a 12% concession, seller financing, or rate buy-down credit?
- Built in 1900 — when were the roof, HVAC, electrical panel, plumbing, and water heater last replaced?
- Why hasn't it sold? Are there any deal-killer items the seller is aware of (foundation, flood, title, zoning, code violations)?
- Is there a deadline driving the sale (1031 exchange, divorce, estate, relocation)? That informs how much negotiation room exists.
- Schools are D-rated, which usually means shorter tenancies and higher turnover. Who's the typical renter profile here, and what's been the actual vacancy rate?
- Crime grade is F in this area — have there been break-ins, vandalism, or insurance claims at this property in the last 3 years? What carrier currently insures it and at what premium?
- What's the average days-on-market for RENTAL listings here right now (not sales)? A rising rental-DOM trend means longer vacancies and softer asking-rent achievability than the comps imply.
- What's the recent tenant-quality profile in this submarket — average credit score on applications, eviction rate, late-payment / NSF rate, and stable-employment percentage? A property-management company in the area should have these aggregated.
- How much new for-sale + rental construction is in the pipeline within 1–3 miles? Heavy new supply typically softens prices + rents 12–24 months out; constrained supply supports both.
Investment metrics
- 1% rule
- 1.41% ✓
- Cap rate
- 11.00%
- Cash-on-cash
- 16.81%
- DSCR
- 1.75
- GRM
- 5.9
CMA / ARV
- ARV (median comp)
- $117,030
- List price
- $85,000
- Delta
- -27.37%
- Verdict
- UNDERPRICED
- Comps
- 20 within 1.0 mi
Show comp detail 12 sales within ~0.75 mi
| Address | Dist | Beds/Ba | Sqft | Sold | Price | $/sf | Match |
|---|---|---|---|---|---|---|---|
| 1601 Odilia St | 0.11mi | 3/2.0 | 1,302 (-3%) | 14mo | $154,000 | $118 | 74 |
| 1201 S Cameron St | 0.20mi | 3/2.0 | 1,392 (+4%) | 11mo | $60,000 | $43 | 71 |
| 712 E Hill Ave | 0.49mi | 3/2.0 | 1,346 (+0%) | 5mo | $195,000 | $145 | 69 |
| 1622 S Reynolds St | 0.36mi | 3/2.0 | 1,256 (-6%) | 9mo | $138,600 | $110 | 61 |
| 1724 Tina St | 0.12mi | 4/3.0 (+1) | 1,468 (+9%) | 14mo | $205,000 | $140 | 54 |
| 208 Scott St | 0.46mi | 3/1.0 | 1,192 (-11%) | 10mo | $86,500 | $73 | 51 |
| 1801 Tina St | 0.15mi | 4/2.0 (+1) | 1,160 (-14%) | 14mo | $185,000 | $159 | 50 |
| 715 Lucero St | 0.74mi | 3/1.0 | 1,274 (-5%) | 16mo | $39,000 | $31 | 43 |
| 1126 Cynthia Dr | 0.49mi | 3/2.0 | 1,223 (-9%) | 19mo | $139,900 | $114 | 42 |
| 600 Gardenia St | 0.66mi | 2/2.0 (-1) | 1,254 (-7%) | 24mo | $172,000 | $137 | 29 |
| 216 E Hill Ave | 0.64mi | 3/2.0 | 1,526 (+14%) | 20mo | $148,500 | $97 | 27 |
| 202 E Hill Ave | 0.67mi | 3/2.0 | 1,168 (-13%) | 23mo | $159,000 | $136 | 23 |
Match score weights: distance 35% · size 25% · config 20% · recency 20%. Top-matched comps best support the ARV.
Projected returns pro-forma
-3.0% appreciation · 3.0% rent growth · sell at horizon
- IRR
- 8.0%
- Equity multiple
- 1.32×
- Total profit
- $7,497
- Equity at exit
- $12,674
- IRR
- 17.3%
- Equity multiple
- 2.43×
- Total profit
- $34,015
- Equity at exit
- $7,349
Cash invested: $23,800 (down + closing). Projections, not guarantees.
Landlord ↔ Tenant lean methodology
- Overall (STATE)
- 87 Strongly Landlord-Friendly
- State Texas
- 87 Strongly Landlord-Friendly · R+5
- County
- — inherits STATE
- City
- — inherits STATE
ZIP-level market 78332
- Active inventory
- 220
- Price-to-rent
- 5.9×
Monthly cashflow live
- Estimated rent
- $1,200 medium interval (Pro) →
- Mortgage (P&I)
- −$446
- Tax from tax record
- −$133 /mo · $1,601/yr
- Insurance
- −$35
- HOA
- −$0
- Vacancy / Maint / Mgmt
- −$252
- Net cashflow
- $333
Break-even live
UW: 25.0% down · 7.5% · 30yr · 1.5% tax · 5.0% vac · 8.0% maint · 8.0% mgmt
Financing live
Cash to close
- Down payment
- $21,250
- Closing costs
- $2,550
- Reserves months
- —
- Total cash needed
- —
Loan-product check · same deal, 3 products live
Conventional
25% down · 7.5% · 30yr
- Down + closing
- —
- Monthly P&I
- —
- Monthly cashflow
- —
- DSCR
- —
- Eligible?
- —
Personal DTI + credit; lowest rate.
DSCR
20% down · 8.5% · 30yr
- Down + closing
- —
- Monthly P&I
- —
- Monthly cashflow
- —
- DSCR
- —
- Eligible?
- —
No personal income docs; deal must DSCR.
Hard money
10% down · 12.0% · 12mo
- Down + closing
- —
- Monthly P&I
- —
- Monthly cashflow
- —
- DSCR
- —
- Eligible?
- —
Short-term bridge; refi at stabilization.
Rent comps 1 comps
| Address | Beds | Baths | Sqft | Rent | $/sqft | DOM | Units | Dist |
|---|---|---|---|---|---|---|---|---|
| 516 E 6th St Unit B Alice, TX | 2.0 | 1.0 | 920 | $1,200 | $1.30 | 24d | 1 | 1.39mi |
Listing history 15 events
-
2026-06-18days on market $85,000 Active 165 DOM
-
2026-06-17days on market $85,000 Active 164 DOM
-
2026-06-16days on market $85,000 Active 163 DOM
-
2026-06-15days on market $85,000 Active 162 DOM
-
2026-06-13days on market $85,000 Active 160 DOM
-
2026-06-12days on market $85,000 Active 159 DOM
-
2026-06-09days on market $85,000 Active 156 DOM
-
2026-06-08days on market $85,000 Active 155 DOM
-
2026-06-08days on market $85,000 Active 154 DOM
-
2026-06-07days on market $85,000 Active 153 DOM
-
2026-06-03days on market $85,000 Active 150 DOM
-
2026-06-02days on market $85,000 Active 149 DOM
-
2026-06-01days on market $85,000 Active 148 DOM
-
2026-05-31days on market $85,000 Active 147 DOM
-
2026-01-04$85,000 Active 297-char remark
Show marketing remark (297 chars)
Attention investors! Yes this HOME needs lots of updates! This could be your project to an absolute great home with its Large living area with dinning area open to the kitchen and living area. This home also features large bed rooms and baths! Make your appointment today! Its going to go quick!
ⓘ Source: listings_history table (triggers on properties + properties_extension) + one-shot
backfill from property_details.listing_events for pre-trigger history.
Tax reassessment forecast TX · Resets to sale price
- Current annual tax
- $1,601 · $133/mo
- Projected year-2 tax
- $1,601 · $133/mo
- Expected delta
- $0/yr ($0/mo · 0.0%)
ⓘ Screening estimate from a state-policy table — verify with the county assessor before closing.
Climate risk First Street
- Flood 4/10 Moderate FEMA zone X (shaded) · 20% chance over 30 yrs
- Wildfire 6/10 Major
- Heat 9/10 Extreme 7 d/yr ≥113°F today · 21 d/yr by 30 yrs out
- Wind 8/10 Severe 99% chance of damaging wind over 30 yrs
- Air quality 1/10 Low 0 unhealthy d/yr today · 0 by 30 yrs out
Nearby sold comps map
Loading sold comps map…
Walkable amenities ~0.75 mi
Loading nearby amenities…
Taxation est. · year 1
- Rental income
- $14,400
- − Mortgage interest
- −$4,761
- − Property taxes
- −$1,601
- − Insurance
- −$425
- − Repairs & maintenance
- −$1,152
- − Management
- −$1,152
- − Depreciation
- −$2,473
- Taxable income
- $2,836
- Est. tax owed @ 24.0%
- −$681
- After-tax cash flow
- $3,320/yr
For passive investors: Depreciation is non-cash, so a rental often shows a tax loss while cash-flowing — sheltering income. Rental losses are passive: they offset passive income freely, and up to $25,000/yr can offset ordinary (W-2) income if you actively participate and your MAGI is under $100k (phasing out to $0 by $150k); unused losses carry forward. On sale, claimed depreciation is recaptured at up to 25%, and gains may owe capital-gains tax (a 1031 exchange can defer both). Figures are a year-1 estimate at your 24.0% rate — not tax advice; consult a CPA.
Schools (NCES district)
- District
- Alice ISD
- NCES district ID
- 4807800
- Math proficiency
- 12% ▼ -18.00%
- Reading proficiency
- 23% ▼ -7.00%
- Median HH income
- $37,747
- Composite
- 14.63/100
- National rank
- #9407
- State rank
- #799 of 826 in TX
Livability — Alice
- Score
- 67/100
- State rank
- #558
- US rank
- #10742
Category grades
Schools grade is shown separately in the Schools card above.
Census & demographics
- Census place
- Alice, TX
- Population (ZIP)
- 27,281
Population outlook (Jim Wells County) Hauer SSP2
- Today (2025)
- 43,325 people
- By 2030
- 44,156 · +1.9%
- By 2040
- 45,790 · +5.7%
- By 2050
- 47,455 · +9.5%
- By 2075
- 51,800 · +19.6%
- By 2100
- 52,006 · +20.0%
Race, ethnicity, and origin ACS 2023
- Neighborhood character
- Predominantly Hispanic (84%)
- Race & ethnicity
- Hispanic / Latino 84% White 14% Two or more races 14%
- Hispanic origin (detail)
- Mexican 76%
- Foreign-born
- 4% · Canada
- Languages at home
- 50% English-only · Spanish 49%
Political lean MEDSL · Jim Wells
- 2024 margin
- R (+15.5) · D 42.0% · R 57.5%
- 2008→2024 swing
- -31.6pp toward R · 2008: 16.1pp · 2024: -15.5pp
- All cycles
- 2024: R+15.5 2020: R+9.8 2016: D+10.3 2012: D+17.0 2008: D+16.1
Not yet ingested
- Civics
- —
Market trends
- HPI YoY
- ▼ -123.86%
- Current HPI
- 77.6253
- Rent YoY
- —
- Metro
- —
- State GDP YoY
- ▲ 3.95%
- F500 in state
- 110
Industry mix (Fortune 500 HQ in TX)
| Industry | F500 HQs | Revenue |
|---|---|---|
| Energy | 16 | $1,198B |
|
||
| Technology | 5 | $198B |
|
||
| Engineering / Construction | 4 | $72B |
|
||
| Energy Services | 3 | $60B |
|
||
| Utilities | 3 | $41B |
|
||
| Healthcare | 2 | $330B |
|
||
Price history
1 event — show timeline
- 2026-01-04 Listed $85,000 CBMLS
Property tax history
+5.8%/yrLatest (2025): $1,601 · +21.2% YoY. Source: county tax records.
Cash-flow waterfall
monthlySold comps — $/sqft
last 12 mo · ≤1 miLoading sold comps…