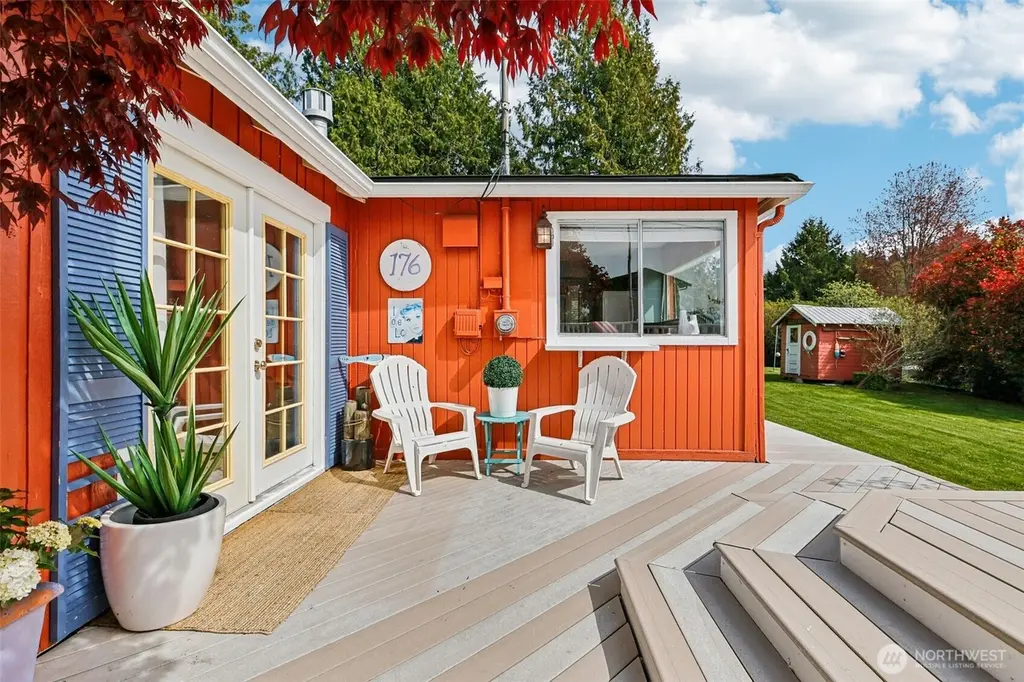
176 Maple St · Camano, WA
Flood risk 1/10 · Minimal
- FEMA flood zone
- X (unshaded)
- Chance of flooding over 30 yrs
- 0.0%
- Est. flood insurance / yr
- $507 – $1,088
Fire risk 3/10 · Minor
- Est. fire insurance / yr
- $604 – $1,122
Heat risk 2/10 · Minimal
- Hot days now (above 81°F)
- 9 days/yr
- Hot days in 30 yrs
- 23 days/yr
Wind risk 1/10 · Minimal
- Chance of severe wind over 30 yrs
- —
Air-quality risk 6/10 · Moderate
- Unhealthy air days now
- 7 days/yr
- Unhealthy air days in 30 yrs
- 8 days/yr
Risk factors via First Street. Map © Google.
Why this score? — see what drove the D grade
The composite is a weighted blend of 9 inputs, each scored 0–100. Each bar is that input's sub-score; the figure is the points it added to the 100-point composite (weight × sub-score).
- ARV discount +15.0/15.0
- Cash flow +7.9/30.0
- Schools +5.8/10.0
- Appreciation +3.5/10.0
- Livability +3.4/5.0
- Rent growth +2.5/5.0
- Condition / age +2.5/5.0
- DSCR +2.0/10.0
- 1% rule +1.7/10.0
$412,000
🖨 Deal sheet (PDF) 📄 Offer letter ✓ Due diligence
Listing remarks
Tucked into the heart of the Madrona Beach community, “Lucy” is a charming 1931 cottage rich with history and coastal character. Lucy has long been a place of comfort, creativity, and connection to nature. Set on a generous sized lot, the property offers rare flexibility to create the perfect setting for gardening, relaxing, or future possibilities. Just a short stroll to beach access, daily life here is shaped by shoreline walks and stunning sunsets. Inside, the cozy living room centers around a fireplace, creating a warm and inviting atmosphere year round. Natural light fills the home, highlighting its vintage charm. The two bedroom, one bath plus den layout is thoughtfully si
Key facts
- Two spacious lots
- Cozy living room
- Sunny deck
Tags
Property features AI
Finance
- Other: Living area approximately 1,008; Lot about 0.1837 acre; Site is level; Beach rights / community waterfront access
- Financial info: Accepts Cash, Conventional, FHA, and VA financing
Exterior
- Parking: No garage; RV parking available; Paved access
- Security: Partially fenced
- Utilities: Community water; Septic sewer; Electric and propane energy sources; Electric water heater; Power provided by Snohomish County PUD
- Home design: Single family residence; One story; Entry on main level; Has view
- Construction: Wood construction; Composition roof; Built on lot; Pillar/post/pier foundation
- Exterior features: Deck; Partially fenced; Outbuildings; Patio; RV parking; Wood exterior
Interior
- Kitchen: Kitchen with eating space; Dishwasher; Refrigerator; Stove/Range
- Bedrooms: 2 bedrooms (both on the main level); Den/office on the main level
- Flooring: Engineered hardwood
- Bathrooms: 1 full bathroom (main level) with a bathtub and shower
- Heating & cooling: Stove/free-standing heating; Wall furnace; Wall cooling unit(s)
- Interior features: Fireplace; Water heater
- Laundry & utility: Washer; Dryer; Utility room (main level)
Neighborhood map
What this means for you Summary
Snapshot
- This is a 3-bed/1.0-bath single-family listed at $412k.
Deal economics
- At list price, monthly cash flow is $-440 ($-5k/yr) — negative.
- To cash-flow at today's rent, offer at most $334k (18.9% below list).
- To meet the 1% rule (rent ≥ 1% of price), the offer needs to be $274k (33.4% below list).
- Recommended offer: $274k (33.4% below list) — sets the bar for 1% rule.
- Cap rate 5.0% vs local median 1.8% in Camano — top-decile yield for the area; either an underpriced asset or a hidden risk that comps aren't pricing in. Stress-test before assuming the spread holds.
Location & tenants
- Location reads 67/100 on livability (#293 in WA) — a middle-class / working-renter tenant base. Strengths: employment A+, housing A+, crime A-; Watch: health & safety C-, amenities F, commute F.
- Stanwood-Camano School District (town): math 57% / reading 72% proficiency, ranked #32 of 291 in WA (top 11%) — acceptable for families but not a draw, mixed tenant base, ~2y average lease.
- Zoned schools: Elger Bay Elementary (355 students, 38% FRL); Port Susan Middle School (516 students, 34% FRL); Stanwood High School (1,332 students, 30% FRL).
- Market conditions: 233 active listings in the ZIP; 1 comparable units currently listed for rent nearby; solid renter incomes; 402 units permitted in Island County in 2024 (54 in 5+ unit buildings).
- This rent runs 31% of the median local income ($105k/yr) — at the standard rent-burdened threshold; future hikes will face affordability resistance.
Forward outlook
- Local home prices are declining (-2.9%/yr); year-one equity from $3k of loan paydown is wiped out by about $12k of value loss. Plan a longer hold.
- Island County population projected to shrink 6% by 2050 — rents likely to lag national; underwrite the cash flow, not the appreciation.
Negotiation context
- It's been on market 56 days — a 3% lower offer ($400k) is reasonable based on typical stale-listing flexibility.
- Current owner paid $81k; list at $412k implies a 407% gain — meaningful room to come down on a strong offer.
Risks & watch-outs
- Watch-outs: built in 1931 — expect roof / HVAC / electrical / plumbing capex.
Questions for the listing agent
- What do current leases actually rent for vs. the listed asking? Can we see a recent rent roll and the last 12 months of T-12 income?
- It's been on market 56 days. Have you received any prior offers? Is the seller open to a 33% concession, seller financing, or rate buy-down credit?
- Built in 1931 — when were the roof, HVAC, electrical panel, plumbing, and water heater last replaced?
- Is there a deadline driving the sale (1031 exchange, divorce, estate, relocation)? That informs how much negotiation room exists.
- Schools are B-rated — typically a magnet for longer-tenancy family renters. What's the average tenant stay here, and is there a school-zone premium baked into asking?
- The area grade is low — what's the realistic commute time and amenity access for the typical tenant pool here? Any planned neighborhood developments (good or bad) we should know about?
- What's the average days-on-market for RENTAL listings here right now (not sales)? A rising rental-DOM trend means longer vacancies and softer asking-rent achievability than the comps imply.
- What's the recent tenant-quality profile in this submarket — average credit score on applications, eviction rate, late-payment / NSF rate, and stable-employment percentage? A property-management company in the area should have these aggregated.
- How much new for-sale + rental construction is in the pipeline within 1–3 miles? Heavy new supply typically softens prices + rents 12–24 months out; constrained supply supports both.
Investment metrics
- 1% rule
- 0.67% ✗
- Cap rate
- 5.01%
- Cash-on-cash
- -4.58%
- DSCR
- 0.80
- GRM
- 12.5
CMA / ARV
- ARV (median comp)
- $505,000
- List price
- $412,000
- Delta
- -18.42%
- Verdict
- UNDERPRICED
- Comps
- 10 within 1.0 mi
Projected returns pro-forma
-2.94% appreciation · 3.0% rent growth · sell at horizon
- IRR
- -23.6%
- Equity multiple
- 0.19×
- Total profit
- $-93,853
- Equity at exit
- $62,526
- IRR
- -18.6%
- Equity multiple
- -0.02×
- Total profit
- $-117,357
- Equity at exit
- $37,507
Cash invested: $115,360 (down + closing). Projections, not guarantees.
Landlord ↔ Tenant lean methodology
- Overall (STATE)
- 28 Tenant-Leaning
- State Washington
- 28 Tenant-Leaning · D+8
- County
- — inherits STATE
- City
- — inherits STATE
ZIP-level market 98282
- Home prices YoY
- -0.4%
- Active inventory
- 233
- Price-to-rent
- 12.5×
Monthly cashflow live
- Estimated rent
- $2,742 medium interval (Pro) →
- Mortgage (P&I)
- −$2,161
- Tax from tax record
- −$274 /mo · $3,288/yr
- Insurance
- −$172
- HOA
- −$0
- Lot rent
- −$0
- Vacancy / Maint / Mgmt
- −$576
- Net cashflow
- $-440
Break-even live
Sensitivity live
| Price | -10% $-207 | -5% $-323 | +0% $-440 | +5% $-556 | +10% $-673 |
|---|---|---|---|---|---|
| Rent | -10% $-656 | -5% $-548 | +0% $-440 | +5% $-332 | +10% $-223 |
| Rate | -1.0pp $-232 | -0.5pp $-335 | base $-440 | +0.5pp $-547 | +1.0pp $-655 |
UW: 25.0% down · 7.5% · 30yr · 1.5% tax · 5.0% vac · 8.0% maint · 8.0% mgmt
Financing live
Cash to close
- Down payment
- $103,000
- Closing costs
- $12,360
- Reserves months
- —
- Total cash needed
- —
Loan-product check · same deal, 3 products live
Conventional
25% down · 7.5% · 30yr
- Down + closing
- —
- Monthly P&I
- —
- Monthly cashflow
- —
- DSCR
- —
- Eligible?
- —
Personal DTI + credit; lowest rate.
DSCR
20% down · 8.5% · 30yr
- Down + closing
- —
- Monthly P&I
- —
- Monthly cashflow
- —
- DSCR
- —
- Eligible?
- —
No personal income docs; deal must DSCR.
Hard money
10% down · 12.0% · 12mo
- Down + closing
- —
- Monthly P&I
- —
- Monthly cashflow
- —
- DSCR
- —
- Eligible?
- —
Short-term bridge; refi at stabilization.
Rent comps 1 comps
| Address | Beds | Baths | Sqft | Rent | $/sqft | DOM | Units | Dist |
|---|---|---|---|---|---|---|---|---|
| 396 Evergreen Park Rd Unit B Camano, WA | 2.0 | 1.0 | 1200 | $2,300 | $1.92 | 26d | 1 | 0.77mi |
Listing history 17 events
-
2026-06-18status $412,000 Pending 56 DOM
-
2026-06-17days on market $412,000 Active 56 DOM
-
2026-06-16days on market $412,000 Active 55 DOM
-
2026-06-15days on market $412,000 Active 54 DOM
-
2026-06-13pricedays on market $412,000 Active 52 DOM
-
2026-06-09days on market $435,000 Active 48 DOM
-
2026-06-08days on market $435,000 Active 47 DOM
-
2026-06-07days on market $435,000 Active 46 DOM
-
2026-06-04days on market $435,000 Active 43 DOM
-
2026-06-03days on market $435,000 Active 42 DOM
-
2026-06-02days on market $435,000 Active 41 DOM
-
2026-06-01days on market $435,000 Active 40 DOM
-
2026-05-31days on market $435,000 Active 39 DOM
-
2026-04-22$435,000 Active
-
2000-05-08soldstatus $81,192
-
1989-10-01soldstatus $27,000
-
1979-05-01soldstatus $23,500
ⓘ Source: listings_history table (triggers on properties + properties_extension) + one-shot
backfill from property_details.listing_events for pre-trigger history.
Tax reassessment forecast WA · Resets to sale price
- Current annual tax
- $3,288 · $274/mo
- Projected year-2 tax
- $4,038 · $336/mo
- Expected delta
- +$750/yr (+$63/mo · 22.8%)
ⓘ Screening estimate from a state-policy table — verify with the county assessor before closing.
Climate risk First Street
- Flood 1/10 Low FEMA zone X (unshaded) · 0% chance over 30 yrs
- Wildfire 3/10 Moderate
- Heat 2/10 Low 9 d/yr ≥81°F today · 23 d/yr by 30 yrs out
- Wind 1/10 Low
- Air quality 6/10 Major 7 unhealthy d/yr today · 8 by 30 yrs out
Nearby sold comps map
Loading sold comps map…
Walkable amenities ~0.75 mi
Loading nearby amenities…
Taxation est. · year 1
- Rental income
- $32,907
- − Mortgage interest
- −$23,078
- − Property taxes
- −$3,288
- − Insurance
- −$2,060
- − Repairs & maintenance
- −$2,633
- − Management
- −$2,633
- − Depreciation
- −$11,985
- Taxable loss
- −$12,770
- Est. tax savings @ 24.0%
- +$3,065
- After-tax cash flow
- $-2,213/yr
For passive investors: Depreciation is non-cash, so a rental often shows a tax loss while cash-flowing — sheltering income. Rental losses are passive: they offset passive income freely, and up to $25,000/yr can offset ordinary (W-2) income if you actively participate and your MAGI is under $100k (phasing out to $0 by $150k); unused losses carry forward. On sale, claimed depreciation is recaptured at up to 25%, and gains may owe capital-gains tax (a 1031 exchange can defer both). Figures are a year-1 estimate at your 24.0% rate — not tax advice; consult a CPA.
Schools (NCES district)
- District
- Stanwood-Camano School District
- NCES district ID
- 5308340
- Math proficiency
- 57% ▼ -1.00%
- Reading proficiency
- 72% ▲ 1.00%
- Median HH income
- $69,420
- Composite
- 58.06/100
- National rank
- #2152
- State rank
- #32 of 291 in WA
Livability — Camano
- Score
- 67/100
- State rank
- #293
- US rank
- #10282
Category grades
Schools grade is shown separately in the Schools card above.
Census & demographics
- Census place
- Camano, WA
- County
- Island County · 71,196 people
- City population
- 17,535
- Metro
- Oak Harbor, WA
- Population (ZIP)
- 17,303
- Household income
- $105,231
- Rent vs Own
- Severe rent burden
- 160.0
Population outlook (Island County) Hauer SSP2
- Today (2025)
- 82,019 people
- By 2030
- 81,329 · -0.8%
- By 2040
- 78,552 · -4.2%
- By 2050
- 77,042 · -6.1%
- By 2075
- 80,799 · -1.5%
- By 2100
- 84,451 · +3.0%
Race, ethnicity, and origin ACS 2023
- Neighborhood character
- Predominantly White (89%)
- Race & ethnicity
- White 89% Two or more races 4% Hispanic / Latino 3% Asian 3% Black 2%
- Common ancestry
- Portuguese 7% Slovak 4% Lithuanian 3%
- Foreign-born
- 5% · China, Canada, South Korea
- Languages at home
- 94% English-only · Spanish 1% Chinese 1% Other Indo-European 1%
Political lean MEDSL · Island
- 2024 margin
- D (+16.6) · D 56.8% · R 40.3% · Other 2.9%
- 2008→2024 swing
- +10.3pp toward D · 2008: 6.2pp · 2024: 16.6pp
- All cycles
- 2024: D+16.6 2020: D+12.0 2016: D+5.9 2012: D+4.4 2008: D+6.2
Not yet ingested
- Civics
- —
Market trends
- HPI YoY
- ▼ -2.94%
- Current HPI
- 803.49
- Rent YoY
- —
- Metro
- Oak Harbor, WA
- State GDP YoY
- ▲ 4.65%
- F500 in state
- 22
Industry mix (Fortune 500 HQ in WA)
| Industry | F500 HQs | Revenue |
|---|---|---|
| Retail | 2 | $269B |
|
||
| Technology / Retail | 1 | $638B |
|
||
| Technology | 1 | $245B |
|
||
| Telecommunications | 1 | $38B |
|
||
| Food / Beverage | 1 | $36B |
|
||
| Automotive / Trucks | 1 | $34B |
|
||
Price history
+1653.2% since first listed6 events — show timeline
- 2026-06-18 Pending — NWMLS as Distributed by MLS Grid
- 2026-06-12 Price Changed $412,000 NWMLS as Distributed by MLS Grid
- 2026-04-22 Listed $435,000 NWMLS as Distributed by MLS Grid
- 2000-05-08 Sold (Public Records) $81,192 Public Records
- 1989-10-01 Sold (Public Records) $27,000 Public Records
- 1979-05-01 Sold (Public Records) $23,500 Public Records
Property tax history
+6.2%/yrLatest (2026): $3,288 · +34.3% YoY. Source: county tax records.
Cash-flow waterfall
monthlySold comps — $/sqft
last 12 mo · ≤1 miLoading sold comps…