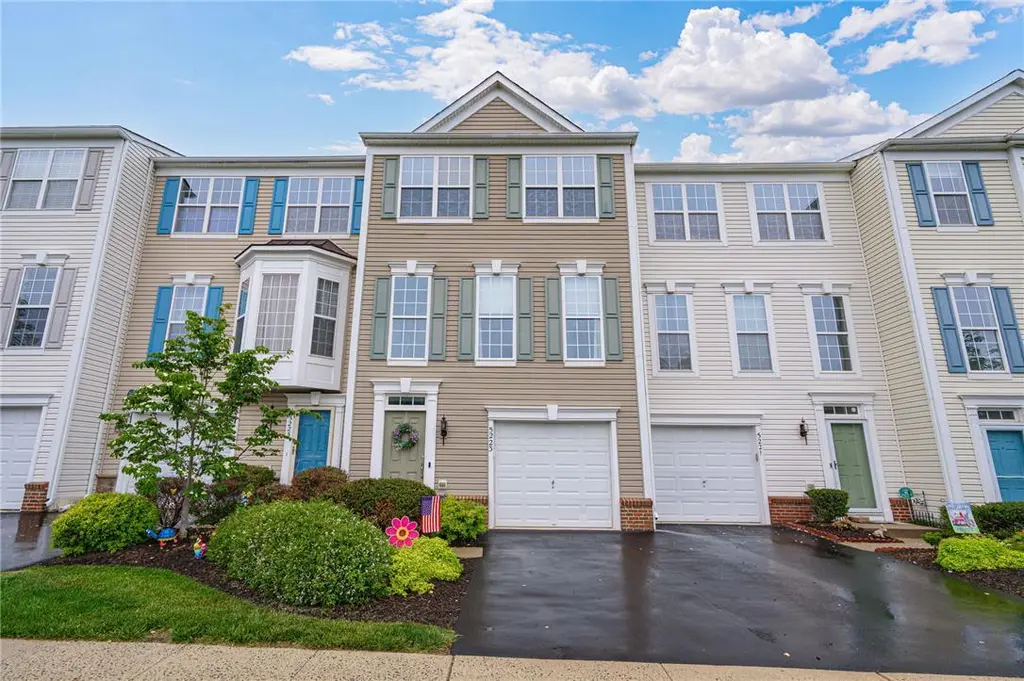
5223 Chandler Way · Cetronia, PA
Flood risk 1/10 · Minimal
- FEMA flood zone
- X (unshaded)
- Chance of flooding over 30 yrs
- 0.0%
- Est. flood insurance / yr
- $507 – $1,088
Fire risk 1/10 · Minimal
- Est. fire insurance / yr
- $511 – $949
Heat risk 4/10 · Minor
- Hot days now (above 99°F)
- 7 days/yr
- Hot days in 30 yrs
- 15 days/yr
Wind risk 4/10 · Minor
- Chance of severe wind over 30 yrs
- 18.0%
Air-quality risk 2/10 · Minimal
- Unhealthy air days now
- 1 days/yr
- Unhealthy air days in 30 yrs
- 3 days/yr
Risk factors via First Street. Map © Google.
Why this score? — see what drove the D+ grade
The composite is a weighted blend of 9 inputs, each scored 0–100. Each bar is that input's sub-score; the figure is the points it added to the 100-point composite (weight × sub-score).
- ARV discount +13.8/15.0
- Cash flow +7.2/30.0
- Schools +5.7/10.0
- Appreciation +5.4/10.0
- Livability +4.7/5.0
- 1% rule +2.8/10.0
- Rent growth +2.5/5.0
- Condition / age +2.5/5.0
- DSCR +1.3/10.0
$349,000
🖨 Deal sheet (PDF) 📄 Offer letter ✓ Due diligence
Listing remarks MLS
Leave your lawn mower and snow shovel behind! Come let the Vistas at Green Hills take care of your exterior maintenance while you make the interior of this townhome your own. The neutral decor throughout is waiting for you to add creativity and life to the 3 bedrooms, 2.5 bathrooms, living room, kitchen, and finished family room on the first floor. The master bedroom features a walk-in closet and private bath with soaking tub and separate shower. The family room opens to the back yard while one floor up, the living room has a sliding door waiting for you to install a deck! One car attached garage.
Key facts
- Updated townhouse
- Walk-in closet
- New lvp flooring
Tags
Property features AI
Finance
- HOA & community: Monthly association fee of $305; Sidewalks in community
Exterior
- Parking: Attached garage; 1 garage space; Off-street parking; On-street parking; Garage door opener
- Utilities: 200+ amp electrical service with circuit breakers; Public water; Public sewer
- Home design: 3-story property; Aluminum siding
- Construction: Built with aluminum siding; Asphalt/fiberglass roof
- Exterior features: Deck; Zoned RR; Lot size from public records
Interior
- Kitchen: Gas oven; Gas range; Dishwasher; Disposal; Refrigerator
- Bedrooms: Total rooms include den and office
- Flooring: Carpet; Luxury vinyl; Luxury vinyl plank
- Bathrooms: 2 full bathrooms; 1 half bathroom
- Heating & cooling: Forced-air gas heating; Central air conditioning
- Interior features: Dining area; Entrance foyer; Home office; Family room on main level; Family room on lower level; Walk-in closets
- Laundry & utility: Washer hookup (main level); Dryer hookup (main level); Washer; Dryer; Gas water heater
Neighborhood map
What this means for you Summary
Snapshot
- This is a 3-bed/2.5-bath townhouse listed at $349k.
Deal economics
- At list price, monthly cash flow is $-486 ($-6k/yr) — negative.
- To cash-flow at today's rent, offer at most $263k (24.6% below list).
- To meet the 1% rule (rent ≥ 1% of price), the offer needs to be $274k (21.6% below list).
- Recommended offer: $263k (24.6% below list) — sets the bar for cash-flow.
Location & tenants
- Location reads 93/100 on livability (#6 in PA, #18 nationally) — a professional / high-income tenant draw. Strengths: crime A+, employment A+, housing A+; Watch: schools D.
- Parkland SD (suburban): math 59% / reading 70% proficiency, ranked #40 of 539 in PA (top 7%) — acceptable for families but not a draw, mixed tenant base, ~2y average lease; only 15% free/reduced lunch — higher-income household profile.
- Market conditions: 51 active listings in the ZIP; 5 comparable units currently listed for rent nearby; rentals at typical pace (median 23d on market — plan ~3-4 weeks tenant-placement turnaround); 40% of comp listings sitting > 30 days — soft ceiling on asking rent; 765 units permitted in Lehigh County in 2024 (286 in 5+ unit buildings).
Forward outlook
- In year one you build about $5k of equity ($2k loan paydown + $3k appreciation (0.9% local appreciation)).
- Lehigh County population projected at +21% by 2050 — long-run rental-demand tailwind backs the buy-and-hold thesis.
- By year 6, paydown + projected appreciation supports a ~$32k cash-out refi (75% LTV) — recoverable capital for the next deal without selling this one.
Negotiation context
- Only 3 days on market — expect competitive offers; lowballing is unlikely to land.
- 5 sale attempts since 18y ago with the ask held roughly flat each time — persistent listings suggest the price (not the market) is what's stuck; bring a comps-based counter.
- Current owner paid $225k; list at $349k implies a 55% gain — meaningful room to come down on a strong offer.
Questions for the listing agent
- What do current leases actually rent for vs. the listed asking? Can we see a recent rent roll and the last 12 months of T-12 income?
- What does the HOA fee cover, when was the last increase, and are there any pending special assessments or reserve-fund shortfalls?
- Is there a deadline driving the sale (1031 exchange, divorce, estate, relocation)? That informs how much negotiation room exists.
- Schools are D-rated, which usually means shorter tenancies and higher turnover. Who's the typical renter profile here, and what's been the actual vacancy rate?
- The area grade is low — what's the realistic commute time and amenity access for the typical tenant pool here? Any planned neighborhood developments (good or bad) we should know about?
- What's the average days-on-market for RENTAL listings here right now (not sales)? A rising rental-DOM trend means longer vacancies and softer asking-rent achievability than the comps imply.
- What's the recent tenant-quality profile in this submarket — average credit score on applications, eviction rate, late-payment / NSF rate, and stable-employment percentage? A property-management company in the area should have these aggregated.
- How much new for-sale + rental construction is in the pipeline within 1–3 miles? Heavy new supply typically softens prices + rents 12–24 months out; constrained supply supports both.
Investment metrics
- 1% rule
- 0.78% ✗
- Cap rate
- 4.62%
- Cash-on-cash
- -5.97%
- DSCR
- 0.73
- GRM
- 10.6
CMA / ARV
- ARV (on-the-fly)
- $405,820
- Comps found
- 12
Show comp detail 12 sales within ~0.75 mi
| Address | Dist | Beds/Ba | Sqft | Sold | Price | $/sf | Match |
|---|---|---|---|---|---|---|---|
| 5255 Chandler Way | 0.09mi | 3/2.5 | 1,970 (0%) | 2mo | $345,000 | $175 | 94 |
| 5219 Chandler Way | 0.01mi | 3/2.5 | 1,970 (0%) | 10mo | $343,000 | $174 | 91 |
| 1838 Hemming Way | 0.07mi | 3/2.5 | 1,878 (-5%) | 11mo | $375,000 | $200 | 80 |
| 1804 Hemming Way | 0.11mi | 3/2.5 | 1,862 (-6%) | 8mo | $345,000 | $185 | 79 |
| 1871 Emerald Dr | 0.21mi | 3/2.5 | 2,068 (+5%) | 6mo | $425,000 | $206 | 77 |
| 1477 Tarpan Ln | 0.39mi | 3/2.5 | 1,899 (-4%) | 2mo | $436,000 | $230 | 74 |
| 1350 Caspian St | 0.48mi | 3/2.5 | 1,922 (-2%) | 0mo | $477,000 | $248 | 73 |
| 1450 Tarpan Ln Unit 1-1 | 0.39mi | 3/2.5 | 1,945 (-1%) | 14mo | $439,900 | $226 | 68 |
| 1835 Emerald Dr | 0.15mi | 3/2.5 | 2,158 (+10%) | 11mo | $431,000 | $200 | 68 |
| 5294 Saddlebred Rd | 0.33mi | 3/2.5 | 1,779 (-10%) | 15mo | $429,900 | $242 | 56 |
| 1458 Tarpan Ln | 0.38mi | 3/2.5 | 1,739 (-12%) | 15mo | $395,000 | $227 | 50 |
| 1362 Black Forest Dr | 0.51mi | 3/2.5 | 2,260 (+15%) | 14mo | $425,000 | $188 | 40 |
Match score weights: distance 35% · size 25% · config 20% · recency 20%. Top-matched comps best support the ARV.
Projected returns pro-forma
0.88% appreciation · 3.0% rent growth · sell at horizon
- IRR
- -5.4%
- Equity multiple
- 0.73×
- Total profit
- $-26,356
- Equity at exit
- $116,919
- IRR
- 0.1%
- Equity multiple
- 1.01×
- Total profit
- $894
- Equity at exit
- $153,669
Cash invested: $97,720 (down + closing). Projections, not guarantees.
Landlord ↔ Tenant lean methodology
- Overall (STATE)
- 62 Landlord-Friendly
- State Pennsylvania
- 62 Landlord-Friendly · EVEN
- County
- — inherits STATE
- City
- — inherits STATE
ZIP-level market 18069
- Home prices YoY
- 0.3%
- Active inventory
- 51
- Price-to-rent
- 10.6×
Monthly cashflow live
- Estimated rent
- $2,736 high interval (Pro) →
- Mortgage (P&I)
- −$1,830
- Tax from tax record
- −$367 /mo · $4,409/yr
- Insurance
- −$145
- HOA
- −$305
- Vacancy / Maint / Mgmt
- −$575
- Net cashflow
- $-486
Break-even live
Sensitivity live
| Price | -10% $-289 | -5% $-388 | +0% $-486 | +5% $-585 | +10% $-684 |
|---|---|---|---|---|---|
| Rent | -10% $-703 | -5% $-594 | +0% $-486 | +5% $-378 | +10% $-270 |
| Rate | -1.0pp $-311 | -0.5pp $-398 | base $-486 | +0.5pp $-577 | +1.0pp $-669 |
UW: 25.0% down · 7.5% · 30yr · 1.5% tax · 5.0% vac · 8.0% maint · 8.0% mgmt
Financing live
Cash to close
- Down payment
- $87,250
- Closing costs
- $10,470
- Reserves months
- —
- Total cash needed
- —
Loan-product check · same deal, 3 products live
Conventional
25% down · 7.5% · 30yr
- Down + closing
- —
- Monthly P&I
- —
- Monthly cashflow
- —
- DSCR
- —
- Eligible?
- —
Personal DTI + credit; lowest rate.
DSCR
20% down · 8.5% · 30yr
- Down + closing
- —
- Monthly P&I
- —
- Monthly cashflow
- —
- DSCR
- —
- Eligible?
- —
No personal income docs; deal must DSCR.
Hard money
10% down · 12.0% · 12mo
- Down + closing
- —
- Monthly P&I
- —
- Monthly cashflow
- —
- DSCR
- —
- Eligible?
- —
Short-term bridge; refi at stabilization.
Rent comps 5 comps
| Address | Beds | Baths | Sqft | Rent | $/sqft | DOM | Units | Dist |
|---|---|---|---|---|---|---|---|---|
| 1477 Tarpan Ln Allentown, PA | 3.0 | 1.5 | 1899 | $2,700 | $1.42 | 45d | 1 | 0.40mi |
| 5335 Jutland Rd Allentown, PA | 3.0 | 2.5 | 1899 | $2,700 | $1.42 | 45d | 1 | 0.43mi |
| 5380 Jutland Rd Allentown, PA | 3.0 | 2.5 | 1971 | $2,700 | $1.37 | 22d | 1 | 0.47mi |
| 1350 Caspian St Allentown, PA | 3.0 | 2.5 | 1922 | $2,775 | $1.44 | 4d | 1 | 0.49mi |
| 5265 Rockrose Ln Allentown, PA | 1.0–2.0 | 1.0–2.0 | 1400 | $3,080 | $2.20 | 4d | 21 | 1.46mi |
HOA detail
- Monthly dues
- $305 · $3,660/yr
- Likely covers
- exterior maint.
Listing history 10 events
-
2026-05-23$349,000 Active
-
2020-07-21soldstatus $224,900
-
2012-07-11soldstatus $166,100 605-char remark
Show marketing remark (605 chars)
Leave your lawn mower and snow shovel behind! Come let the Vistas at Green Hills take care of your exterior maintenance while you make the interior of this townhome your own. The neutral decor throughout is waiting for you to add creativity and life to the 3 bedrooms, 2.5 bathrooms, living room, kitchen, and finished family room on the first floor. The master bedroom features a walk-in closet and private bath with soaking tub and separate shower. The family room opens to the back yard while one floor up, the living room has a sliding door waiting for you to install a deck! One car attached garage.
-
2012-03-29$160,700 605-char remark
Show marketing remark (605 chars)
Leave your lawn mower and snow shovel behind! Come let the Vistas at Green Hills take care of your exterior maintenance while you make the interior of this townhome your own. The neutral decor throughout is waiting for you to add creativity and life to the 3 bedrooms, 2.5 bathrooms, living room, kitchen, and finished family room on the first floor. The master bedroom features a walk-in closet and private bath with soaking tub and separate shower. The family room opens to the back yard while one floor up, the living room has a sliding door waiting for you to install a deck! One car attached garage.
-
2009-12-05historical
-
2009-12-03$210,000
-
2009-07-10historical
-
2009-05-19$210,000
-
2009-05-18historical
-
2008-11-17$210,000
ⓘ Source: listings_history table (triggers on properties + properties_extension) + one-shot
backfill from property_details.listing_events for pre-trigger history.
Tax reassessment forecast PA · Partial reset (capped growth)
- Current annual tax
- $4,409 · $367/mo
- Projected year-2 tax
- $4,961 · $413/mo
- Expected delta
- +$553/yr (+$46/mo · 12.5%)
ⓘ Screening estimate from a state-policy table — verify with the county assessor before closing.
Climate risk First Street
- Flood 1/10 Low FEMA zone X (unshaded) · 0% chance over 30 yrs
- Wildfire 1/10 Low
- Heat 4/10 Moderate 7 d/yr ≥99°F today · 15 d/yr by 30 yrs out
- Wind 4/10 Moderate 18% chance of damaging wind over 30 yrs
- Air quality 2/10 Low 1 unhealthy d/yr today · 3 by 30 yrs out
Nearby sold comps map
Loading sold comps map…
Walkable amenities ~0.75 mi
Loading nearby amenities…
Taxation est. · year 1
- Rental income
- $32,835
- − Mortgage interest
- −$19,549
- − Property taxes
- −$4,409
- − Insurance
- −$1,745
- − Repairs & maintenance
- −$2,627
- − Management
- −$2,627
- − HOA
- −$3,660
- − Depreciation
- −$10,153
- Taxable loss
- −$11,935
- Est. tax savings @ 24.0%
- +$2,864
- After-tax cash flow
- $-2,972/yr
For passive investors: Depreciation is non-cash, so a rental often shows a tax loss while cash-flowing — sheltering income. Rental losses are passive: they offset passive income freely, and up to $25,000/yr can offset ordinary (W-2) income if you actively participate and your MAGI is under $100k (phasing out to $0 by $150k); unused losses carry forward. On sale, claimed depreciation is recaptured at up to 25%, and gains may owe capital-gains tax (a 1031 exchange can defer both). Figures are a year-1 estimate at your 24.0% rate — not tax advice; consult a CPA.
Schools (NCES district)
- District
- Parkland SD
- NCES district ID
- 4218510
- Math proficiency
- 59% ▼ -11.00%
- Reading proficiency
- 70% ▼ -12.00%
- Median HH income
- $77,976
- Composite
- 57.44/100
- National rank
- #1074
- State rank
- #40 of 539 in PA
Livability — Cetronia
- Score
- 93/100
- State rank
- #6
- US rank
- #18
Category grades
Schools grade is shown separately in the Schools card above.
Census & demographics
- Population (ZIP)
- 8,804
Population outlook (Lehigh County) Hauer SSP2
- Today (2025)
- 392,957 people
- By 2030
- 408,319 · +3.9%
- By 2040
- 440,007 · +12.0%
- By 2050
- 475,940 · +21.1%
- By 2075
- 590,448 · +50.3%
- By 2100
- 690,314 · +75.7%
Race, ethnicity, and origin ACS 2023
- Neighborhood character
- Predominantly White (77%)
- Race & ethnicity
- White 77% Hispanic / Latino 9% Two or more races 8% Asian 8% Black 2%
- Hispanic origin (detail)
- Mexican 2% Puerto Rican 5%
- Common ancestry
- Scotch-Irish 6% Romanian 3% Lithuanian 3%
- Foreign-born
- 10% · Canada, South Korea, China
- Languages at home
- 87% English-only · Spanish 5% Other Indo-European 2% Chinese 2%
Political lean MEDSL · Lehigh
- 2024 margin
- Toss-up / Even · D 50.7% · R 48.0% · Other 1.2%
- 2008→2024 swing
- -12.9pp toward R · 2008: 15.6pp · 2024: 2.7pp
- All cycles
- 2024: D+2.7 2020: D+7.6 2016: D+4.4 2012: D+7.5 2008: D+15.6
Not yet ingested
- Civics
- —
Market trends
- HPI YoY
- ▲ 0.88%
- Current HPI
- 277.9781
- Rent YoY
- —
- Metro
- —
- State GDP YoY
- ▲ 1.68%
- F500 in state
- 34
Industry mix (Fortune 500 HQ in PA)
| Industry | F500 HQs | Revenue |
|---|---|---|
| Healthcare | 2 | $309B |
|
||
| Insurance | 2 | $27B |
|
||
| Telecommunications / Media | 1 | $124B |
|
||
| Industrial Distribution | 1 | $22B |
|
||
| Financial Services | 1 | $20B |
|
||
| Chemicals / Materials | 1 | $18B |
|
||
Price history
+66.2% since first listed10 events — show timeline
- 2026-05-23 Listed $349,000 GLVRMLS
- 2020-07-21 Sold (Public Records) $224,900 Public Records
- 2012-07-11 Sold (MLS) $166,100 GLVRMLS
- 2012-03-29 Listed $160,700 GLVRMLS
- 2009-12-05 Listing Removed — GLVRMLS
- 2009-12-03 Listed $210,000 GLVRMLS
- 2009-07-10 Listing Removed — GLVRMLS
- 2009-05-19 Listed $210,000 GLVRMLS
- 2009-05-18 Listing Removed — GLVRMLS
- 2008-11-17 Listed $210,000 GLVRMLS
Property tax history
+2.1%/yrLatest (2026): $4,409 · +3.9% YoY. Source: county tax records.
Cash-flow waterfall
monthlySold comps — $/sqft
last 12 mo · ≤1 miLoading sold comps…