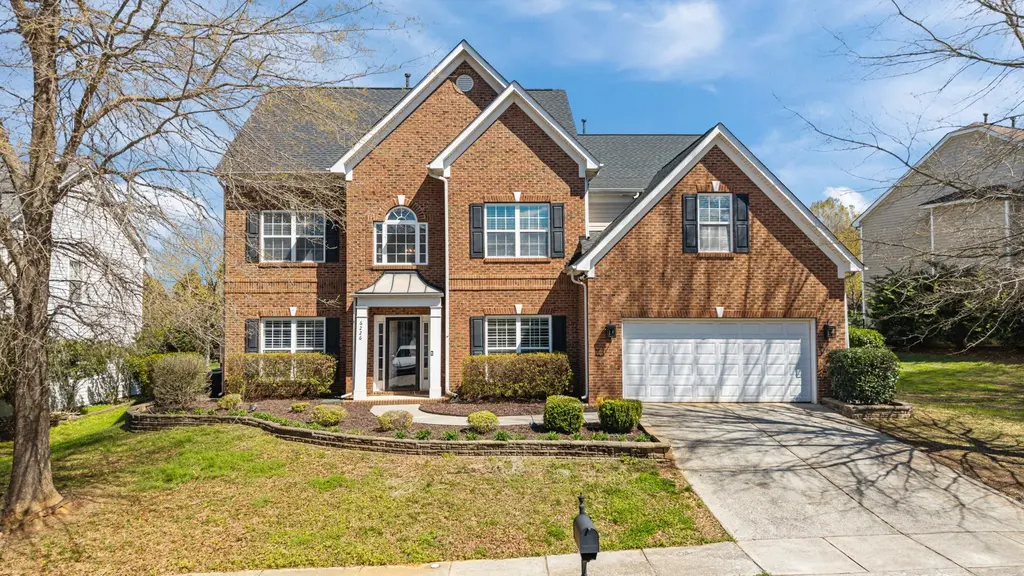
6226 Hermsley Rd · Charlotte, NC
Flood risk 1/10 · Minimal
- FEMA flood zone
- X (unshaded)
- Chance of flooding over 30 yrs
- 0.0%
- Est. flood insurance / yr
- $507 – $1,088
Fire risk 3/10 · Minor
- Est. fire insurance / yr
- $906 – $1,684
Heat risk 6/10 · Moderate
- Hot days now (above 104°F)
- 7 days/yr
- Hot days in 30 yrs
- 17 days/yr
Wind risk 5/10 · Moderate
- Chance of severe wind over 30 yrs
- 25.0%
Air-quality risk 3/10 · Minor
- Unhealthy air days now
- 3 days/yr
- Unhealthy air days in 30 yrs
- 4 days/yr
Risk factors via First Street. Map © Google.
Why this score? — see what drove the F grade
The composite is a weighted blend of 9 inputs, each scored 0–100. Each bar is that input's sub-score; the figure is the points it added to the 100-point composite (weight × sub-score).
- ARV discount +7.0/15.0
- Cash flow +4.8/30.0
- Livability +3.9/5.0
- Schools +3.8/10.0
- Condition / age +2.5/5.0
- Rent growth +2.3/5.0
- 1% rule +0.0/10.0
- DSCR +0.0/10.0
- Appreciation +0.0/10.0
$650,000
🖨 Deal sheet (PDF) 📄 Offer letter ✓ Due diligence
Listing remarks
Rare Opportunity in Southwest Charlotte! Discover this stunning 6-bedroom, 4.5-bathroom estate where luxury meets functional living. Spanning three levels and over 4,300 square feet, this home features elegant hardwood floors and soaring tray ceilings throughout. The gourmet chef’s kitchen is an entertainer’s dream, boasting granite countertops, a center island, and a breakfast nook that opens to a fenced-in backyard. With separate formal dining, a spacious great room, and expansive bonus rooms on the upper floors, there is no shortage of space. Enjoy a two-car garage, freshly updated landscaping, and a flat backyard perfect for relaxation. Residents also have access to world-cl
Key facts
- Flat backyard
- Fenced-in backyard
- Multiple pools
Tags
Property features AI
Finance
- Other: Zoning: MX-1
- HOA & community: Homeowner association managed by William Douglas Management Group; HOA required; Quarterly HOA fee of $200 (approximately $800 annually)
Exterior
- Parking: Attached garage with space for 2 cars
- Utilities: City water; Public sewer; Underground power lines
- Home design: Single-family residential property; Site-built construction; Three levels
- Construction: Brick partial and vinyl exterior; Slab foundation
- Exterior features: In-ground irrigation; Gazebo; Concrete and paved roads; publicly maintained
Interior
- Kitchen: Bar fridge; Convection oven; Dishwasher; Exhaust fan; Gas cooktop; Microwave; Oven; Refrigerator; Self-cleaning oven; Wall oven; Gas water heater
- Bedrooms: Six bedrooms total — five on the upper level, one on the third level
- Bathrooms: Four full bathrooms and one half bathroom
- Heating & cooling: Central heating; Central air; Ceiling fan(s)
- Interior features: 19 total rooms; Living room fireplace; Central heating; Ceiling fans and central air conditioning
- Laundry & utility: Laundry located on the upper level
Neighborhood map
What this means for you Summary
Snapshot
- This is a 5-bed/4.5-bath single-family listed at $650k.
Deal economics
- At list price, monthly cash flow is $-2k ($-19k/yr) — negative.
- To cash-flow at today's rent, offer at most $369k (43.3% below list).
- To meet the 1% rule (rent ≥ 1% of price), the offer needs to be $319k (50.9% below list).
- Recommended offer: $319k (50.9% below list) — sets the bar for 1% rule.
Location & tenants
- Location reads 78/100 on livability (#26 in NC, #2,502 nationally) — a middle-class / working-renter tenant base. Strengths: amenities A+, commute A+, housing A+; Watch: crime F.
- Charlotte-Mecklenburg Schools (urban): math 42% / reading 46% proficiency, ranked #85 of 178 in NC (top 48%) — families likely to look elsewhere, expect single-tenant / working-renter base with shorter leases.
- Zoned schools: Berewick Elementary (math 26% / reading 30%, grade F, #1,022 of 1,410 statewide, top 73%, 702 students, 49% FRL); Olympic High School (math 50% / reading 55%, grade C-, #287 of 535 statewide, top 54%, 1,729 students, 41% FRL) — zoned schools at 45% FRL track the district average.
- Market conditions: Rents soft (-0.9%/yr); 444 active listings in the ZIP; 4 comparable units currently listed for rent nearby; rentals at typical pace (median 22d on market — plan ~3-4 weeks tenant-placement turnaround); high-income renter base; 11,969 units permitted in Mecklenburg County in 2024 (5,377 in 5+ unit buildings).
- This rent runs 31% of the median local income ($125k/yr) — at the standard rent-burdened threshold; future hikes will face affordability resistance.
Forward outlook
- Local home prices are declining (-3.0%/yr); year-one equity from $4k of loan paydown is wiped out by about $20k of value loss. Plan a longer hold.
- Mecklenburg County population projected at +53% by 2050 — long-run rental-demand tailwind backs the buy-and-hold thesis.
Negotiation context
- It's been on market 61 days — a 6% lower offer ($611k) is reasonable based on typical stale-listing flexibility.
Risks & watch-outs
- Climate carrying-cost: moderate wind risk, 25% chance of damaging wind over 30y; extreme-heat days projected 7→17/yr by 2055 (HVAC capex compounding) — expect insurance premiums to compound above CPI over the hold.
Questions for the listing agent
- What do current leases actually rent for vs. the listed asking? Can we see a recent rent roll and the last 12 months of T-12 income?
- It's been on market 61 days. Have you received any prior offers? Is the seller open to a 51% concession, seller financing, or rate buy-down credit?
- What does the HOA fee cover, when was the last increase, and are there any pending special assessments or reserve-fund shortfalls?
- Why hasn't it sold? Are there any deal-killer items the seller is aware of (foundation, flood, title, zoning, code violations)?
- Is there a deadline driving the sale (1031 exchange, divorce, estate, relocation)? That informs how much negotiation room exists.
- Schools are D-rated, which usually means shorter tenancies and higher turnover. Who's the typical renter profile here, and what's been the actual vacancy rate?
- Crime grade is F in this area — have there been break-ins, vandalism, or insurance claims at this property in the last 3 years? What carrier currently insures it and at what premium?
- The area grade is low — what's the realistic commute time and amenity access for the typical tenant pool here? Any planned neighborhood developments (good or bad) we should know about?
- What's the average days-on-market for RENTAL listings here right now (not sales)? A rising rental-DOM trend means longer vacancies and softer asking-rent achievability than the comps imply.
- What's the recent tenant-quality profile in this submarket — average credit score on applications, eviction rate, late-payment / NSF rate, and stable-employment percentage? A property-management company in the area should have these aggregated.
- How much new for-sale + rental construction is in the pipeline within 1–3 miles? Heavy new supply typically softens prices + rents 12–24 months out; constrained supply supports both.
Investment metrics
- 1% rule
- 0.49% ✗
- Cap rate
- 3.35%
- Cash-on-cash
- -10.51%
- DSCR
- 0.53
- GRM
- 17.0
CMA / ARV
- ARV (on-the-fly)
- $643,160
- Comps found
- 4
Show comp detail 4 sales within ~0.75 mi
| Address | Dist | Beds/Ba | Sqft | Sold | Price | $/sf | Match |
|---|---|---|---|---|---|---|---|
| 5709 Selkirkshire Rd | 0.67mi | 4/3.5 (-1) | 4,640 (+1%) | 8mo | $537,000 | $116 | 52 |
| 10316 Lauder Ct | 0.40mi | 5/3.0 | 4,148 (-10%) | 16mo | $580,000 | $140 | 46 |
| 10452 Quiet Bay Ct | 0.63mi | 5/3.5 | 4,071 (-11%) | 8mo | $1,020,000 | $251 | 40 |
| 6702 Carradale Way | 0.65mi | 4/4.5 (-1) | 4,186 (-9%) | 13mo | $560,000 | $134 | 39 |
Match score weights: distance 35% · size 25% · config 20% · recency 20%. Top-matched comps best support the ARV.
Projected returns pro-forma
-3.0% appreciation · 0.0% rent growth · sell at horizon
- IRR
- -38.2%
- Equity multiple
- -0.19×
- Total profit
- $-216,345
- Equity at exit
- $96,917
- IRR
- -77.1%
- Equity multiple
- -0.96×
- Total profit
- $-355,941
- Equity at exit
- $56,200
Cash invested: $182,000 (down + closing). Projections, not guarantees.
Landlord ↔ Tenant lean methodology
- Overall (STATE)
- 85 Strongly Landlord-Friendly
- State North Carolina
- 85 Strongly Landlord-Friendly · R+3
- County
- — inherits STATE
- City
- — inherits STATE
ZIP-level market 28278
- Home prices YoY
- -31.3%
- Rents YoY
- -0.9%
- Active inventory
- 444
- Price-to-rent
- 17.0×
Monthly cashflow live
- Estimated rent
- $3,189 medium interval (Pro) →
- Mortgage (P&I)
- −$3,409
- Tax from tax record
- −$367 /mo · $4,399/yr
- Insurance
- −$271
- HOA
- −$67
- Vacancy / Maint / Mgmt
- −$670
- Net cashflow
- $-1,593
Break-even live
Sensitivity live
| Price | -10% $-1,225 | -5% $-1,409 | +0% $-1,593 | +5% $-1,777 | +10% $-1,961 |
|---|---|---|---|---|---|
| Rent | -10% $-1,845 | -5% $-1,719 | +0% $-1,593 | +5% $-1,467 | +10% $-1,341 |
| Rate | -1.0pp $-1,266 | -0.5pp $-1,428 | base $-1,593 | +0.5pp $-1,762 | +1.0pp $-1,933 |
UW: 25.0% down · 7.5% · 30yr · 1.5% tax · 5.0% vac · 8.0% maint · 8.0% mgmt
Financing live
Cash to close
- Down payment
- $162,500
- Closing costs
- $19,500
- Reserves months
- —
- Total cash needed
- —
Loan-product check · same deal, 3 products live
Conventional
25% down · 7.5% · 30yr
- Down + closing
- —
- Monthly P&I
- —
- Monthly cashflow
- —
- DSCR
- —
- Eligible?
- —
Personal DTI + credit; lowest rate.
DSCR
20% down · 8.5% · 30yr
- Down + closing
- —
- Monthly P&I
- —
- Monthly cashflow
- —
- DSCR
- —
- Eligible?
- —
No personal income docs; deal must DSCR.
Hard money
10% down · 12.0% · 12mo
- Down + closing
- —
- Monthly P&I
- —
- Monthly cashflow
- —
- DSCR
- —
- Eligible?
- —
Short-term bridge; refi at stabilization.
Rent comps 4 comps
| Address | Beds | Baths | Sqft | Rent | $/sqft | DOM | Units | Dist |
|---|---|---|---|---|---|---|---|---|
| 6710 Carradale Way Charlotte, NC | 4.0 | 3.5 | 3590 | $3,500 | $0.97 | 13d | 1 | 0.65mi |
| 6911 Agnew Dr Charlotte, NC | 5.0 | 4.5 | 3400 | $3,000 | $0.88 | 21d | 1 | 0.94mi |
| 10620 Candlestick Ct Charlotte, NC | 5.0 | 3.0 | 3232 | $2,820 | $0.87 | 0d | 1 | 1.14mi |
| 11940 Springpoint Ln Unit 1293792P Charlotte, NC | 4.0 | 3.0 | 3498 | $21,389 | $6.11 | 25d | 1 | 1.16mi |
HOA detail
- Monthly dues
- $67 · $804/yr
- Likely covers
- landscaping
Listing history 2 events
-
2026-05-21status Pending
-
2026-03-20$650,000 Active
ⓘ Source: listings_history table (triggers on properties + properties_extension) + one-shot
backfill from property_details.listing_events for pre-trigger history.
Tax reassessment forecast NC · Resets to sale price
- Current annual tax
- $4,399 · $367/mo
- Projected year-2 tax
- $5,330 · $444/mo
- Expected delta
- +$931/yr (+$78/mo · 21.2%)
ⓘ Screening estimate from a state-policy table — verify with the county assessor before closing.
Climate risk First Street
- Flood 1/10 Low FEMA zone X (unshaded) · 0% chance over 30 yrs
- Wildfire 3/10 Moderate
- Heat 6/10 Major 7 d/yr ≥104°F today · 17 d/yr by 30 yrs out
- Wind 5/10 Major 25% chance of damaging wind over 30 yrs
- Air quality 3/10 Moderate 3 unhealthy d/yr today · 4 by 30 yrs out
Nearby sold comps map
Loading sold comps map…
Walkable amenities ~0.75 mi
Loading nearby amenities…
Taxation est. · year 1
- Rental income
- $38,274
- − Mortgage interest
- −$36,410
- − Property taxes
- −$4,399
- − Insurance
- −$3,250
- − Repairs & maintenance
- −$3,062
- − Management
- −$3,062
- − HOA
- −$804
- − Depreciation
- −$18,909
- Taxable loss
- −$31,622
- Est. tax savings @ 24.0%
- +$7,589
- After-tax cash flow
- $-11,532/yr
For passive investors: Depreciation is non-cash, so a rental often shows a tax loss while cash-flowing — sheltering income. Rental losses are passive: they offset passive income freely, and up to $25,000/yr can offset ordinary (W-2) income if you actively participate and your MAGI is under $100k (phasing out to $0 by $150k); unused losses carry forward. On sale, claimed depreciation is recaptured at up to 25%, and gains may owe capital-gains tax (a 1031 exchange can defer both). Figures are a year-1 estimate at your 24.0% rate — not tax advice; consult a CPA.
Schools (NCES district)
- District
- Charlotte-Mecklenburg Schools
- NCES district ID
- 3702970
- Math proficiency
- 42% ▼ -6.00%
- Reading proficiency
- 46% ▲ 1.00%
- Median HH income
- $57,175
- Composite
- 38.49/100
- National rank
- #4183
- State rank
- #85 of 178 in NC
Livability — Charlotte
- Score
- 78/100
- State rank
- #26
- US rank
- #2502
Category grades
Schools grade is shown separately in the Schools card above.
Census & demographics
- Census place
- Charlotte, NC
- County
- Mecklenburg County · 1,167,319 people
- City population
- 920,422
- Metro
- Charlotte-Concord-Gastonia, NC-SC
- Population (ZIP)
- 37,420
- Household income
- $125,470
- Rent vs Own
- Severe rent burden
- 711.0
Population outlook (Mecklenburg County) Hauer SSP2
- Today (2025)
- 1,305,740 people
- By 2030
- 1,442,752 · +10.5%
- By 2040
- 1,722,441 · +31.9%
- By 2050
- 1,999,450 · +53.1%
- By 2075
- 2,642,495 · +102.4%
- By 2100
- 3,106,755 · +137.9%
Race, ethnicity, and origin ACS 2023
- Neighborhood character
- Highly diverse neighborhood (Simpson 0.72)
- Race & ethnicity
- White 38% Black 33% Hispanic / Latino 13% Two or more races 12% Asian 9%
- Hispanic origin (detail)
- Mexican 3% Puerto Rican 2%
- Common ancestry
- Romanian 2% Serbian 2% Slovak 1%
- Foreign-born
- 16% · Canada, Vietnam, Jamaica
- Languages at home
- 77% English-only · Spanish 12% Vietnamese 3% Other Indo-European 2%
Political lean MEDSL · Mecklenburg
- 2024 margin
- Solid D (+32.9) · D 65.6% · R 32.7% · Other 1.6%
- 2008→2024 swing
- +8.5pp toward D · 2008: 24.4pp · 2024: 32.9pp
- All cycles
- 2024: D+32.9 2020: D+35.1 2016: D+29.9 2012: D+22.5 2008: D+24.4
Not yet ingested
- Civics
- —
Market trends
- HPI YoY
- ▼ -103.57%
- Current HPI
- 227.2991
- Rent YoY
- ▼ -0.93%
- Metro
- Charlotte-Concord-Gastonia, NC-SC
- State GDP YoY
- ▲ 3.28%
- F500 in state
- 26
Industry mix (Fortune 500 HQ in NC)
| Industry | F500 HQs | Revenue |
|---|---|---|
| Financial Services | 2 | $213B |
|
||
| Retail | 2 | $95B |
|
||
| Industrial Conglomerate | 1 | $38B |
|
||
| Metals / Steel | 1 | $35B |
|
||
| Utilities | 1 | $30B |
|
||
| Industrial Machinery | 1 | $19B |
|
||
Price history
2 events — show timeline
- 2026-05-21 Pending — CANOPYMLS as Distributed by MLS Grid
- 2026-03-20 Listed $650,000 CANOPYMLS as Distributed by MLS Grid
Property tax history
+2.5%/yrLatest (2025): $4,399 · +1.7% YoY. Source: county tax records.
Cash-flow waterfall
monthlySold comps — $/sqft
last 12 mo · ≤1 miLoading sold comps…