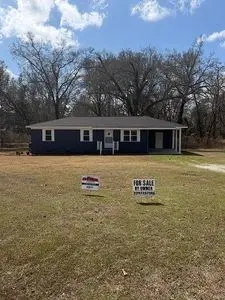
118 Kathy St · Leesburg, GA
Flood risk 1/10 · Minimal
- FEMA flood zone
- X (unshaded)
- Chance of flooding over 30 yrs
- 0.0%
- Est. flood insurance / yr
- $507 – $1,088
Fire risk 4/10 · Minor
- Est. fire insurance / yr
- $963 – $1,789
Heat risk 7/10 · Major
- Hot days now (above 109°F)
- 7 days/yr
- Hot days in 30 yrs
- 19 days/yr
Wind risk 8/10 · Major
- Chance of severe wind over 30 yrs
- 90.0%
Air-quality risk 4/10 · Minor
- Unhealthy air days now
- 6 days/yr
- Unhealthy air days in 30 yrs
- 6 days/yr
Risk factors via First Street. Map © Google.
Why this score? — see what drove the D+ grade
The composite is a weighted blend of 9 inputs, each scored 0–100. Each bar is that input's sub-score; the figure is the points it added to the 100-point composite (weight × sub-score).
- Cash flow +18.9/30.0
- ARV discount +7.5/15.0
- DSCR +6.0/10.0
- 1% rule +4.0/10.0
- Schools +3.9/10.0
- Livability +3.4/5.0
- Rent growth +3.1/5.0
- Condition / age +2.5/5.0
- Appreciation +0.0/10.0
$180,000
🖨 Deal sheet 📄 Offer letter ✓ Due diligence
Listing remarks
Charming home located in the heart of Leesburg, convenient to downtown and all local schools. Many recent updates include a new HVAC system with new duct and vapor barrier, new windows, New Water Heater, New countertops, new flooring, New Paint inside and out. A MUST SEE!
Key facts
- New flooring
- New water heater
- New paint
Tags
Neighborhood map
What this means for you Summary
Snapshot
- This is a 3-bed/1.5-bath single-family listed at $180k.
Deal economics
- At list price, monthly cash flow is $186 ($2k/yr) — positive.
- The deal already cash-flows at list — no discount required.
- To meet the 1% rule (rent ≥ 1% of price), the offer needs to be $163k (9.6% below list).
- Recommended offer: $163k (9.6% below list) — sets the bar for 1% rule.
Location & tenants
- Location reads 68/100 on livability (#135 in GA) — a middle-class / working-renter tenant base. Strengths: crime A+, cost of living A+, housing A+; Watch: employment C-, amenities F, commute F.
- Lee County (rural): math 44% / reading 45% proficiency, ranked #21 of 174 in GA (top 12%) — families likely to look elsewhere, expect single-tenant / working-renter base with shorter leases.
- Market conditions: Rents rising (+2.2%/yr); 203 active listings in the ZIP; 3 comparable units currently listed for rent nearby; rentals at typical pace (median 21d on market — plan ~3-4 weeks tenant-placement turnaround); solid renter incomes; 133 units permitted in Lee County in 2024 (0 in 5+ unit buildings).
Forward outlook
- Local home prices are declining (-3.0%/yr); year-one equity from $1k of loan paydown is wiped out by about $5k of value loss. Plan a longer hold.
- Lee County population projected at +8% by 2050 — modest demand growth; plan on rents tracking national, not racing it.
Negotiation context
- It's been on market 24 days — a 2% lower offer ($177k) is reasonable based on typical stale-listing flexibility.
Risks & watch-outs
- Climate carrying-cost: severe wind risk, 90% chance of damaging wind over 30y; extreme-heat days projected 7→19/yr by 2055 (HVAC capex compounding) — expect insurance premiums to compound above CPI over the hold.
Questions for the listing agent
- Is there a deadline driving the sale (1031 exchange, divorce, estate, relocation)? That informs how much negotiation room exists.
- The area grade is low — what's the realistic commute time and amenity access for the typical tenant pool here? Any planned neighborhood developments (good or bad) we should know about?
- What's the average days-on-market for RENTAL listings here right now (not sales)? A rising rental-DOM trend means longer vacancies and softer asking-rent achievability than the comps imply.
- What's the recent tenant-quality profile in this submarket — average credit score on applications, eviction rate, late-payment / NSF rate, and stable-employment percentage? A property-management company in the area should have these aggregated.
- How much new for-sale + rental construction is in the pipeline within 1–3 miles? Heavy new supply typically softens prices + rents 12–24 months out; constrained supply supports both.
Investment metrics
- 1% rule
- 0.90% ✗
- Cap rate
- 7.53%
- Cash-on-cash
- 4.42%
- DSCR
- 1.20
- GRM
- 9.2
CMA / ARV
- ARV (on-the-fly)
- $61,950
- Comps found
- 1
Show comp detail 1 sale within ~0.75 mi
| Address | Dist | Beds/Ba | Sqft | Sold | Price | $/sf | Match |
|---|---|---|---|---|---|---|---|
| 146 Pine Ave | 0.31mi | 3/1.0 | 950 (-10%) | 21mo | $56,500 | $59 | 50 |
Match score weights: distance 35% · size 25% · config 20% · recency 20%. Top-matched comps best support the ARV.
Projected returns pro-forma
-3.0% appreciation · 2.22% rent growth · sell at horizon
- IRR
- -10.2%
- Equity multiple
- 0.63×
- Total profit
- $-18,668
- Equity at exit
- $26,839
- IRR
- -1.9%
- Equity multiple
- 0.87×
- Total profit
- $-6,401
- Equity at exit
- $15,563
Cash invested: $50,400 (down + closing). Projections, not guarantees.
Landlord ↔ Tenant lean methodology
- Overall (STATE)
- 90 Strongly Landlord-Friendly
- State Georgia
- 90 Strongly Landlord-Friendly · R+3
- County
- — inherits STATE
- City
- — inherits STATE
ZIP-level market 31763
- Home prices YoY
- -15.9%
- Rents YoY
- 2.2%
- Active inventory
- 203
- Price-to-rent
- 9.2×
Monthly cashflow live
- Estimated rent
- $1,627 medium interval (Pro) →
- Mortgage (P&I)
- −$944
- Tax from tax record
- −$81 /mo · $968/yr
- Insurance
- −$75
- HOA
- −$0
- Vacancy / Maint / Mgmt
- −$342
- Net cashflow
- $186
Break-even live
UW: 25.0% down · 7.5% · 30yr · 1.5% tax · 5.0% vac · 8.0% maint · 8.0% mgmt
Financing live
Cash to close
- Down payment
- $45,000
- Closing costs
- $5,400
- Reserves months
- —
- Total cash needed
- —
Loan-product check · same deal, 3 products live
Conventional
25% down · 7.5% · 30yr
- Down + closing
- —
- Monthly P&I
- —
- Monthly cashflow
- —
- DSCR
- —
- Eligible?
- —
Personal DTI + credit; lowest rate.
DSCR
20% down · 8.5% · 30yr
- Down + closing
- —
- Monthly P&I
- —
- Monthly cashflow
- —
- DSCR
- —
- Eligible?
- —
No personal income docs; deal must DSCR.
Hard money
10% down · 12.0% · 12mo
- Down + closing
- —
- Monthly P&I
- —
- Monthly cashflow
- —
- DSCR
- —
- Eligible?
- —
Short-term bridge; refi at stabilization.
Rent comps 3 comps
| Address | Beds | Baths | Sqft | Rent | $/sqft | DOM | Units | Dist |
|---|---|---|---|---|---|---|---|---|
| 154 Nacoochee Dr Leesburg, GA | 3.0 | 2.0 | 1040 | $1,395 | $1.34 | 21d | 1 | 0.49mi |
| 110 Twelve Oaks Ct Leesburg, GA | 3.0 | 2.0 | 1277 | $1,465 | $1.15 | 21d | 1 | 0.69mi |
| 103 Ducker Ct Leesburg, GA | 3.0 | 2.0 | 1491 | $1,535 | $1.03 | 43d | 1 | 0.97mi |
Listing history 18 events
-
2026-06-19days on market $180,000 Active 24 DOM
-
2026-06-18days on market $180,000 Active 23 DOM
-
2026-06-17days on market $180,000 Active 22 DOM
-
2026-06-16days on market $180,000 Active 21 DOM
-
2026-06-15days on market $180,000 Active 20 DOM
-
2026-06-14days on market $180,000 Active 18 DOM
-
2026-06-13days on market $180,000 Active 17 DOM
-
2026-06-10days on market $180,000 Active 15 DOM
-
2026-06-09days on market $180,000 Active 14 DOM
-
2026-06-08days on market $180,000 Active 13 DOM
-
2026-06-07days on market $180,000 Active 12 DOM
-
2026-06-05days on market $180,000 Active 9 DOM
-
2026-06-03days on market $180,000 Active 8 DOM
-
2026-06-02days on market $180,000 Active 7 DOM
-
2026-06-01days on market $180,000 Active 6 DOM
-
2026-05-31days on market $180,000 Active 5 DOM
-
2026-05-30days on market $180,000 Active 4 DOM
-
2026-05-26$180,000 Active
ⓘ Source: listings_history table (triggers on properties + properties_extension) + one-shot
backfill from property_details.listing_events for pre-trigger history.
Tax reassessment forecast GA · Resets to sale price
- Current annual tax
- $968 · $81/mo
- Projected year-2 tax
- $1,656 · $138/mo
- Expected delta
- +$688/yr (+$57/mo · 71.1%)
ⓘ Screening estimate from a state-policy table — verify with the county assessor before closing.
Climate risk First Street
- Flood 1/10 Low FEMA zone X (unshaded) · 0% chance over 30 yrs
- Wildfire 4/10 Moderate
- Heat 7/10 Severe 7 d/yr ≥109°F today · 19 d/yr by 30 yrs out
- Wind 8/10 Severe 90% chance of damaging wind over 30 yrs
- Air quality 4/10 Moderate 6 unhealthy d/yr today · 6 by 30 yrs out
Nearby sold comps map
Loading sold comps map…
Walkable amenities ~0.75 mi
Loading nearby amenities…
Taxation est. · year 1
- Rental income
- $19,524
- − Mortgage interest
- −$10,083
- − Property taxes
- −$968
- − Insurance
- −$900
- − Repairs & maintenance
- −$1,562
- − Management
- −$1,562
- − Depreciation
- −$5,236
- Taxable loss
- −$787
- Est. tax savings @ 24.0%
- +$189
- After-tax cash flow
- $2,418/yr
For passive investors: Depreciation is non-cash, so a rental often shows a tax loss while cash-flowing — sheltering income. Rental losses are passive: they offset passive income freely, and up to $25,000/yr can offset ordinary (W-2) income if you actively participate and your MAGI is under $100k (phasing out to $0 by $150k); unused losses carry forward. On sale, claimed depreciation is recaptured at up to 25%, and gains may owe capital-gains tax (a 1031 exchange can defer both). Figures are a year-1 estimate at your 24.0% rate — not tax advice; consult a CPA.
Schools (NCES district)
- District
- Lee County
- NCES district ID
- 1303270
- Math proficiency
- 44% ▼ -12.00%
- Reading proficiency
- 45% ▼ -10.00%
- Median HH income
- $60,449
- Composite
- 39.23/100
- National rank
- #4009
- State rank
- #21 of 174 in GA
Livability — Leesburg
- Score
- 68/100
- State rank
- #135
- US rank
- #9283
Category grades
Schools grade is shown separately in the Schools card above.
Census & demographics
- Census place
- Leesburg, GA
- County
- Lee County · 29,271 people
- City population
- 29,271
- Metro
- Albany, GA
- Population (ZIP)
- 29,271
- Household income
- $88,312
- Rent vs Own
- Severe rent burden
- 700.0
Population outlook (Lee County) Hauer SSP2
- Today (2025)
- 31,140 people
- By 2030
- 31,753 · +2.0%
- By 2040
- 32,710 · +5.0%
- By 2050
- 33,476 · +7.5%
- By 2075
- 35,113 · +12.8%
- By 2100
- 34,821 · +11.8%
Race, ethnicity, and origin ACS 2023
- Neighborhood character
- Predominantly White (66%)
- Race & ethnicity
- White 66% Black 24% Two or more races 6% Hispanic / Latino 3% Asian 2%
- Common ancestry
- Slovak 2% Italian 2% Serbian 2%
- Foreign-born
- 5% · Canada, South Korea
- Languages at home
- 95% English-only · Spanish 2% Korean 1% Other Indo-European 1%
Political lean MEDSL · Lee
- 2024 margin
- Solid R (+43.5) · D 28.0% · R 71.6%
- 2008→2024 swing
- +8.6pp toward D · 2008: -52.1pp · 2024: -43.5pp
- All cycles
- 2024: R+43.5 2020: R+44.6 2016: R+53.0 2012: R+52.4 2008: R+52.1
Not yet ingested
- Civics
- —
Market trends
- HPI YoY
- ▼ -35.33%
- Current HPI
- 187.3672
- Rent YoY
- ▲ 2.22%
- Metro
- Albany, GA
- State GDP YoY
- ▲ 2.66%
- F500 in state
- 28
Industry mix (Fortune 500 HQ in GA)
| Industry | F500 HQs | Revenue |
|---|---|---|
| Paper / Packaging | 2 | $29B |
|
||
| Retail | 1 | $160B |
|
||
| Transportation / Logistics | 1 | $91B |
|
||
| Airlines | 1 | $62B |
|
||
| Consumer Goods | 1 | $47B |
|
||
| Utilities | 1 | $25B |
|
||
Price history
1 event — show timeline
- 2026-05-26 Listed $180,000 FSBO.com
Property tax history
+2.3%/yrLatest (2024): $968 · -0.2% YoY. Source: county tax records.
Cash-flow waterfall
monthlySold comps — $/sqft
last 12 mo · ≤1 miLoading sold comps…