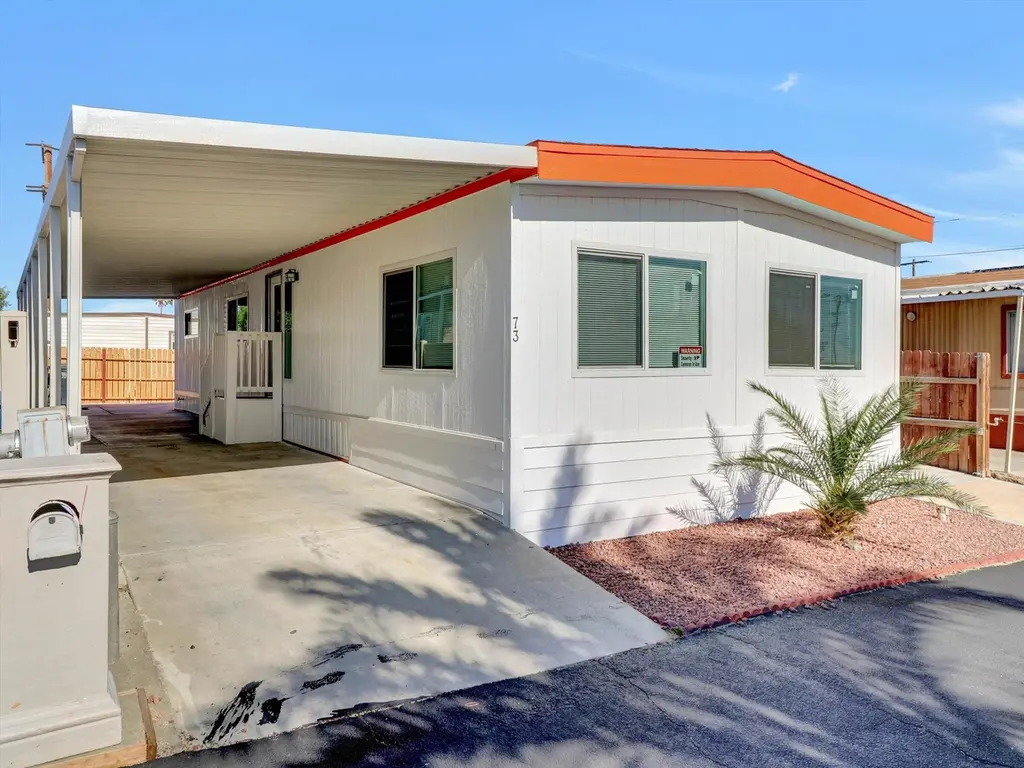
15687 Palm Dr #73 · Desert Hot Springs, CA
Flood risk 1/10 · Minimal
- FEMA flood zone
- AO
- Chance of flooding over 30 yrs
- 0.0%
- Est. flood insurance / yr
- $848 – $2,087
Fire risk 5/10 · Moderate
- Est. fire insurance / yr
- $659 – $1,223
Heat risk 9/10 · Severe
- Hot days now (above 111°F)
- 6 days/yr
- Hot days in 30 yrs
- 17 days/yr
Wind risk 1/10 · Minimal
- Chance of severe wind over 30 yrs
- —
Air-quality risk 5/10 · Moderate
- Unhealthy air days now
- 8 days/yr
- Unhealthy air days in 30 yrs
- 11 days/yr
Risk factors via First Street. Map © Google.
Why this score? — see what drove the B+ grade
The composite is a weighted blend of 9 inputs, each scored 0–100. Each bar is that input's sub-score; the figure is the points it added to the 100-point composite (weight × sub-score).
- Cash flow +30.0/30.0
- ARV discount +15.0/15.0
- 1% rule +10.0/10.0
- DSCR +10.0/10.0
- Condition / age +4.2/5.0
- Rent growth +3.4/5.0
- Schools +2.7/10.0
- Livability +2.5/5.0
- Appreciation +0.0/10.0
$104,900
🖨 Deal sheet (PDF) 📄 Offer letter ✓ Due diligence
Listing remarks
Completely renovated and move-in ready! This beautifully updated 2-bedroom, 2-bath mobile home located in all age Palm Drive Mobile Home Estates, offers approximately 1,040 sq. ft. of stylish living space with modern upgrades throughout. Features include granite countertops, stunning marble walk-in showers with glass enclosures, drywalled interior, central air conditioning, updated vinyl windows, fresh interior paint, and brand-new waterproof vinyl wood flooring. Enjoy community amenities including a pool, hot tub, clubhouse, dog park, playground, and basketball courts. Conveniently located near shopping, dining, and local attractions, this home offers comfort, style, and affordability all
Key facts
- Drywalled interior
- Granite countertops
- 2,500 sq ft lot
Tags
Property features AI
Finance
- Other: Park type: Family (Palm Drive Mobile Estates); Park manager: Betty Villanueva (760-251-2205); Mobile home will remain; Lot/land held in fee simple
- Financial info: Monthly space rent: $744.00; Rental restrictions apply; Manager approval required for park residency; Listing terms: Cash or cash to new loan
- HOA & community: No monthly association fee
Exterior
- Parking: Driveway; 2 total parking spaces (2 covered)
- Security: Community security; Resident manager; Security patrol
- Utilities: Sewer: Unknown; PUD: No
- Home design: Detached double-wide mobile home; Single-story (one level); Year built recorded by builder
- Construction: Aluminum skirting; Manufactured by Jefferson; Manufacture date: 01/01/1973; Double-wide mobile home, approximately 20 ft wide and 52 ft long
- Exterior features: Rectangular lot on a public street; Community security and resident manager; Security patrol included with space rent
Interior
- Flooring: Mixed flooring
- Bathrooms: 2 full bathrooms
- Heating & cooling: Central heating; Central air conditioning
- Interior features: Unfurnished; Dining area; Family room; No fireplace
Neighborhood map
What this means for you Summary
Snapshot
- This is a 2-bed/2.0-bath manufactured listed at $105k. Condition is rated good.
Deal economics
- At list price, monthly cash flow is $967 ($12k/yr) — positive.
- The deal already cash-flows at list — no discount required.
- Meets the 1% rule at list price ($2k rent vs $105k).
- Recommended offer: $102k (3.0% below list) — sets the bar for market timing.
- Cap rate 18.8% vs local median 4.0% in Desert Hot Springs — top-decile yield for the area; either an underpriced asset or a hidden risk that comps aren't pricing in. Stress-test before assuming the spread holds.
Location & tenants
- Location reads 49/100 on livability (#1,149 in CA) — a working-class tenant base; expect higher turnover. Strengths: housing B+; Watch: crime D+, schools F, amenities F.
- Palm Springs Unified (suburban): math 21% / reading 42% proficiency, ranked #328 of 517 in CA (top 63%) — families likely to look elsewhere, expect single-tenant / working-renter base with shorter leases; 73% free/reduced lunch — lower-income household profile, screen leases tightly.
- Market conditions: Rents rising (+3.7%/yr); 515 active listings in the ZIP; 10 comparable units currently listed for rent nearby; rentals at typical pace (median 25d on market — plan ~3-4 weeks tenant-placement turnaround); 40% of comp listings sitting > 30 days — soft ceiling on asking rent; 9,195 units permitted in Riverside County in 2024 (1,512 in 5+ unit buildings).
- At $2,297/mo this rent would consume 51% of the median local household income ($54k/yr) (locally 2095% of renters already pay >50% of income on rent) — very limited rent-growth headroom before tenants either downsize or default.
Forward outlook
- Local home prices are declining (-3.0%/yr); year-one equity from $725 of loan paydown is wiped out by about $3k of value loss. Plan a longer hold.
- Riverside County population projected at +22% by 2050 — long-run rental-demand tailwind backs the buy-and-hold thesis.
- At projected returns (-3.0% appreciation + 3.7% rent growth), your $29k cash investment doubles in ~3 years — after that, you're playing with house money.
Negotiation context
- It's been on market 34 days — a 3% lower offer ($102k) is reasonable based on typical stale-listing flexibility.
Risks & watch-outs
- Watch-outs: flood insurance adds $122/mo.
- Climate carrying-cost: in FEMA flood zone AO (mandatory federal flood insurance); moderate wildfire risk; extreme-heat days projected 6→17/yr by 2055 (HVAC capex compounding) — expect insurance premiums to compound above CPI over the hold.
Questions for the listing agent
- It's been on market 34 days. Have you received any prior offers? Is the seller open to a 3% concession, seller financing, or rate buy-down credit?
- Built in 1979 — when were the roof, HVAC, electrical panel, plumbing, and water heater last replaced?
- What's the actual annual flood-insurance premium (NFIP or private), and is the property in a SFHA with mandatory coverage?
- Is there a deadline driving the sale (1031 exchange, divorce, estate, relocation)? That informs how much negotiation room exists.
- Schools are F-rated, which usually means shorter tenancies and higher turnover. Who's the typical renter profile here, and what's been the actual vacancy rate?
- Crime grade is D in this area — have there been break-ins, vandalism, or insurance claims at this property in the last 3 years? What carrier currently insures it and at what premium?
- What's the average days-on-market for RENTAL listings here right now (not sales)? A rising rental-DOM trend means longer vacancies and softer asking-rent achievability than the comps imply.
- What's the recent tenant-quality profile in this submarket — average credit score on applications, eviction rate, late-payment / NSF rate, and stable-employment percentage? A property-management company in the area should have these aggregated.
- How much new for-sale + rental construction is in the pipeline within 1–3 miles? Heavy new supply typically softens prices + rents 12–24 months out; constrained supply supports both.
Investment metrics
- 1% rule
- 2.19% ✓
- Cap rate
- 18.76%
- Cash-on-cash
- 44.52%
- DSCR
- 2.98
- GRM
- 3.8
CMA / ARV
- ARV (on-the-fly)
- $128,960
- Comps found
- 11
Show comp detail 11 sales within ~0.75 mi
| Address | Dist | Beds/Ba | Sqft | Sold | Price | $/sf | Match |
|---|---|---|---|---|---|---|---|
| 15225 Palm Dr #8 | 0.34mi | 2/2.0 | 1,040 (0%) | 21mo | $63,000 | $61 | 66 |
| 14881 Palm Dr Unit D-08 | 0.46mi | 2/2.0 | 1,050 (+1%) | 17mo | $42,500 | $40 | 63 |
| 15687 Palm Drive #36 | 0.05mi | 3/2.0 (+1) | 1,112 (+7%) | 23mo | $140,000 | $126 | 62 |
| 14777 Palm #35 | 0.67mi | 2/2.0 | 1,000 (-4%) | 2mo | $90,000 | $90 | 61 |
| 14777 Palm Dr #146 | 0.65mi | 2/2.0 | 1,070 (+3%) | 8mo | $122,000 | $114 | 58 |
| 14777 Palm Dr #95 | 0.57mi | 2/1.0 | 960 (-8%) | 0mo | $91,000 | $95 | 56 |
| 15300 Palm Dr #258 | 0.25mi | 2/2.0 | 1,178 (+13%) | 12mo | $222,000 | $188 | 56 |
| 15300 Palm Dr #42 | 0.47mi | 2/2.0 | 1,178 (+13%) | 2mo | $230,000 | $195 | 55 |
| 14777 Palm Dr #30 | 0.65mi | 2/2.0 | 1,000 (-4%) | 16mo | $140,000 | $140 | 50 |
| 15750 Via Montana | 0.56mi | 3/2.0 (+1) | 1,056 (+2%) | 22mo | $335,000 | $317 | 48 |
| 14777 Palm Dr #77 | 0.57mi | 2/2.0 | 1,130 (+9%) | 14mo | $140,000 | $124 | 47 |
Match score weights: distance 35% · size 25% · config 20% · recency 20%. Top-matched comps best support the ARV.
Projected returns pro-forma
-3.0% appreciation · 3.66% rent growth · sell at horizon
- IRR
- 36.7%
- Equity multiple
- 2.57×
- Total profit
- $46,255
- Equity at exit
- $15,641
- IRR
- 43.7%
- Equity multiple
- 5.30×
- Total profit
- $126,439
- Equity at exit
- $9,070
Cash invested: $29,372 (down + closing). Projections, not guarantees.
Landlord ↔ Tenant lean methodology
- Overall (STATE)
- 18 Strongly Tenant-Friendly
- State California
- 18 Strongly Tenant-Friendly · D+13
- County
- — inherits STATE
- City
- — inherits STATE
ZIP-level market 92240
- Home prices YoY
- -19.6%
- Rents YoY
- 3.7%
- Active inventory
- 515
- Price-to-rent
- 3.8×
Monthly cashflow live
- Estimated rent
- $2,297 high interval (Pro) →
- Mortgage (P&I)
- −$550
- Tax est. 1.5%
- −$131 /mo · $1,574/yr
- Insurance
- −$44
- Flood insurance flood zone
- −$122 /mo · $1,468/yr
- HOA
- −$0
- Vacancy / Maint / Mgmt
- −$482
- Net cashflow
- $967
Break-even live
Sensitivity live
| Price | -10% $1,040 | -5% $1,004 | +0% $967 | +5% $931 | +10% $895 |
|---|---|---|---|---|---|
| Rent | -10% $786 | -5% $877 | +0% $967 | +5% $1,058 | +10% $1,149 |
| Rate | -1.0pp $1,020 | -0.5pp $994 | base $967 | +0.5pp $940 | +1.0pp $912 |
UW: 25.0% down · 7.5% · 30yr · 1.5% tax · 5.0% vac · 8.0% maint · 8.0% mgmt
Financing live
Cash to close
- Down payment
- $26,225
- Closing costs
- $3,147
- Reserves months
- —
- Total cash needed
- —
Loan-product check · same deal, 3 products live
Conventional
25% down · 7.5% · 30yr
- Down + closing
- —
- Monthly P&I
- —
- Monthly cashflow
- —
- DSCR
- —
- Eligible?
- —
Personal DTI + credit; lowest rate.
DSCR
20% down · 8.5% · 30yr
- Down + closing
- —
- Monthly P&I
- —
- Monthly cashflow
- —
- DSCR
- —
- Eligible?
- —
No personal income docs; deal must DSCR.
Hard money
10% down · 12.0% · 12mo
- Down + closing
- —
- Monthly P&I
- —
- Monthly cashflow
- —
- DSCR
- —
- Eligible?
- —
Short-term bridge; refi at stabilization.
Rent comps 10 comps
| Address | Beds | Baths | Sqft | Rent | $/sqft | DOM | Units | Dist |
|---|---|---|---|---|---|---|---|---|
| 15300 Palm Dr Desert Hot Springs, CA | 3.0 | 2.0 | 1458 | $2,800 | $1.92 | 44d | 1 | 0.37mi |
| 13987 El Cajon Dr Desert Hot Springs, CA | 3.0 | 2.0 | 1215 | $2,600 | $2.14 | 8d | 1 | 0.97mi |
| 13950 West Dr Unit B Desert Hot Springs, CA | 2.0 | 2.0 | 1008 | $1,600 | $1.59 | 2d | 1 | 1.03mi |
| 15490 Avenue Rambla Unit NA Desert Hot Springs, CA | 3.0 | 2.0 | 1088 | $2,600 | $2.39 | 24d | 1 | 1.10mi |
| 15490 Avenida Rambla Desert Hot Springs, CA | 3.0 | 2.0 | 1088 | $2,600 | $2.39 | 44d | 1 | 1.10mi |
| 13895 Luis Dr Desert Hot Springs, CA | 2.0 | 1.0 | 814 | $1,800 | $2.21 | 44d | 1 | 1.15mi |
| 66590 Joseph Way Unit B Desert Hot Springs, CA | 2.0 | 1.0 | 785 | $2,295 | $2.92 | 24d | 1 | 1.19mi |
| 13715 El Rio Ln Desert Hot Springs, CA | 3.0 | 2.0 | 1318 | $2,600 | $1.97 | 8d | 1 | 1.23mi |
| 13405 Ocotillo Rd Desert Hot Springs, CA | 2.0 | 1.0 | 864 | $1,750 | $2.03 | 2d | 1 | 1.29mi |
| 13322 El Rio Ln Desert Hot Springs, CA | 3.0 | 2.0 | 1215 | $2,750 | $2.26 | 44d | 1 | 1.39mi |
Listing history 15 events
-
2026-06-18days on market $104,900 Active 34 DOM
-
2026-06-17days on market $104,900 Active 33 DOM
-
2026-06-16days on market $104,900 Active 32 DOM
-
2026-06-15days on market $104,900 Active 31 DOM
-
2026-06-13days on market $104,900 Active 29 DOM
-
2026-06-13days on market $104,900 Active 28 DOM
-
2026-06-09days on market $104,900 Active 25 DOM
-
2026-06-08days on market $104,900 Active 24 DOM
-
2026-06-07days on market $104,900 Active 23 DOM
-
2026-06-04days on market $104,900 Active 20 DOM
-
2026-06-03days on market $104,900 Active 19 DOM
-
2026-06-02days on market $104,900 Active 18 DOM
-
2026-06-01days on market $104,900 Active 17 DOM
-
2026-05-31days on market $104,900 Active 16 DOM
-
2026-05-15$104,900 Active
ⓘ Source: listings_history table (triggers on properties + properties_extension) + one-shot
backfill from property_details.listing_events for pre-trigger history.
Climate risk First Street
- Flood 1/10 Low FEMA zone AO · 0% chance over 30 yrs
- Wildfire 5/10 Major
- Heat 9/10 Extreme 6 d/yr ≥111°F today · 17 d/yr by 30 yrs out
- Wind 1/10 Low
- Air quality 5/10 Major 8 unhealthy d/yr today · 11 by 30 yrs out
Nearby sold comps map
Loading sold comps map…
Walkable amenities ~0.75 mi
Loading nearby amenities…
Taxation est. · year 1
- Rental income
- $27,563
- − Mortgage interest
- −$5,876
- − Property taxes
- −$1,574
- − Insurance
- −$1,992
- − Repairs & maintenance
- −$2,205
- − Management
- −$2,205
- − Depreciation
- −$3,052
- Taxable income
- $10,659
- Est. tax owed @ 24.0%
- −$2,558
- After-tax cash flow
- $9,049/yr
For passive investors: Depreciation is non-cash, so a rental often shows a tax loss while cash-flowing — sheltering income. Rental losses are passive: they offset passive income freely, and up to $25,000/yr can offset ordinary (W-2) income if you actively participate and your MAGI is under $100k (phasing out to $0 by $150k); unused losses carry forward. On sale, claimed depreciation is recaptured at up to 25%, and gains may owe capital-gains tax (a 1031 exchange can defer both). Figures are a year-1 estimate at your 24.0% rate — not tax advice; consult a CPA.
Condition & rehab AI · 30 photos
This completely renovated and move-in ready mobile home offers modern upgrades throughout, including granite countertops and marble walk-in showers, making it an attractive option for both resale and rental.
Value-add opportunities
- Resale Painting exterior — Enhances curb appeal
- Resale Landscaping — Improves curb appeal
- Both Addition of outdoor lighting — Enhances safety and curb appeal
Renovation cost estimate screening
Value-add ROI direction
- Resale Painting exterior — Enhances curb appeal ↑
- Resale Landscaping — Improves curb appeal ↑
- Both Addition of outdoor lighting — Enhances safety and curb appeal ↑
ⓘ Cost ranges are severity-bucket heuristics (US national rule-of-thumb). Get contractor quotes + a written scope before underwriting a rehab budget.
Schools (NCES district)
- District
- Palm Springs Unified
- NCES district ID
- 0629550
- Math proficiency
- 21% ▼ -7.00%
- Reading proficiency
- 42% ▬ 0.00%
- Median HH income
- $43,638
- Composite
- 26.76/100
- National rank
- #7131
- State rank
- #328 of 517 in CA
Livability — Desert Hot Springs
- Score
- 49/100
- State rank
- #1149
- US rank
- #25774
Category grades
Schools grade is shown separately in the Schools card above.
Census & demographics
- Census place
- Desert Hot Springs, CA
- County
- Riverside County · 2,287,001 people
- City population
- 41,615
- Metro
- Riverside-San Bernardino-Ontario, CA
- Population (ZIP)
- 41,615
- Household income
- $54,023
- Rent vs Own
- Severe rent burden
- 2095.0
Population outlook (Riverside County) Hauer SSP2
- Today (2025)
- 2,664,475 people
- By 2030
- 2,802,692 · +5.2%
- By 2040
- 3,050,904 · +14.5%
- By 2050
- 3,256,783 · +22.2%
- By 2075
- 3,655,058 · +37.2%
- By 2100
- 3,766,594 · +41.4%
Race, ethnicity, and origin ACS 2023
- Neighborhood character
- Majority Hispanic (64%)
- Race & ethnicity
- Hispanic / Latino 64% Two or more races 27% White 23% Black 7% Native American 2% Asian 2%
- Hispanic origin (detail)
- Mexican 53%
- Common ancestry
- Lithuanian 1% Romanian 1% Italian 1%
- Foreign-born
- 27% · Canada, Vietnam
- Languages at home
- 47% English-only · Spanish 50% Russian/Polish/Slavic 1%
Political lean MEDSL · Riverside
- 2024 margin
- Toss-up / Even · D 48.0% · R 49.3% · Other 2.6%
- 2008→2024 swing
- -3.6pp toward R · 2008: 2.3pp · 2024: -1.3pp
- All cycles
- 2024: R+1.3 2020: D+8.0 2016: D+4.3 2012: R+0.4 2008: D+2.3
Not yet ingested
- Civics
- —
Market trends
- HPI YoY
- ▼ -102.10%
- Current HPI
- 418.4691
- Rent YoY
- ▲ 3.66%
- Metro
- Riverside-San Bernardino-Ontario, CA
- State GDP YoY
- ▲ 3.21%
- F500 in state
- 116
Industry mix (Fortune 500 HQ in CA)
| Industry | F500 HQs | Revenue |
|---|---|---|
| Technology | 27 | $1,492B |
|
||
| Financial Services | 3 | $174B |
|
||
| Retail | 3 | $44B |
|
||
| Insurance | 3 | $26B |
|
||
| Media / Entertainment | 2 | $115B |
|
||
| Pharmaceuticals / Biotech | 2 | $62B |
|
||
Price history
1 event — show timeline
- 2026-05-15 Listed $104,900 GPSMLS
Cash-flow waterfall
monthlySold comps — $/sqft
last 12 mo · ≤1 miLoading sold comps…