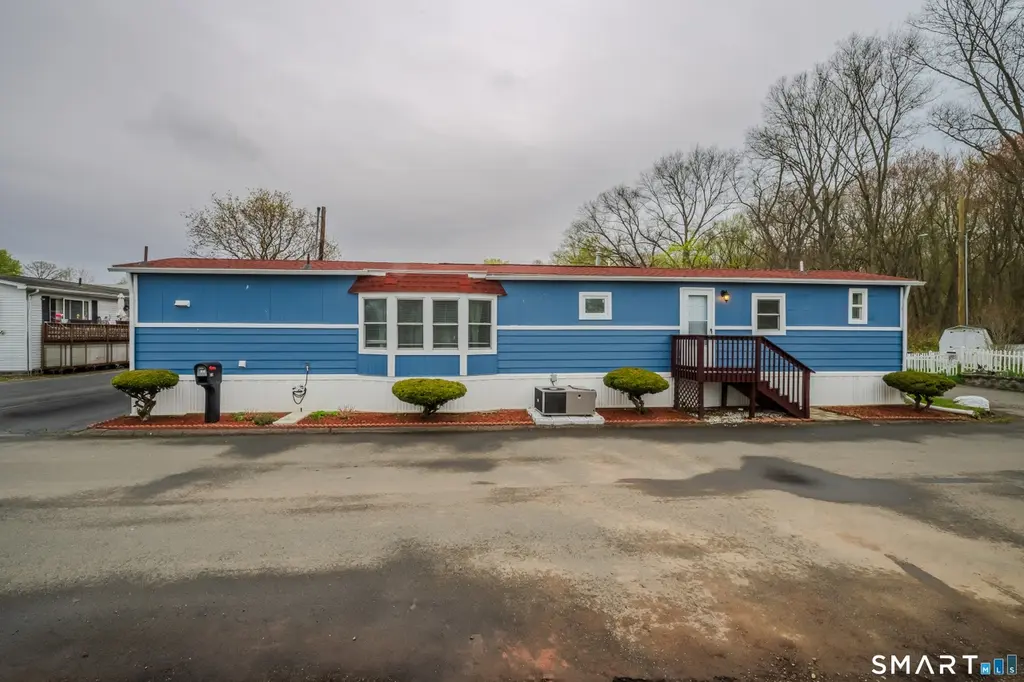
230 Main St Lot 4A · Wallingford Center, CT
Flood risk No data
- FEMA flood zone
- —
- Chance of flooding over 30 yrs
- —
- Est. flood insurance / yr
- —
Fire risk No data
- Est. fire insurance / yr
- —
Heat risk No data
- Hot days now (above threshold)
- —
- Hot days in 30 yrs
- —
Wind risk No data
- Chance of severe wind over 30 yrs
- —
Air-quality risk No data
- Unhealthy air days now
- —
- Unhealthy air days in 30 yrs
- —
Risk factors via First Street. Map © Google.
Why this score? — see what drove the B- grade
The composite is a weighted blend of 9 inputs, each scored 0–100. Each bar is that input's sub-score; the figure is the points it added to the 100-point composite (weight × sub-score).
- Cash flow +26.0/30.0
- 1% rule +10.0/10.0
- DSCR +8.7/10.0
- ARV discount +7.5/15.0
- Livability +4.0/5.0
- Schools +3.8/10.0
- Rent growth +2.5/5.0
- Condition / age +2.5/5.0
- Appreciation +0.0/10.0
$119,900
🖨 Deal sheet 📄 Offer letter ✓ Due diligence
Listing remarks MLS
WELCOME TO HIS CAPTIVATING,CHARMING AND COZY MOBIL HOME IN A DESIRABLE LOCATION THAT YOU WILL LOVE.PERFECTLY MAINTAINED WITH A BEAUTIFUL OPEN FLOOR PLAN.PRICED TO SELL AND WORTH 15 MINUTES OF YOUR TIME TO COME AND SEE IT. ELECTRIC RANGE,REFRIGERATOR,WASHER AND DRYER INCLUDED.WOW! IF YOU DON'T HAVE AN AGENT CONTACT ME FOR A PRIVATE SHOWING (203)631-6746.THANK YOU.
Key facts
- Recent renovations
- Built 1978
- Listed 11 days
Tags
Property features AI
Finance
- Other: Located in a flood zone
- Financial info: Professionally managed (off-site)
- HOA & community: Homeowners association with monthly fee; HOA fee: $550 per month; Association covers trash pickup, snow removal, water, sewer, property management, and road maintenance
Exterior
- Utilities: Public water connected; Public sewer connected; Hot water: other; Above-ground fuel tank
- Home design: Single-family home; On leased land
- Construction: Prefab construction; Shingle roof; Blue exterior color; No foundation specified
- Exterior features: Level lot; Vinyl siding
Interior
- Kitchen: Electric cooktop; Refrigerator
- Bedrooms: 2 bedrooms
- Bathrooms: 1 full bathroom; 1 half bathroom
- Heating & cooling: Hot air heating; Propane fuel for heating
- Interior features: Central air conditioning; No basement
- Laundry & utility: Laundry located in kitchen closet
Neighborhood map
What this means for you Summary
Snapshot
- This is a 2-bed/1.5-bath manufactured listed at $120k.
Deal economics
- At list price, monthly cash flow is $299 ($4k/yr) — positive.
- The deal already cash-flows at list — no discount required.
- Meets the 1% rule at list price ($2k rent vs $120k).
- Cap rate 9.3% vs local median 3.4% in Wallingford Center — top-decile yield for the area; either an underpriced asset or a hidden risk that comps aren't pricing in. Stress-test before assuming the spread holds.
Location & tenants
- Location reads 80/100 on livability (#24 in CT, #1,716 nationally) — a professional / high-income tenant draw. Strengths: housing A+, health & safety A+, amenities A; Watch: commute F.
- Wallingford School District (suburban): math 34% / reading 49% proficiency, ranked #94 of 153 in CT (top 61%) — families likely to look elsewhere, expect single-tenant / working-renter base with shorter leases; only 16% free/reduced lunch — higher-income household profile.
- Market conditions: 111 active listings in the ZIP; 10 comparable units currently listed for rent nearby; rentals at typical pace (median 24d on market — plan ~3-4 weeks tenant-placement turnaround); solid renter incomes; 1,059 units permitted in South Central Connecticut Planning Region in 2024 (779 in 5+ unit buildings).
Forward outlook
- Local home prices are declining (-3.0%/yr); year-one equity from $829 of loan paydown is wiped out by about $4k of value loss. Plan a longer hold.
- At projected returns (-3.0% appreciation + 3.0% rent growth), your $34k cash investment doubles in ~10 years — after that, you're playing with house money.
Negotiation context
- Only 11 days on market — expect competitive offers; lowballing is unlikely to land.
- 2 sale attempts since 8y ago with the ask held roughly flat each time — persistent listings suggest the price (not the market) is what's stuck; bring a comps-based counter.
- Current owner paid $28k; list at $120k implies a 321% gain — meaningful room to come down on a strong offer.
Risks & watch-outs
- Watch-outs: HOA is 28% of rent.
Questions for the listing agent
- Built in 1978 — when were the roof, HVAC, electrical panel, plumbing, and water heater last replaced?
- What does the HOA fee cover, when was the last increase, and are there any pending special assessments or reserve-fund shortfalls?
- Is there a deadline driving the sale (1031 exchange, divorce, estate, relocation)? That informs how much negotiation room exists.
- Schools are B-rated — typically a magnet for longer-tenancy family renters. What's the average tenant stay here, and is there a school-zone premium baked into asking?
- What's the average days-on-market for RENTAL listings here right now (not sales)? A rising rental-DOM trend means longer vacancies and softer asking-rent achievability than the comps imply.
- What's the recent tenant-quality profile in this submarket — average credit score on applications, eviction rate, late-payment / NSF rate, and stable-employment percentage? A property-management company in the area should have these aggregated.
- How much new for-sale + rental construction is in the pipeline within 1–3 miles? Heavy new supply typically softens prices + rents 12–24 months out; constrained supply supports both.
Investment metrics
- 1% rule
- 1.66% ✓
- Cap rate
- 9.28%
- Cash-on-cash
- 10.68%
- DSCR
- 1.47
- GRM
- 5.0
CMA / ARV
No comps found within radius.
Projected returns pro-forma
-3.0% appreciation · 3.0% rent growth · sell at horizon
- IRR
- -0.1%
- Equity multiple
- 1.00×
- Total profit
- $-104
- Equity at exit
- $17,877
- IRR
- 9.8%
- Equity multiple
- 1.76×
- Total profit
- $25,638
- Equity at exit
- $10,367
Cash invested: $33,572 (down + closing). Projections, not guarantees.
Landlord ↔ Tenant lean methodology
- Overall (STATE)
- 27 Tenant-Leaning
- State Connecticut
- 27 Tenant-Leaning · D+7
- County
- — inherits STATE
- City
- — inherits STATE
ZIP-level market 06492
- Active inventory
- 111
- Price-to-rent
- 5.0×
Monthly cashflow live
- Estimated rent
- $1,991 high interval (Pro) →
- Mortgage (P&I)
- −$629
- Tax from tax record
- −$46 /mo · $546/yr
- Insurance
- −$50
- HOA
- −$550
- Vacancy / Maint / Mgmt
- −$418
- Net cashflow
- $299
Break-even live
UW: 25.0% down · 7.5% · 30yr · 1.5% tax · 5.0% vac · 8.0% maint · 8.0% mgmt
Financing live
Cash to close
- Down payment
- $29,975
- Closing costs
- $3,597
- Reserves months
- —
- Total cash needed
- —
Loan-product check · same deal, 3 products live
Conventional
25% down · 7.5% · 30yr
- Down + closing
- —
- Monthly P&I
- —
- Monthly cashflow
- —
- DSCR
- —
- Eligible?
- —
Personal DTI + credit; lowest rate.
DSCR
20% down · 8.5% · 30yr
- Down + closing
- —
- Monthly P&I
- —
- Monthly cashflow
- —
- DSCR
- —
- Eligible?
- —
No personal income docs; deal must DSCR.
Hard money
10% down · 12.0% · 12mo
- Down + closing
- —
- Monthly P&I
- —
- Monthly cashflow
- —
- DSCR
- —
- Eligible?
- —
Short-term bridge; refi at stabilization.
Rent comps 10 comps
| Address | Beds | Baths | Sqft | Rent | $/sqft | DOM | Units | Dist |
|---|---|---|---|---|---|---|---|---|
| 131 N Ridgeland Rd Unit 134 Wallingford, CT | 2.0 | 1.0 | 792 | $2,500 | $3.16 | 23d | 1 | 0.30mi |
| 151-154 Ridgeland Rd Wallingford, CT | 2.0 | 1.0 | 1100 | $1,770 | $1.61 | 23d | 1 | 0.31mi |
| 151 N Ridgeland Rd Wallingford, CT | 2.0 | 1.0 | 1100 | $1,770 | $1.61 | 23d | 1 | 0.31mi |
| 90 N Turnpike Rd Unit 1 Wallingford, CT | 2.0 | 1.0 | 1000 | $2,200 | $2.20 | 3d | 1 | 0.42mi |
| 90 N Turnpike Rd Unit 3 Wallingford, CT | 2.0 | 1.0 | 800 | $1,700 | $2.12 | 3d | 1 | 0.42mi |
| 75 Evergreene Rd #75 Wallingford, CT | 2.0 | 1.0 | 676 | $1,700 | $2.51 | 23d | 1 | 0.42mi |
| 181 Knollwood Dr Wallingford, CT | 2.0 | 1.0 | 697 | $2,359 | $3.38 | 2d | 14 | 0.43mi |
| 45 High St Unit B Wallingford, CT | 1.0 | 1.0 | 676 | $1,800 | $2.66 | 11d | 1 | 1.26mi |
| 1005 N Main Street Ext Wallingford, CT | 2.0 | 1.0 | 840 | $1,950 | $2.32 | 43d | 1 | 1.42mi |
| 990 Yale Ave Wallingford, CT | 2.0 | 1.0 | 840 | $1,950 | $2.32 | 43d | 1 | 1.42mi |
HOA detail
- Monthly dues
- $550 · $6,600/yr
- Likely covers
- electric
Listing history 5 events
-
2026-05-01status Under Contract
-
2026-04-20$119,900 Active
-
2018-03-05soldstatus $28,500 Closed 365-char remark
Show marketing remark (365 chars)
WELCOME TO HIS CAPTIVATING,CHARMING AND COZY MOBIL HOME IN A DESIRABLE LOCATION THAT YOU WILL LOVE.PERFECTLY MAINTAINED WITH A BEAUTIFUL OPEN FLOOR PLAN.PRICED TO SELL AND WORTH 15 MINUTES OF YOUR TIME TO COME AND SEE IT. ELECTRIC RANGE,REFRIGERATOR,WASHER AND DRYER INCLUDED.WOW! IF YOU DON'T HAVE AN AGENT CONTACT ME FOR A PRIVATE SHOWING (203)631-6746.THANK YOU.
-
2018-01-30status Under Contract 365-char remark
Show marketing remark (365 chars)
WELCOME TO HIS CAPTIVATING,CHARMING AND COZY MOBIL HOME IN A DESIRABLE LOCATION THAT YOU WILL LOVE.PERFECTLY MAINTAINED WITH A BEAUTIFUL OPEN FLOOR PLAN.PRICED TO SELL AND WORTH 15 MINUTES OF YOUR TIME TO COME AND SEE IT. ELECTRIC RANGE,REFRIGERATOR,WASHER AND DRYER INCLUDED.WOW! IF YOU DON'T HAVE AN AGENT CONTACT ME FOR A PRIVATE SHOWING (203)631-6746.THANK YOU.
-
2018-01-25$26,900 Active 365-char remark
Show marketing remark (365 chars)
WELCOME TO HIS CAPTIVATING,CHARMING AND COZY MOBIL HOME IN A DESIRABLE LOCATION THAT YOU WILL LOVE.PERFECTLY MAINTAINED WITH A BEAUTIFUL OPEN FLOOR PLAN.PRICED TO SELL AND WORTH 15 MINUTES OF YOUR TIME TO COME AND SEE IT. ELECTRIC RANGE,REFRIGERATOR,WASHER AND DRYER INCLUDED.WOW! IF YOU DON'T HAVE AN AGENT CONTACT ME FOR A PRIVATE SHOWING (203)631-6746.THANK YOU.
ⓘ Source: listings_history table (triggers on properties + properties_extension) + one-shot
backfill from property_details.listing_events for pre-trigger history.
Tax reassessment forecast CT · Partial reset (capped growth)
- Current annual tax
- $546 · $46/mo
- Projected year-2 tax
- $1,556 · $130/mo
- Expected delta
- +$1,010/yr (+$84/mo · 185.0%)
ⓘ Screening estimate from a state-policy table — verify with the county assessor before closing.
Nearby sold comps map
Loading sold comps map…
Walkable amenities ~0.75 mi
Loading nearby amenities…
Taxation est. · year 1
- Rental income
- $23,892
- − Mortgage interest
- −$6,716
- − Property taxes
- −$546
- − Insurance
- −$600
- − Repairs & maintenance
- −$1,911
- − Management
- −$1,911
- − HOA
- −$6,600
- − Depreciation
- −$3,488
- Taxable income
- $2,119
- Est. tax owed @ 24.0%
- −$509
- After-tax cash flow
- $3,075/yr
For passive investors: Depreciation is non-cash, so a rental often shows a tax loss while cash-flowing — sheltering income. Rental losses are passive: they offset passive income freely, and up to $25,000/yr can offset ordinary (W-2) income if you actively participate and your MAGI is under $100k (phasing out to $0 by $150k); unused losses carry forward. On sale, claimed depreciation is recaptured at up to 25%, and gains may owe capital-gains tax (a 1031 exchange can defer both). Figures are a year-1 estimate at your 24.0% rate — not tax advice; consult a CPA.
Schools (NCES district)
- District
- Wallingford School District
- NCES district ID
- 0904740
- Math proficiency
- 34% ▼ -9.00%
- Reading proficiency
- 49% ▼ -7.00%
- Median HH income
- $73,423
- Composite
- 37.92/100
- National rank
- #4310
- State rank
- #94 of 153 in CT
Livability — Wallingford Center
- Score
- 80/100
- State rank
- #24
- US rank
- #1716
Category grades
Schools grade is shown separately in the Schools card above.
Census & demographics
- County
- New Haven County · 688,236 people
- Metro
- New Haven-Milford, CT
- Population (ZIP)
- 44,498
- Household income
- $105,061
- Rent vs Own
- Severe rent burden
- 959.0
Population outlook (South Central Connecticut County) Hauer SSP2
- By 2040
- 608,362
Race, ethnicity, and origin ACS 2023
- Neighborhood character
- Predominantly White (80%)
- Race & ethnicity
- White 80% Hispanic / Latino 11% Two or more races 6% Asian 4% Black 2%
- Hispanic origin (detail)
- Mexican 5% Puerto Rican 3%
- Common ancestry
- Romanian 11% Lithuanian 5% Russian 2%
- Foreign-born
- 11% · Canada, China
- Languages at home
- 85% English-only · Spanish 8% Other Indo-European 4% Russian/Polish/Slavic 1%
Political lean MEDSL · South Central Connecticut
- 2024 margin
- Strong D (+20.1) · D 59.0% · R 38.9% · Other 2.1%
- All cycles
- 2024: D+20.1
Not yet ingested
- Civics
- —
Market trends
- HPI YoY
- ▼ -259.08%
- Current HPI
- 248.4652
- Rent YoY
- —
- Metro
- New Haven-Milford, CT
- State GDP YoY
- ▲ 1.06%
- F500 in state
- 38
Industry mix (Fortune 500 HQ in CT)
| Industry | F500 HQs | Revenue |
|---|---|---|
| Industrial Machinery | 4 | $38B |
|
||
| Insurance | 3 | $71B |
|
||
| Financial Services | 2 | $25B |
|
||
| Transportation / Logistics | 2 | $18B |
|
||
| Healthcare | 1 | $247B |
|
||
| Telecommunications | 1 | $55B |
|
||
Price history
+345.7% since first listed5 events — show timeline
- 2026-05-01 Pending — Smart MLS
- 2026-04-20 Listed $119,900 Smart MLS
- 2018-03-05 Sold (MLS) $28,500 Smart MLS
- 2018-01-30 Pending — Smart MLS
- 2018-01-25 Listed $26,900 Smart MLS
Property tax history
+0.4%/yrLatest (2023): $546 · +1.1% YoY. Source: county tax records.
Cash-flow waterfall
monthlySold comps — $/sqft
last 12 mo · ≤1 miLoading sold comps…