4905 Merrin Rd · Plant City, FL
Flood risk 1/10 · Minimal
- FEMA flood zone
- X (unshaded)
- Chance of flooding over 30 yrs
- 0.0%
- Est. flood insurance / yr
- $507 – $1,088
Fire risk 5/10 · Moderate
- Est. fire insurance / yr
- $947 – $1,759
Heat risk 9/10 · Severe
- Hot days now (above 108°F)
- 7 days/yr
- Hot days in 30 yrs
- 24 days/yr
Wind risk 9/10 · Severe
- Chance of severe wind over 30 yrs
- 99.0%
Air-quality risk 2/10 · Minimal
- Unhealthy air days now
- 1 days/yr
- Unhealthy air days in 30 yrs
- 2 days/yr
Risk factors via First Street. Map © Google.
Why this score? — see what drove the C+ grade
The composite is a weighted blend of 9 inputs, each scored 0–100. Each bar is that input's sub-score; the figure is the points it added to the 100-point composite (weight × sub-score).
- Cash flow +26.7/30.0
- DSCR +9.2/10.0
- 1% rule +7.6/10.0
- ARV discount +7.5/15.0
- Schools +4.2/10.0
- Livability +3.8/5.0
- Rent growth +2.5/5.0
- Condition / age +2.5/5.0
- Appreciation +0.0/10.0
$144,900
🖨 Deal sheet (PDF) 📄 Offer letter ✓ Due diligence
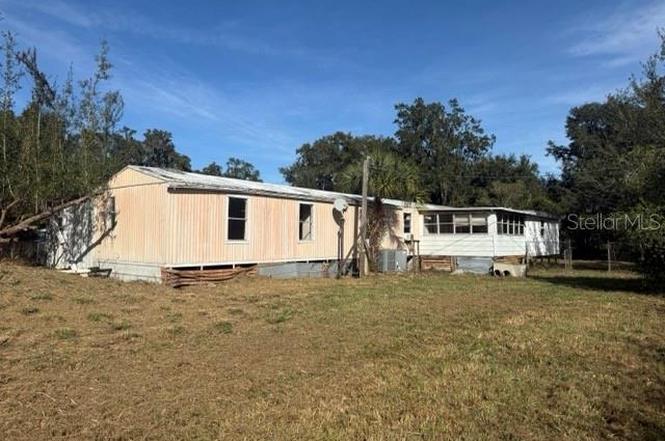
Listing remarks
Welcome to 4905 Merrin Rd. This amazing property has tons of potential. A 2 bedroom , 1-bath mobile home situated on a beautiful 1.05 acre lot in peaceful Plant City!!!! Whether you’re looking to restore the existing home, replace it with a new manufactured or site-built home, or build your dream country retreat from the ground up. This property is ready for your creativity and renovation skills, The land offers plenty of open space surrounded by mature trees, with multiple outbuildings and fenced areas for storage, pets, or a garden. Enjoy the privacy of rural living while still being close to local amenities, schools, and major routes like I-4, giving you easy access to Tampa and L
Key facts
- Rural living
- 1.05 acre lot
- Open space
Tags
Neighborhood map
What this means for you Summary
Snapshot
- This is a 2-bed/1.0-bath manufactured listed at $145k.
Deal economics
- At list price, monthly cash flow is $392 ($5k/yr) — positive.
- The deal already cash-flows at list — no discount required.
- Meets the 1% rule at list price ($2k rent vs $145k).
- Recommended offer: $132k (9.0% below list) — sets the bar for market timing.
Location & tenants
- Location reads 76/100 on livability (#227 in FL, #3,587 nationally) — a middle-class / working-renter tenant base. Strengths: amenities A+, cost of living A+, housing A+; Watch: employment C-, commute F.
- Hillsborough (suburban): math 47% / reading 50% proficiency, ranked #41 of 73 in FL (top 56%) — families likely to look elsewhere, expect single-tenant / working-renter base with shorter leases.
- Zoned schools: Knights Elementary School (math 52% / reading 45%, grade D, #1,152 of 2,144 statewide, top 55%, 623 students, 70% FRL); Marshall Middle Magnet School (math 28% / reading 31%, grade F, #469 of 571 statewide, top 84%, 1,089 students, 69% FRL); Plant City High School (math 38% / reading 40%, grade F, #312 of 667 statewide, top 48%, 2,474 students, 58% FRL).
- Market conditions: 323 active listings in the ZIP; 9,053 units permitted in Hillsborough County in 2024 (4,555 in 5+ unit buildings).
Forward outlook
- Local home prices are declining (-3.0%/yr); year-one equity from $1k of loan paydown is wiped out by about $4k of value loss. Plan a longer hold.
- Hillsborough County population projected at +37% by 2050 — long-run rental-demand tailwind backs the buy-and-hold thesis.
- At projected returns (-3.0% appreciation + 3.0% rent growth), your $41k cash investment doubles in ~10 years — after that, you're playing with house money.
Negotiation context
- It's been on market 99 days — a 9% lower offer ($132k) is reasonable based on typical stale-listing flexibility.
- 2 sale attempts; this cycle's ask has dropped $25k (15%) from the opening price — seller is motivated, your offer sets the floor, not the list.
- Current owner paid $20k; list at $145k implies a 624% gain — meaningful room to come down on a strong offer.
Risks & watch-outs
- Climate carrying-cost: severe wind risk, 99% chance of damaging wind over 30y; moderate wildfire risk; extreme-heat days projected 7→24/yr by 2055 (HVAC capex compounding) — expect insurance premiums to compound above CPI over the hold.
Questions for the listing agent
- It's been on market 99 days. Have you received any prior offers? Is the seller open to a 9% concession, seller financing, or rate buy-down credit?
- Why hasn't it sold? Are there any deal-killer items the seller is aware of (foundation, flood, title, zoning, code violations)?
- Is there a deadline driving the sale (1031 exchange, divorce, estate, relocation)? That informs how much negotiation room exists.
- Schools are D-rated, which usually means shorter tenancies and higher turnover. Who's the typical renter profile here, and what's been the actual vacancy rate?
- What's the average days-on-market for RENTAL listings here right now (not sales)? A rising rental-DOM trend means longer vacancies and softer asking-rent achievability than the comps imply.
- What's the recent tenant-quality profile in this submarket — average credit score on applications, eviction rate, late-payment / NSF rate, and stable-employment percentage? A property-management company in the area should have these aggregated.
- How much new for-sale + rental construction is in the pipeline within 1–3 miles? Heavy new supply typically softens prices + rents 12–24 months out; constrained supply supports both.
Investment metrics
- 1% rule
- 1.26% ✓
- Cap rate
- 9.54%
- Cash-on-cash
- 11.61%
- DSCR
- 1.52
- GRM
- 6.6
CMA / ARV
No comps found within radius.
Projected returns pro-forma
-3.0% appreciation · 3.0% rent growth · sell at horizon
- IRR
- 1.0%
- Equity multiple
- 1.04×
- Total profit
- $1,575
- Equity at exit
- $21,605
- IRR
- 10.7%
- Equity multiple
- 1.83×
- Total profit
- $33,801
- Equity at exit
- $12,528
Cash invested: $40,572 (down + closing). Projections, not guarantees.
Landlord ↔ Tenant lean methodology
- Overall (STATE)
- 87 Strongly Landlord-Friendly
- State Florida
- 87 Strongly Landlord-Friendly · R+3
- County
- — inherits STATE
- City
- — inherits STATE
ZIP-level market 33565
- Home prices YoY
- -24.7%
- Active inventory
- 323
- Price-to-rent
- 6.6×
Monthly cashflow live
- Estimated rent
- $1,831 medium interval (Pro) →
- Mortgage (P&I)
- −$760
- Tax from tax record
- −$234 /mo · $2,810/yr
- Insurance
- −$60
- HOA
- −$0
- Vacancy / Maint / Mgmt
- −$385
- Net cashflow
- $392
Break-even live
Sensitivity live
| Price | -10% $474 | -5% $433 | +0% $392 | +5% $351 | +10% $310 |
|---|---|---|---|---|---|
| Rent | -10% $248 | -5% $320 | +0% $392 | +5% $465 | +10% $537 |
| Rate | -1.0pp $465 | -0.5pp $429 | base $392 | +0.5pp $355 | +1.0pp $317 |
UW: 25.0% down · 7.5% · 30yr · 1.5% tax · 5.0% vac · 8.0% maint · 8.0% mgmt
Financing live
Cash to close
- Down payment
- $36,225
- Closing costs
- $4,347
- Reserves months
- —
- Total cash needed
- —
Loan-product check · same deal, 3 products live
Conventional
25% down · 7.5% · 30yr
- Down + closing
- —
- Monthly P&I
- —
- Monthly cashflow
- —
- DSCR
- —
- Eligible?
- —
Personal DTI + credit; lowest rate.
DSCR
20% down · 8.5% · 30yr
- Down + closing
- —
- Monthly P&I
- —
- Monthly cashflow
- —
- DSCR
- —
- Eligible?
- —
No personal income docs; deal must DSCR.
Hard money
10% down · 12.0% · 12mo
- Down + closing
- —
- Monthly P&I
- —
- Monthly cashflow
- —
- DSCR
- —
- Eligible?
- —
Short-term bridge; refi at stabilization.
Listing history 6 events
-
2026-03-21status Pending
-
2026-03-05price $144,900
-
2026-03-03status Active
-
2026-01-31historical
-
2025-11-11$169,900 Active
-
1996-02-19soldstatus $20,000
ⓘ Source: listings_history table (triggers on properties + properties_extension) + one-shot
backfill from property_details.listing_events for pre-trigger history.
Tax reassessment forecast FL · Resets to sale price
- Current annual tax
- $2,810 · $234/mo
- Projected year-2 tax
- $2,810 · $234/mo
- Expected delta
- $0/yr ($0/mo · 0.0%)
ⓘ Screening estimate from a state-policy table — verify with the county assessor before closing.
Climate risk First Street
- Flood 1/10 Low FEMA zone X (unshaded) · 0% chance over 30 yrs
- Wildfire 5/10 Major
- Heat 9/10 Extreme 7 d/yr ≥108°F today · 24 d/yr by 30 yrs out
- Wind 9/10 Extreme 99% chance of damaging wind over 30 yrs
- Air quality 2/10 Low 1 unhealthy d/yr today · 2 by 30 yrs out
Nearby sold comps map
Loading sold comps map…
Walkable amenities ~0.75 mi
Loading nearby amenities…
Taxation est. · year 1
- Rental income
- $21,977
- − Mortgage interest
- −$8,117
- − Property taxes
- −$2,810
- − Insurance
- −$724
- − Repairs & maintenance
- −$1,758
- − Management
- −$1,758
- − Depreciation
- −$4,215
- Taxable income
- $2,595
- Est. tax owed @ 24.0%
- −$623
- After-tax cash flow
- $4,087/yr
For passive investors: Depreciation is non-cash, so a rental often shows a tax loss while cash-flowing — sheltering income. Rental losses are passive: they offset passive income freely, and up to $25,000/yr can offset ordinary (W-2) income if you actively participate and your MAGI is under $100k (phasing out to $0 by $150k); unused losses carry forward. On sale, claimed depreciation is recaptured at up to 25%, and gains may owe capital-gains tax (a 1031 exchange can defer both). Figures are a year-1 estimate at your 24.0% rate — not tax advice; consult a CPA.
Schools (NCES district)
- District
- Hillsborough
- NCES district ID
- 1200870
- Math proficiency
- 47% ▼ -8.00%
- Reading proficiency
- 50% ▼ -4.00%
- Median HH income
- $50,622
- Composite
- 41.6/100
- National rank
- #3435
- State rank
- #41 of 73 in FL
Livability — Plant City
- Score
- 76/100
- State rank
- #227
- US rank
- #3587
Category grades
Schools grade is shown separately in the Schools card above.
Census & demographics
- County
- Hillsborough County · 1,540,968 people
- City population
- 68,525
- Metro
- Tampa-St. Petersburg-Clearwater, FL
- Population (ZIP)
- 18,108
- Household income
- $73,414
- Rent vs Own
- Severe rent burden
- 152.0
Population outlook (Hillsborough County) Hauer SSP2
- Today (2025)
- 1,607,022 people
- By 2030
- 1,733,968 · +7.9%
- By 2040
- 1,979,565 · +23.2%
- By 2050
- 2,203,427 · +37.1%
- By 2075
- 2,667,893 · +66.0%
- By 2100
- 2,891,558 · +79.9%
Race, ethnicity, and origin ACS 2023
- Neighborhood character
- Predominantly White (71%)
- Race & ethnicity
- White 71% Hispanic / Latino 23% Two or more races 14% Black 2% Native American 1%
- Hispanic origin (detail)
- Mexican 16% Puerto Rican 2% Cuban 1%
- Common ancestry
- Romanian 2% Slovak 1% Iranian 1%
- Foreign-born
- 10% · Canada, Jamaica
- Languages at home
- 80% English-only · Spanish 19%
Political lean MEDSL · Hillsborough
- 2024 margin
- Toss-up / Even · D 47.8% · R 50.9% · Other 1.3%
- 2008→2024 swing
- -10.2pp toward R · 2008: 7.1pp · 2024: -3.1pp
- All cycles
- 2024: R+3.1 2020: D+6.9 2016: D+6.8 2012: D+6.7 2008: D+7.1
Not yet ingested
- Civics
- —
Market trends
- HPI YoY
- ▼ -114.17%
- Current HPI
- 347.2475
- Rent YoY
- —
- Metro
- Tampa-St. Petersburg-Clearwater, FL
- State GDP YoY
- ▲ 3.28%
- F500 in state
- 36
Industry mix (Fortune 500 HQ in FL)
| Industry | F500 HQs | Revenue |
|---|---|---|
| Industrial Technology | 2 | $29B |
|
||
| Insurance | 2 | $17B |
|
||
| Retail | 1 | $60B |
|
||
| Technology Distribution | 1 | $58B |
|
||
| Homebuilding | 1 | $35B |
|
||
| Technology Manufacturing | 1 | $35B |
|
||
Price history
+624.5% since first listed6 events — show timeline
- 2026-03-21 Pending — Stellar MLS as Distributed by MLS Grid
- 2026-03-05 Price Changed $144,900 Stellar MLS as Distributed by MLS Grid
- 2026-03-03 Relisted — Stellar MLS as Distributed by MLS Grid
- 2026-01-31 Listing Removed — Stellar MLS as Distributed by MLS Grid
- 2025-11-11 Listed $169,900 Stellar MLS as Distributed by MLS Grid
- 1996-02-19 Sold (Public Records) $20,000 Public Records
Property tax history
+11.2%/yrLatest (2025): $2,810 · +214.1% YoY. Source: county tax records.
Cash-flow waterfall
monthlySold comps — $/sqft
last 12 mo · ≤1 miLoading sold comps…