 Triplex
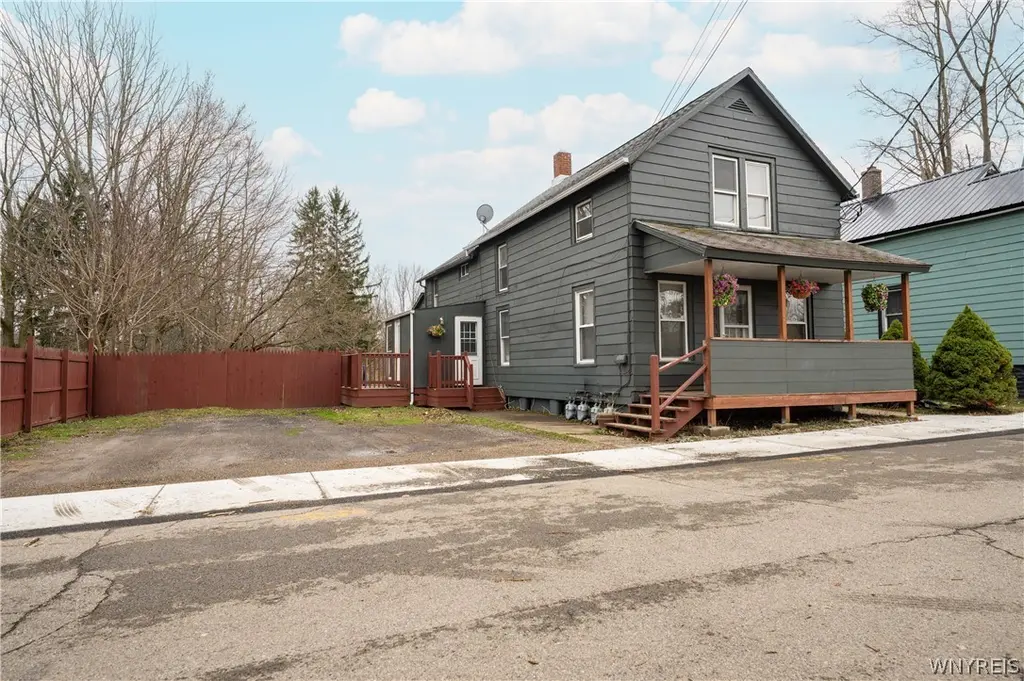
29 York St · Angola, NY
Flood risk 1/10 · Minimal
- FEMA flood zone
- X (unshaded)
- Chance of flooding over 30 yrs
- 0.0%
- Est. flood insurance / yr
- $473 – $860
Fire risk 3/10 · Minor
- Est. fire insurance / yr
- $691 – $1,283
Heat risk 2/10 · Minimal
- Hot days now (above 94°F)
- 7 days/yr
- Hot days in 30 yrs
- 16 days/yr
Wind risk 1/10 · Minimal
- Chance of severe wind over 30 yrs
- —
Air-quality risk 2/10 · Minimal
- Unhealthy air days now
- 1 days/yr
- Unhealthy air days in 30 yrs
- 3 days/yr
Risk factors via First Street. Map © Google.
Why this score? — see what drove the B- grade
The composite is a weighted blend of 9 inputs, each scored 0–100. Each bar is that input's sub-score; the figure is the points it added to the 100-point composite (weight × sub-score).
- Cash flow +30.0/30.0
- 1% rule +10.0/10.0
- DSCR +10.0/10.0
- ARV discount +7.5/15.0
- Schools +4.1/10.0
- Livability +3.4/5.0
- Rent growth +2.5/5.0
- Condition / age +2.5/5.0
- Appreciation +0.0/10.0
$169,900
🖨 Deal sheet 📄 Offer letter ✓ Due diligence
Multi-family units
County records classify this as Multi-Family (2-4 Unit). Listing-text estimate: 3 units. confirmed
Listing remarks MLS
GREAT INVESTMENT OPPORTUNITY! WELL MAINTAINED TRIPLEX - UPDATED PLUMBING, WIRING, CIRCUIT BREAKERS, TEAR OFF ROOF & GUTTERS, FORCED HOT AIR FURNACE - REAR UNIT IS A STUDIO THAT INCLUDES STOVE, REFRIGERATOR & MICROWAVE - FRONT COVERED PORCH & LARGE LOT - OFF STREET PARKING
Key facts
- Oversize bathroom
- Spacious kitchen
- Studio style space
Tags
Property features AI
Finance
- Financial info: Property configured as a 3-unit building; Three separate gas meters and three separate electric meters; Owner pays trash collection and water; Operating expenses include trash and water; At least one unit reported rent of $525
Exterior
- Parking: Gravel parking
- Utilities: Public water connected; Sewer connected
- Home design: Two-story multi-unit building; Existing construction
- Construction: Architectural shingle roof; Foundation: block and poured; Construction notes reference PEX plumbing
- Exterior features: Covered porch; Deck; Fenced yard (partial fence)
Interior
- Kitchen: Some units include oven/range; Some units include dishwasher; Some units include refrigerator; Some units include microwave; Eat-in kitchen in at least one unit; Dining area in at least one unit
- Bedrooms: Unit mix includes 3-bedroom and 2-bedroom units
- Flooring: Carpet; Vinyl; Varies by unit
- Bathrooms: Three full bathrooms total (property); Each unit includes one full bathroom
- Heating & cooling: Forced air heating; Wall furnace; Heating details listed as 'See Remarks'
- Interior features: Full basement with walk-out access and sump pump; Varied flooring (carpet and vinyl)
- Laundry & utility: Washer hookup available; Some units have in-unit laundry
Neighborhood map
What this means for you Summary
Snapshot
- This is a 3 × 5-bed/3.0-bath units multifamily listed at $170k.
Deal economics
- At list price, monthly cash flow is $2k ($24k/yr) — positive. Per door: $668/mo.
- The deal already cash-flows at list — no discount required.
- Meets the 1% rule at list price ($4k rent vs $170k).
Location & tenants
- Location reads 68/100 on livability (#555 in NY) — a middle-class / working-renter tenant base. Strengths: housing A+, crime A-, cost of living A-; Watch: schools C-, amenities F, commute F.
- Evans-Brant Central School District (Lake Shore) (suburban): math 43% / reading 51% proficiency, ranked #424 of 590 in NY (top 72%) — families likely to look elsewhere, expect single-tenant / working-renter base with shorter leases.
- Market conditions: 100 active listings in the ZIP; 1,244 units permitted in Erie County in 2024 (563 in 5+ unit buildings).
Forward outlook
- Local home prices are declining (-3.0%/yr); year-one equity from $1k of loan paydown is wiped out by about $5k of value loss. Plan a longer hold.
- At projected returns (-3.0% appreciation + 3.0% rent growth), your $48k cash investment doubles in ~3 years — after that, you're playing with house money.
Negotiation context
- Only 13 days on market — expect competitive offers; lowballing is unlikely to land.
- 2 sale attempts since 13y ago with the ask held roughly flat each time — persistent listings suggest the price (not the market) is what's stuck; bring a comps-based counter.
- Current owner paid $63k; list at $170k implies a 170% gain — meaningful room to come down on a strong offer.
Risks & watch-outs
- Watch-outs: built in 1900 — expect roof / HVAC / electrical / plumbing capex.
Questions for the listing agent
- Can we see the unit-by-unit rent roll, current vacancy, and any below-market leases? What's the average tenancy length?
- What capital expenditures (roof, boiler, parking lot, exteriors) have been made in the last 5 years, and what's planned in the next 2?
- Built in 1900 — when were the roof, HVAC, electrical panel, plumbing, and water heater last replaced?
- Is there a deadline driving the sale (1031 exchange, divorce, estate, relocation)? That informs how much negotiation room exists.
- What's the average days-on-market for RENTAL listings here right now (not sales)? A rising rental-DOM trend means longer vacancies and softer asking-rent achievability than the comps imply.
- What's the recent tenant-quality profile in this submarket — average credit score on applications, eviction rate, late-payment / NSF rate, and stable-employment percentage? A property-management company in the area should have these aggregated.
- How much new apartment / multifamily construction is in the pipeline within 1–3 miles? Heavy new supply (>2% of stock underway) typically softens rents 12–24 months out; light construction supports rent growth.
Investment metrics
- 1% rule
- 2.46% ✓
- Cap rate
- 20.45%
- Cash-on-cash
- 50.57%
- DSCR
- 3.25
- GRM
- 3.4
CMA / ARV
- ARV (on-the-fly)
- $97,356
- Comps found
- 1
Show comp detail 1 sale within ~0.75 mi
| Address | Dist | Beds/Ba | Sqft | Sold | Price | $/sf | Match |
|---|---|---|---|---|---|---|---|
| 66 York St | 0.07mi | 5/2.0 (-1) | 1,602 (+0%) | 17mo | $97,000 | $61 | 73 |
Match score weights: distance 35% · size 25% · config 20% · recency 20%. Top-matched comps best support the ARV.
Projected returns pro-forma
-3.0% appreciation · 3.0% rent growth · sell at horizon
- IRR
- 48.4%
- Equity multiple
- 3.11×
- Total profit
- $100,298
- Equity at exit
- $25,333
- IRR
- 54.0%
- Equity multiple
- 6.30×
- Total profit
- $252,319
- Equity at exit
- $14,690
Cash invested: $47,572 (down + closing). Projections, not guarantees.
Landlord ↔ Tenant lean methodology
- Overall (STATE)
- 15 Strongly Tenant-Friendly
- State New York
- 15 Strongly Tenant-Friendly · D+10
- County
- — inherits STATE
- City
- — inherits STATE
ZIP-level market 14006
- Home prices YoY
- -16.8%
- Active inventory
- 100
- Price-to-rent
- 10.2×
Monthly cashflow live
- Estimated rent
- $4,176 medium interval (Pro) →
- Mortgage (P&I)
- −$891
- Tax from tax record
- −$332 /mo · $3,989/yr
- Insurance
- −$71
- HOA
- −$0
- Vacancy / Maint / Mgmt
- −$877
- Net cashflow
- $2,005
Break-even live
3-unit breakdown (identical units grouped — click to expand)
| Units | Beds | Baths | Est. rent |
|---|---|---|---|
| 3× units | 5 | 3 | $4,176 |
| #1 | 5 | 3 | $1,392 |
| #2 | 5 | 3 | $1,392 |
| #3 | 5 | 3 | $1,392 |
| Total (3 units) | $4,176 | ||
UW: 25.0% down · 7.5% · 30yr · 1.5% tax · 5.0% vac · 8.0% maint · 8.0% mgmt
Financing live
Cash to close
- Down payment
- $42,475
- Closing costs
- $5,097
- Reserves months
- —
- Total cash needed
- —
Loan-product check · same deal, 3 products live
Conventional
25% down · 7.5% · 30yr
- Down + closing
- —
- Monthly P&I
- —
- Monthly cashflow
- —
- DSCR
- —
- Eligible?
- —
Personal DTI + credit; lowest rate.
DSCR
20% down · 8.5% · 30yr
- Down + closing
- —
- Monthly P&I
- —
- Monthly cashflow
- —
- DSCR
- —
- Eligible?
- —
No personal income docs; deal must DSCR.
Hard money
10% down · 12.0% · 12mo
- Down + closing
- —
- Monthly P&I
- —
- Monthly cashflow
- —
- DSCR
- —
- Eligible?
- —
Short-term bridge; refi at stabilization.
Listing history 7 events
-
2026-04-22status Pending
-
2026-04-09$169,900 Active
-
2013-08-15soldstatus $63,000 290-char remark
Show marketing remark (290 chars)
GREAT INVESTMENT OPPORTUNITY! WELL MAINTAINED TRIPLEX - UPDATED PLUMBING, WIRING, CIRCUIT BREAKERS, TEAR OFF ROOF & GUTTERS, FORCED HOT AIR FURNACE - REAR UNIT IS A STUDIO THAT INCLUDES STOVE, REFRIGERATOR & MICROWAVE - FRONT COVERED PORCH & LARGE LOT - OFF STREET PARKING
-
2013-08-06soldstatus $63,000
-
2013-04-22$67,900 290-char remark
Show marketing remark (290 chars)
GREAT INVESTMENT OPPORTUNITY! WELL MAINTAINED TRIPLEX - UPDATED PLUMBING, WIRING, CIRCUIT BREAKERS, TEAR OFF ROOF & GUTTERS, FORCED HOT AIR FURNACE - REAR UNIT IS A STUDIO THAT INCLUDES STOVE, REFRIGERATOR & MICROWAVE - FRONT COVERED PORCH & LARGE LOT - OFF STREET PARKING
-
2005-12-30soldstatus $15,000
-
1995-03-20soldstatus $35,000
ⓘ Source: listings_history table (triggers on properties + properties_extension) + one-shot
backfill from property_details.listing_events for pre-trigger history.
Tax reassessment forecast NY · Partial reset (capped growth)
- Current annual tax
- $3,989 · $332/mo
- Projected year-2 tax
- $3,989 · $332/mo
- Expected delta
- $0/yr ($0/mo · 0.0%)
ⓘ Screening estimate from a state-policy table — verify with the county assessor before closing.
Climate risk First Street
- Flood 1/10 Low FEMA zone X (unshaded) · 0% chance over 30 yrs
- Wildfire 3/10 Moderate
- Heat 2/10 Low 7 d/yr ≥94°F today · 16 d/yr by 30 yrs out
- Wind 1/10 Low
- Air quality 2/10 Low 1 unhealthy d/yr today · 3 by 30 yrs out
Nearby sold comps map
Loading sold comps map…
Walkable amenities ~0.75 mi
Loading nearby amenities…
Taxation est. · year 1
- Rental income
- $50,112
- − Mortgage interest
- −$9,517
- − Property taxes
- −$3,989
- − Insurance
- −$850
- − Repairs & maintenance
- −$4,009
- − Management
- −$4,009
- − Depreciation
- −$4,943
- Taxable income
- $22,796
- Est. tax owed @ 24.0%
- −$5,471
- After-tax cash flow
- $18,588/yr
For passive investors: Depreciation is non-cash, so a rental often shows a tax loss while cash-flowing — sheltering income. Rental losses are passive: they offset passive income freely, and up to $25,000/yr can offset ordinary (W-2) income if you actively participate and your MAGI is under $100k (phasing out to $0 by $150k); unused losses carry forward. On sale, claimed depreciation is recaptured at up to 25%, and gains may owe capital-gains tax (a 1031 exchange can defer both). Figures are a year-1 estimate at your 24.0% rate — not tax advice; consult a CPA.
Schools (NCES district)
- District
- Evans-Brant Central School District (Lake Shore)
- NCES district ID
- 3616560
- Math proficiency
- 43% ▼ -9.00%
- Reading proficiency
- 51% ▲ 6.00%
- Median HH income
- $56,433
- Composite
- 40.89/100
- National rank
- #3619
- State rank
- #424 of 590 in NY
Livability — Angola
- Score
- 68/100
- State rank
- #555
- US rank
- #9956
Category grades
Schools grade is shown separately in the Schools card above.
Census & demographics
- Census place
- Angola, NY
- City population
- 9,354
- Population (ZIP)
- 9,354
Population outlook (Erie County) Hauer SSP2
- Today (2025)
- 933,037 people
- By 2030
- 935,181 · +0.2%
- By 2040
- 928,531 · -0.5%
- By 2050
- 905,725 · -2.9%
- By 2075
- 834,037 · -10.6%
- By 2100
- 708,033 · -24.1%
Race, ethnicity, and origin ACS 2023
- Neighborhood character
- Predominantly White (92%)
- Race & ethnicity
- White 92% Two or more races 3% Black 2% Asian 1% Hispanic / Latino 1%
- Common ancestry
- Romanian 16% Italian 4% Lithuanian 2%
- Foreign-born
- 3% · Canada, China
- Languages at home
- 96% English-only · French/Haitian/Cajun 1% Spanish 1% Other Asian/Pacific 1%
Political lean MEDSL · Erie
- 2024 margin
- Lean D (+9.7) · D 54.8% · R 45.2%
- 2008→2024 swing
- -7.9pp toward R · 2008: 17.5pp · 2024: 9.7pp
- All cycles
- 2024: D+9.7 2020: D+14.7 2016: D+4.8 2012: D+15.6 2008: D+17.5
Not yet ingested
- Civics
- —
Market trends
- HPI YoY
- ▼ -80.95%
- Current HPI
- 401.7461
- Rent YoY
- —
- Metro
- —
- State GDP YoY
- ▲ 2.60%
- F500 in state
- 92
Industry mix (Fortune 500 HQ in NY)
| Industry | F500 HQs | Revenue |
|---|---|---|
| Financial Services | 10 | $950B |
|
||
| Consumer Goods | 9 | $162B |
|
||
| Insurance | 4 | $225B |
|
||
| Telecommunications | 2 | $144B |
|
||
| Pharmaceuticals | 2 | $112B |
|
||
| Media / Entertainment | 2 | $69B |
|
||
Price history
+385.4% since first listed7 events — show timeline
- 2026-04-22 Pending — WNYREIS
- 2026-04-09 Listed $169,900 WNYREIS
- 2013-08-15 Sold (MLS) $63,000 WNYREIS
- 2013-08-06 Sold (Public Records) $63,000 Public Records
- 2013-04-22 Listed $67,900 WNYREIS
- 2005-12-30 Sold (Public Records) $15,000 Public Records
- 1995-03-20 Sold (Public Records) $35,000 Public Records
Property tax history
+2.7%/yrLatest (2025): $3,989 · +0.6% YoY. Source: county tax records.
Cash-flow waterfall
monthlySold comps — $/sqft
last 12 mo · ≤1 miLoading sold comps…