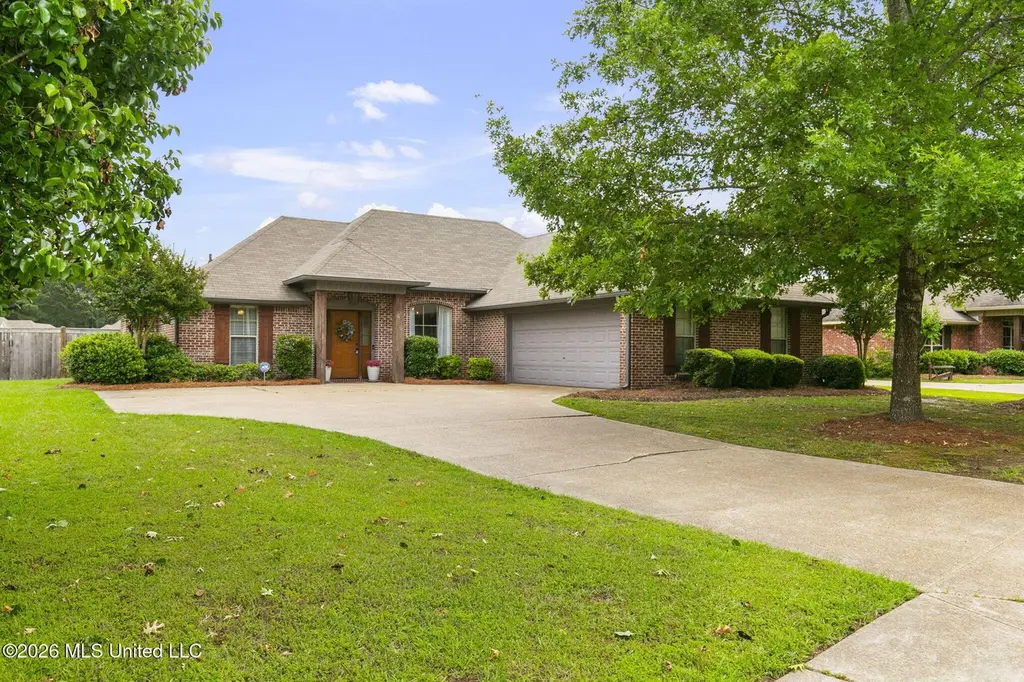
159 Mason Way · Madison, MS
Flood risk 1/10 · Minimal
- FEMA flood zone
- X (unshaded)
- Chance of flooding over 30 yrs
- 0.0%
- Est. flood insurance / yr
- $507 – $1,088
Fire risk 1/10 · Minimal
- Est. fire insurance / yr
- $1,241 – $2,305
Heat risk 7/10 · Major
- Hot days now (above 108°F)
- 7 days/yr
- Hot days in 30 yrs
- 20 days/yr
Wind risk 6/10 · Moderate
- Chance of severe wind over 30 yrs
- 76.0%
Air-quality risk 2/10 · Minimal
- Unhealthy air days now
- 0 days/yr
- Unhealthy air days in 30 yrs
- 1 days/yr
Risk factors via First Street. Map © Google.
Why this score? — see what drove the C- grade
The composite is a weighted blend of 9 inputs, each scored 0–100. Each bar is that input's sub-score; the figure is the points it added to the 100-point composite (weight × sub-score).
- Cash flow +18.6/30.0
- ARV discount +9.9/15.0
- DSCR +5.8/10.0
- Schools +4.8/10.0
- 1% rule +4.1/10.0
- Livability +4.0/5.0
- Rent growth +3.2/5.0
- Condition / age +2.5/5.0
- Appreciation +0.0/10.0
$290,000
🖨 Deal sheet (PDF) 📄 Offer letter ✓ Due diligence
Listing remarks MLS
Heart of Ashbrooke! High ceilings, modern layout, new carpet and paint!! Move in Ready!! Walk to the Pool!!
Key facts
- Gas log fireplace
- Neighborhood pool
- Corner lot
Tags
Property features AI
Finance
- HOA & community: Association with semi-annual fee; Association fee includes management; Community clubhouse; Community playground; Community pool
Exterior
- Parking: Attached garage with 2 spaces; Garage includes storage; Concrete driveway
- Security: Security system; Smoke detectors
- Utilities: Public water; Public sewer; Electricity connected; Natural gas connected; Cable available; Fiber to the house
- Home design: Single-family house; One level; Brick construction; Asphalt shingle roof; Slab foundation
- Construction: Brick exterior; Slab foundation; Asphalt shingle roof
- Exterior features: Private yard; Rain gutters; Backyard fencing (wood); Corner lot; Pond waterfront
Interior
- Kitchen: Dishwasher; Disposal; Microwave; Tile countertops; Breakfast bar
- Bedrooms: Primary bedroom on main level
- Flooring: Carpet; Concrete; Laminate
- Bathrooms: 2 full bathrooms
- Heating & cooling: Central heating (natural gas); Fireplace heating (gas log); Central air; Ceiling fans
- Interior features: Bar; Ceiling fans; Crown molding; Double vanity; Primary bedroom on main level; Tile countertops; Walk-in closet(s); Breakfast bar; Insulated windows; Deadbolt locks; Gas log fireplace
- Laundry & utility: Inside laundry with electric dryer hookup; Gas water heater
Neighborhood map
What this means for you Summary
Snapshot
- This is a 3-bed/4.0-bath single-family listed at $290k.
Deal economics
- At list price, monthly cash flow is $280 ($3k/yr) — positive.
- The deal already cash-flows at list — no discount required.
- To meet the 1% rule (rent ≥ 1% of price), the offer needs to be $264k (8.8% below list).
- Recommended offer: $264k (8.8% below list) — sets the bar for 1% rule.
- Cap rate 7.5% vs local median 3.7% in Madison — top-decile yield for the area; either an underpriced asset or a hidden risk that comps aren't pricing in. Stress-test before assuming the spread holds.
Location & tenants
- Location reads 81/100 on livability (#4 in MS, #1,556 nationally) — a professional / high-income tenant draw. Strengths: crime A+, employment A+, housing A+; Watch: amenities D-, commute F.
- Madison County School District (rural): math 54% / reading 54% proficiency, ranked #3 of 130 in MS (top 2%) — acceptable for families but not a draw, mixed tenant base, ~2y average lease.
- Zoned schools: Mannsdale Elementary (633 students, 100% FRL); Germantown Middle School (math 55% / reading 58%, grade B, #14 of 179 statewide, top 7%, 1,008 students, 100% FRL); Germantown High School (math 34% / reading 41%, grade F, #59 of 197 statewide, top 30%, 1,396 students, 100% FRL) — zoned schools average 100% FRL vs 29% district-wide (70 pts higher); higher-poverty schools than district average — tighter screening recommended.
- Market conditions: Rents rising (+2.6%/yr); 628 active listings in the ZIP; 6 comparable units currently listed for rent nearby; rentals at typical pace (median 22d on market — plan ~3-4 weeks tenant-placement turnaround); high-income renter base; 553 units permitted in Madison County in 2024 (0 in 5+ unit buildings).
Forward outlook
- Local home prices are declining (-3.0%/yr); year-one equity from $2k of loan paydown is wiped out by about $9k of value loss. Plan a longer hold.
- Madison County population projected at +34% by 2050 — long-run rental-demand tailwind backs the buy-and-hold thesis.
Negotiation context
- Only 5 days on market — expect competitive offers; lowballing is unlikely to land.
- 3 sale attempts since 12y ago with the ask held roughly flat each time — persistent listings suggest the price (not the market) is what's stuck; bring a comps-based counter.
Risks & watch-outs
- Climate carrying-cost: major wind risk, 76% chance of damaging wind over 30y; extreme-heat days projected 7→20/yr by 2055 (HVAC capex compounding) — expect insurance premiums to compound above CPI over the hold.
Questions for the listing agent
- What does the HOA fee cover, when was the last increase, and are there any pending special assessments or reserve-fund shortfalls?
- Is there a deadline driving the sale (1031 exchange, divorce, estate, relocation)? That informs how much negotiation room exists.
- Schools are A-rated — typically a magnet for longer-tenancy family renters. What's the average tenant stay here, and is there a school-zone premium baked into asking?
- What's the average days-on-market for RENTAL listings here right now (not sales)? A rising rental-DOM trend means longer vacancies and softer asking-rent achievability than the comps imply.
- What's the recent tenant-quality profile in this submarket — average credit score on applications, eviction rate, late-payment / NSF rate, and stable-employment percentage? A property-management company in the area should have these aggregated.
- How much new for-sale + rental construction is in the pipeline within 1–3 miles? Heavy new supply typically softens prices + rents 12–24 months out; constrained supply supports both.
Investment metrics
- 1% rule
- 0.91% ✗
- Cap rate
- 7.45%
- Cash-on-cash
- 4.14%
- DSCR
- 1.18
- GRM
- 9.1
CMA / ARV
- ARV (median comp)
- $306,146
- List price
- $290,000
- Delta
- -5.27%
- Verdict
- FAIR
- Comps
- 20 within 1.0 mi
Show comp detail 12 sales within ~0.75 mi
| Address | Dist | Beds/Ba | Sqft | Sold | Price | $/sf | Match |
|---|---|---|---|---|---|---|---|
| 108 Sara Scotts Cv | 0.24mi | 3/2.0 | 1,542 (+4%) | 3mo | $290,000 | $188 | 72 |
| 107 Memory Ln | 0.16mi | 3/2.0 | 1,603 (+8%) | 1mo | $309,000 | $193 | 71 |
| 100 Memory Ln | 0.19mi | 3/2.0 | 1,567 (+5%) | 7mo | $285,000 | $182 | 69 |
| 126 Memory Ln | 0.31mi | 3/2.0 | 1,505 (+1%) | 8mo | $280,000 | $186 | 69 |
| 104 Mary Leigh Way | 0.26mi | 3/2.0 | 1,572 (+6%) | 4mo | $292,500 | $186 | 67 |
| 123 Kenzie Dr | 0.17mi | 3/2.0 | 1,580 (+6%) | 10mo | $310,000 | $196 | 66 |
| 172 Memory Ln | 0.43mi | 3/2.0 | 1,525 (+2%) | 4mo | $285,000 | $187 | 64 |
| 198 Memory Ln | 0.41mi | 3/2.0 | 1,550 (+4%) | 4mo | $291,000 | $188 | 63 |
| 194 Memory Ln | 0.42mi | 3/2.0 | 1,507 (+1%) | 12mo | $289,900 | $192 | 60 |
| 1027 Trinity Dr | 0.70mi | 3/2.0 | 1,684 (+13%) | 4mo | $310,000 | $184 | 34 |
| 141 Fieldstone Ln | 0.67mi | 3/2.0 | 1,704 (+14%) | 4mo | $339,000 | $199 | 34 |
| 2012 East Ridge Cir | 0.71mi | 3/2.0 | 1,679 (+13%) | 13mo | $299,999 | $179 | 27 |
Match score weights: distance 35% · size 25% · config 20% · recency 20%. Top-matched comps best support the ARV.
Projected returns pro-forma
-3.0% appreciation · 2.61% rent growth · sell at horizon
- IRR
- -10.3%
- Equity multiple
- 0.63×
- Total profit
- $-30,280
- Equity at exit
- $43,240
- IRR
- -1.5%
- Equity multiple
- 0.90×
- Total profit
- $-7,946
- Equity at exit
- $25,074
Cash invested: $81,200 (down + closing). Projections, not guarantees.
Landlord ↔ Tenant lean methodology
- Overall (STATE)
- 90 Strongly Landlord-Friendly
- State Mississippi
- 90 Strongly Landlord-Friendly · R+11
- County
- — inherits STATE
- City
- — inherits STATE
ZIP-level market 39110
- Home prices YoY
- -28.3%
- Rents YoY
- 2.6%
- Active inventory
- 628
- Price-to-rent
- 9.1×
Monthly cashflow live
- Estimated rent
- $2,645 high interval (Pro) →
- Mortgage (P&I)
- −$1,521
- Tax from tax record
- −$115 /mo · $1,379/yr
- Insurance
- −$121
- HOA
- −$53
- Vacancy / Maint / Mgmt
- −$555
- Net cashflow
- $280
Break-even live
Sensitivity live
| Price | -10% $444 | -5% $362 | +0% $280 | +5% $198 | +10% $116 |
|---|---|---|---|---|---|
| Rent | -10% $71 | -5% $175 | +0% $280 | +5% $384 | +10% $489 |
| Rate | -1.0pp $426 | -0.5pp $354 | base $280 | +0.5pp $205 | +1.0pp $128 |
UW: 25.0% down · 7.5% · 30yr · 1.5% tax · 5.0% vac · 8.0% maint · 8.0% mgmt
Financing live
Cash to close
- Down payment
- $72,500
- Closing costs
- $8,700
- Reserves months
- —
- Total cash needed
- —
Loan-product check · same deal, 3 products live
Conventional
25% down · 7.5% · 30yr
- Down + closing
- —
- Monthly P&I
- —
- Monthly cashflow
- —
- DSCR
- —
- Eligible?
- —
Personal DTI + credit; lowest rate.
DSCR
20% down · 8.5% · 30yr
- Down + closing
- —
- Monthly P&I
- —
- Monthly cashflow
- —
- DSCR
- —
- Eligible?
- —
No personal income docs; deal must DSCR.
Hard money
10% down · 12.0% · 12mo
- Down + closing
- —
- Monthly P&I
- —
- Monthly cashflow
- —
- DSCR
- —
- Eligible?
- —
Short-term bridge; refi at stabilization.
Rent comps 6 comps
| Address | Beds | Baths | Sqft | Rent | $/sqft | DOM | Units | Dist |
|---|---|---|---|---|---|---|---|---|
| 100 Mason Way Madison, MS | 3.0 | 2.0 | 1614 | $2,600 | $1.61 | 44d | 1 | 0.23mi |
| 125 Memory Ln Madison, MS | 3.0 | 2.0 | 1838 | $2,800 | $1.52 | 24d | 1 | 0.31mi |
| 1998 E Ridge Cir Madison, MS | 3.0 | 2.0 | 1705 | $2,450 | $1.44 | 14d | 1 | 0.71mi |
| 1843 August Bnd Madison, MS | 3.0 | 2.0 | 1628 | $2,350 | $1.44 | 14d | 1 | 0.75mi |
| 113 Providence Dr Madison, MS | 3.0 | 2.0 | 1764 | $2,300 | $1.30 | 22d | 1 | 0.87mi |
| 112 Copper Ridge Ct Madison, MS | 3.0 | 2.0 | 1600 | $2,495 | $1.56 | 14d | 1 | 1.47mi |
HOA detail
- Monthly dues
- $53 · $636/yr
- Likely covers
- pool
Listing history 8 events
-
2026-05-05status Pending 1474-char remark
-
2026-04-30$290,000 Active 1474-char remark
-
2021-10-08historical
-
2018-10-30soldstatus
-
2018-10-26soldstatus
Show marketing remark (107 chars)
Heart of Ashbrooke! High ceilings, modern layout, new carpet and paint!! Move in Ready!! Walk to the Pool!!
-
2018-07-24$189,999
Show marketing remark (107 chars)
Heart of Ashbrooke! High ceilings, modern layout, new carpet and paint!! Move in Ready!! Walk to the Pool!!
-
2014-04-26$197,200
-
2007-12-26soldstatus
ⓘ Source: listings_history table (triggers on properties + properties_extension) + one-shot
backfill from property_details.listing_events for pre-trigger history.
Tax reassessment forecast MS · Resets to sale price
- Current annual tax
- $1,379 · $115/mo
- Projected year-2 tax
- $2,291 · $191/mo
- Expected delta
- +$912/yr (+$76/mo · 66.1%)
ⓘ Screening estimate from a state-policy table — verify with the county assessor before closing.
Climate risk First Street
- Flood 1/10 Low FEMA zone X (unshaded) · 0% chance over 30 yrs
- Wildfire 1/10 Low
- Heat 7/10 Severe 7 d/yr ≥108°F today · 20 d/yr by 30 yrs out
- Wind 6/10 Major 76% chance of damaging wind over 30 yrs
- Air quality 2/10 Low 0 unhealthy d/yr today · 1 by 30 yrs out
Nearby sold comps map
Loading sold comps map…
Walkable amenities ~0.75 mi
Loading nearby amenities…
Taxation est. · year 1
- Rental income
- $31,738
- − Mortgage interest
- −$16,245
- − Property taxes
- −$1,379
- − Insurance
- −$1,450
- − Repairs & maintenance
- −$2,539
- − Management
- −$2,539
- − HOA
- −$636
- − Depreciation
- −$8,436
- Taxable loss
- −$1,486
- Est. tax savings @ 24.0%
- +$357
- After-tax cash flow
- $3,715/yr
For passive investors: Depreciation is non-cash, so a rental often shows a tax loss while cash-flowing — sheltering income. Rental losses are passive: they offset passive income freely, and up to $25,000/yr can offset ordinary (W-2) income if you actively participate and your MAGI is under $100k (phasing out to $0 by $150k); unused losses carry forward. On sale, claimed depreciation is recaptured at up to 25%, and gains may owe capital-gains tax (a 1031 exchange can defer both). Figures are a year-1 estimate at your 24.0% rate — not tax advice; consult a CPA.
Schools (NCES district)
- District
- Madison County School District
- NCES district ID
- 2802790
- Math proficiency
- 54% ▼ -7.00%
- Reading proficiency
- 54% ▼ -7.00%
- Median HH income
- $70,579
- Composite
- 48.08/100
- National rank
- #2188
- State rank
- #3 of 130 in MS
Livability — Madison
- Score
- 81/100
- State rank
- #4
- US rank
- #1556
Category grades
Schools grade is shown separately in the Schools card above.
Census & demographics
- County
- Madison County · 75,005 people
- City population
- 50,443
- Metro
- Jackson, MS
- Population (ZIP)
- 50,443
- Household income
- $125,506
- Rent vs Own
- Severe rent burden
- 227.0
Population outlook (Madison County) Hauer SSP2
- Today (2025)
- 122,509 people
- By 2030
- 131,737 · +7.5%
- By 2040
- 148,930 · +21.6%
- By 2050
- 164,300 · +34.1%
- By 2075
- 197,495 · +61.2%
- By 2100
- 211,429 · +72.6%
Race, ethnicity, and origin ACS 2023
- Neighborhood character
- Predominantly White (76%)
- Race & ethnicity
- White 76% Black 15% Asian 4% Two or more races 3% Hispanic / Latino 2%
- Common ancestry
- Italian 6% Slovak 3% Lithuanian 3%
- Foreign-born
- 5% · China, Canada
- Languages at home
- 92% English-only · Spanish 2% Other Indo-European 2% Chinese 1%
Political lean MEDSL · Madison
- 2024 margin
- R (+17.3) · D 40.8% · R 58.0% · Other 1.2%
- 2008→2024 swing
- -1.7pp toward R · 2008: -15.6pp · 2024: -17.3pp
- All cycles
- 2024: R+17.3 2020: R+11.8 2016: R+16.1 2012: R+15.7 2008: R+15.6
Not yet ingested
- Civics
- —
Market trends
- HPI YoY
- ▼ -60.99%
- Current HPI
- 154.6909
- Rent YoY
- ▲ 2.61%
- Metro
- Jackson, MS
- State GDP YoY
- —
- F500 in state
- 0
Price history
+47.1% since first listed10 events — show timeline
- 2026-06-09 Sold (Public Records) — Public Records
- 2026-06-08 Sold (MLS) — MLSU
- 2026-05-05 Pending — MLSU
- 2026-04-30 Listed $290,000 MLSU
- 2021-10-08 Listing Removed — MLSU
- 2018-10-30 Sold (Public Records) — Public Records
- 2018-10-26 Sold (MLS) — MLSU
- 2018-07-24 Listed $189,999 MLSU
- 2014-04-26 Listed $197,200 MLSU
- 2007-12-26 Sold (Public Records) — Public Records
Property tax history
-0.4%/yrLatest (2025): $1,379 · -0.6% YoY. Source: county tax records.
Cash-flow waterfall
monthlySold comps — $/sqft
last 12 mo · ≤1 miLoading sold comps…