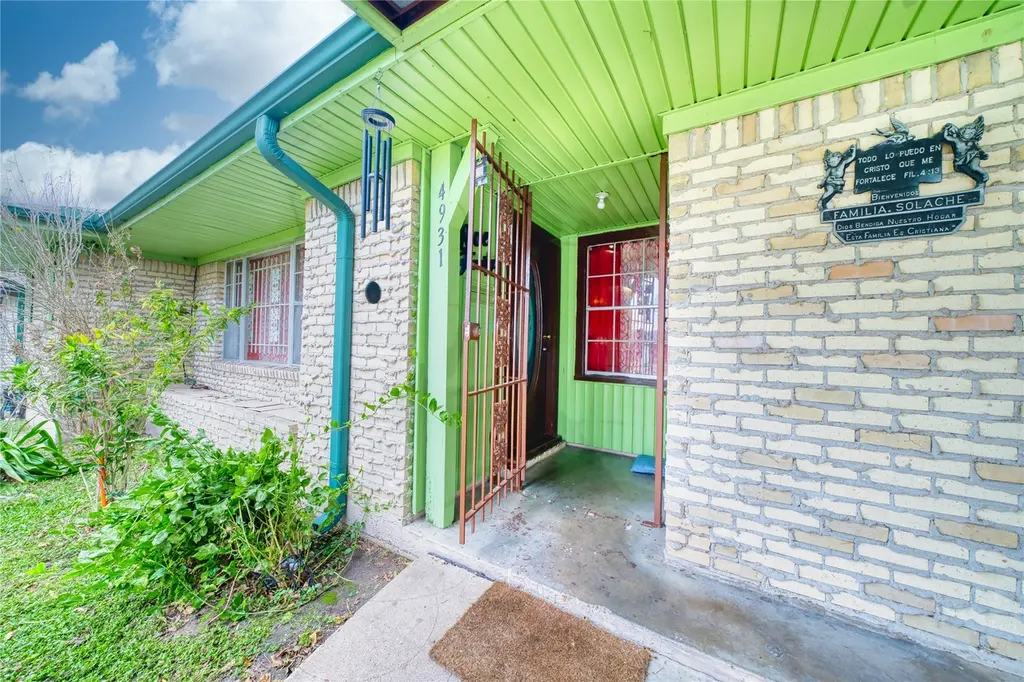
4931 Mercedes Ln · Houston, TX
Flood risk 6/10 · Moderate
- FEMA flood zone
- AE
- Chance of flooding over 30 yrs
- 0.72%
- Est. flood insurance / yr
- $1,737 – $8,500
Fire risk 1/10 · Minimal
- Est. fire insurance / yr
- $1,222 – $2,270
Heat risk 9/10 · Severe
- Hot days now (above 109°F)
- 7 days/yr
- Hot days in 30 yrs
- 24 days/yr
Wind risk 8/10 · Major
- Chance of severe wind over 30 yrs
- 99.0%
Air-quality risk 3/10 · Minor
- Unhealthy air days now
- 2 days/yr
- Unhealthy air days in 30 yrs
- 3 days/yr
Risk factors via First Street. Map © Google.
Why this score? — see what drove the C grade
The composite is a weighted blend of 9 inputs, each scored 0–100. Each bar is that input's sub-score; the figure is the points it added to the 100-point composite (weight × sub-score).
- Cash flow +21.3/30.0
- ARV discount +11.8/15.0
- DSCR +6.8/10.0
- 1% rule +5.9/10.0
- Livability +3.7/5.0
- Rent growth +3.6/5.0
- Schools +2.7/10.0
- Condition / age +2.5/5.0
- Appreciation +0.0/10.0
$180,000
🖨 Deal sheet 📄 Offer letter ✓ Due diligence
Listing remarks MLS
Welcome to this charming and beautifully maintained home that blends comfort, style, and functionality. Featuring 3 spacious bedrooms and 1 well-appointed bathroom, this residence offers a warm, inviting layout that feels like home the moment you walk in. Inside, you’ll find tile flooring throughout, creating a clean, cohesive look that’s both stylish and easy to maintain. The home has been lovingly cared for and is truly move-in ready. The expansive backyard is a standout feature, offering endless possibilities for entertaining, gardening, or simply enjoying outdoor living. While there’s no garage, the generous lot provides flexibility and room to make the space your own. Perfectly for the one looking at a well-kept home with great outdoor space, this one is a must-see.
Key facts
- Generous lot
- Tile flooring
- Expansive backyard
Tags
Neighborhood map
What this means for you Summary
Snapshot
- This is a 2-bed/1.0-bath single-family listed at $180k.
Deal economics
- At list price, monthly cash flow is $-162 ($-2k/yr) — negative.
- To cash-flow at today's rent, offer at most $151k (15.9% below list).
- Meets the 1% rule at list price ($2k rent vs $180k).
- Recommended offer: $151k (15.9% below list) — sets the bar for cash-flow.
- Cap rate 8.1% vs local median 3.2% in Houston — top-decile yield for the area; either an underpriced asset or a hidden risk that comps aren't pricing in. Stress-test before assuming the spread holds.
Location & tenants
- Location reads 74/100 on livability (#184 in TX, #4,771 nationally) — a middle-class / working-renter tenant base. Strengths: amenities A+, cost of living A+, housing A+; Watch: schools D, crime F.
- Houston ISD (urban): math 27% / reading 35% proficiency, ranked #593 of 826 in TX (top 72%) — families likely to look elsewhere, expect single-tenant / working-renter base with shorter leases; 71% free/reduced lunch — lower-income household profile, screen leases tightly.
- Market conditions: Rents rising fast (+4.5%/yr); 285 active listings in the ZIP; 28 comparable units currently listed for rent nearby; rentals at typical pace (median 25d on market — plan ~3-4 weeks tenant-placement turnaround); 43% of comp listings sitting > 30 days — soft ceiling on asking rent; 29,883 units permitted in Harris County in 2024 (8,621 in 5+ unit buildings).
- This rent runs 45% of the median local income ($53k/yr) — at the standard rent-burdened threshold; future hikes will face affordability resistance.
Forward outlook
- Local home prices are declining (-3.0%/yr); year-one equity from $1k of loan paydown is wiped out by about $5k of value loss. Plan a longer hold.
- Harris County population projected at +47% by 2050 — long-run rental-demand tailwind backs the buy-and-hold thesis.
Negotiation context
- It's been on market 155 days — a 12% lower offer ($158k) is reasonable based on typical stale-listing flexibility.
- 5 sale attempts since 13y ago; this cycle's ask has dropped $20k (10%) from the opening price — seller is motivated, your offer sets the floor, not the list.
Risks & watch-outs
- Watch-outs: flood insurance adds $427/mo; built in 1954 — expect roof / HVAC / electrical / plumbing capex.
- Climate carrying-cost: in FEMA flood zone AE (mandatory federal flood insurance); severe wind risk, 99% chance of damaging wind over 30y; extreme-heat days projected 7→24/yr by 2055 (HVAC capex compounding) — expect insurance premiums to compound above CPI over the hold.
Questions for the listing agent
- What do current leases actually rent for vs. the listed asking? Can we see a recent rent roll and the last 12 months of T-12 income?
- It's been on market 155 days. Have you received any prior offers? Is the seller open to a 16% concession, seller financing, or rate buy-down credit?
- Built in 1954 — when were the roof, HVAC, electrical panel, plumbing, and water heater last replaced?
- What's the actual annual flood-insurance premium (NFIP or private), and is the property in a SFHA with mandatory coverage?
- Why hasn't it sold? Are there any deal-killer items the seller is aware of (foundation, flood, title, zoning, code violations)?
- Is there a deadline driving the sale (1031 exchange, divorce, estate, relocation)? That informs how much negotiation room exists.
- Schools are D-rated, which usually means shorter tenancies and higher turnover. Who's the typical renter profile here, and what's been the actual vacancy rate?
- Crime grade is F in this area — have there been break-ins, vandalism, or insurance claims at this property in the last 3 years? What carrier currently insures it and at what premium?
- What's the average days-on-market for RENTAL listings here right now (not sales)? A rising rental-DOM trend means longer vacancies and softer asking-rent achievability than the comps imply.
- What's the recent tenant-quality profile in this submarket — average credit score on applications, eviction rate, late-payment / NSF rate, and stable-employment percentage? A property-management company in the area should have these aggregated.
- How much new for-sale + rental construction is in the pipeline within 1–3 miles? Heavy new supply typically softens prices + rents 12–24 months out; constrained supply supports both.
Investment metrics
- 1% rule
- 1.09% ✓
- Cap rate
- 8.06%
- Cash-on-cash
- 6.31%
- DSCR
- 1.28
- GRM
- 7.6
CMA / ARV
- ARV (median comp)
- $198,936
- List price
- $180,000
- Delta
- -9.52%
- Verdict
- FAIR
- Comps
- 20 within 1.0 mi
Show comp detail 12 sales within ~0.75 mi
| Address | Dist | Beds/Ba | Sqft | Sold | Price | $/sf | Match |
|---|---|---|---|---|---|---|---|
| 602 Gammon Dr | 0.15mi | 3/1.0 (+1) | 1,475 (-3%) | 0mo | $65,000 | $44 | 82 |
| 330 Spell St | 0.24mi | 2/1.0 | 1,396 (-8%) | 6mo | $185,000 | $133 | 70 |
| 510 Victoria Dr | 0.27mi | 3/1.0 (+1) | 1,384 (-9%) | 6mo | $280,000 | $202 | 62 |
| 707 Apogee Trl | 0.48mi | 3/2.5 (+1) | 1,592 (+4%) | 2mo | $300,000 | $188 | 57 |
| 247 E Janisch Rd | 0.31mi | 3/2.0 (+1) | 1,340 (-12%) | 1mo | $289,000 | $216 | 56 |
| 714 E Rogers St | 0.45mi | 3/1.0 (+1) | 1,403 (-8%) | 11mo | $590,000 | $421 | 52 |
| 4423 Harvard St | 0.73mi | 2/1.5 | 1,570 (+3%) | 9mo | $365,000 | $232 | 51 |
| 11 Wellford St Unit D | 0.60mi | 3/2.5 (+1) | 1,556 (+2%) | 10mo | $338,990 | $218 | 49 |
| 107 Knightsbridge Park Ln | 0.68mi | 3/2.5 (+1) | 1,554 (+2%) | 10mo | $325,000 | $209 | 46 |
| 127 E Thornton Rd | 0.59mi | 3/2.0 (+1) | 1,703 (+12%) | 8mo | $325,000 | $191 | 37 |
| 107 W Whitney St Unit E | 0.69mi | 3/2.5 (+1) | 1,736 (+14%) | 1mo | $314,900 | $181 | 33 |
| 4310 Busiek St | 0.72mi | 3/1.0 (+1) | 1,332 (-12%) | 9mo | $139,900 | $105 | 33 |
Match score weights: distance 35% · size 25% · config 20% · recency 20%. Top-matched comps best support the ARV.
Projected returns pro-forma
-3.0% appreciation · 4.47% rent growth · sell at horizon
- IRR
- -20.2%
- Equity multiple
- 0.28×
- Total profit
- $-36,207
- Equity at exit
- $26,839
- IRR
- -9.1%
- Equity multiple
- 0.38×
- Total profit
- $-31,057
- Equity at exit
- $15,563
Cash invested: $50,400 (down + closing). Projections, not guarantees.
Landlord ↔ Tenant lean methodology
- Overall (STATE)
- 87 Strongly Landlord-Friendly
- State Texas
- 87 Strongly Landlord-Friendly · R+5
- County
- — inherits STATE
- City
- — inherits STATE
ZIP-level market 77022
- Home prices YoY
- -33.2%
- Rents YoY
- 4.5%
- Active inventory
- 285
- Price-to-rent
- 7.6×
Monthly cashflow live
- Estimated rent
- $1,962 high interval (Pro) →
- Mortgage (P&I)
- −$944
- Tax from tax record
- −$266 /mo · $3,192/yr
- Insurance
- −$75
- Flood insurance flood zone
- −$427 /mo · $5,118/yr
- HOA
- −$0
- Vacancy / Maint / Mgmt
- −$412
- Net cashflow
- $-162
Break-even live
UW: 25.0% down · 7.5% · 30yr · 1.5% tax · 5.0% vac · 8.0% maint · 8.0% mgmt
Financing live
Cash to close
- Down payment
- $45,000
- Closing costs
- $5,400
- Reserves months
- —
- Total cash needed
- —
Loan-product check · same deal, 3 products live
Conventional
25% down · 7.5% · 30yr
- Down + closing
- —
- Monthly P&I
- —
- Monthly cashflow
- —
- DSCR
- —
- Eligible?
- —
Personal DTI + credit; lowest rate.
DSCR
20% down · 8.5% · 30yr
- Down + closing
- —
- Monthly P&I
- —
- Monthly cashflow
- —
- DSCR
- —
- Eligible?
- —
No personal income docs; deal must DSCR.
Hard money
10% down · 12.0% · 12mo
- Down + closing
- —
- Monthly P&I
- —
- Monthly cashflow
- —
- DSCR
- —
- Eligible?
- —
Short-term bridge; refi at stabilization.
Rent comps 28 comps
| Address | Beds | Baths | Sqft | Rent | $/sqft | DOM | Units | Dist |
|---|---|---|---|---|---|---|---|---|
| 450 E Rogers St Houston, TX | 1.0–3.0 | 1.0–2.0 | 911 | $1,338 | $1.47 | 2d | 14 | 0.35mi |
| 148 Knightsbridge Park Ln Houston, TX | 3.0 | 2.5 | 1580 | $2,500 | $1.58 | 43d | 1 | 0.58mi |
| 4605 Lavatera St Houston, TX | 3.0 | 2.5 | 1686 | $2,265 | $1.34 | 22d | 1 | 0.73mi |
| 316 Thornton Rd Houston, TX | 3.0 | 3.5 | 1828 | $2,500 | $1.37 | 43d | 1 | 0.73mi |
| 4813 Martin Oaks Ln Houston, TX | 3.0 | 4.0 | 1972 | $2,200 | $1.12 | 43d | 1 | 0.79mi |
| 5342 Donovan Gardens Ln Unit 1521013P Houston, TX | 3.0 | 3.0 | 1743 | $2,985 | $1.71 | 7d | 1 | 0.86mi |
| 8502 N Main St Houston, TX | 3.0 | 2.0 | 1514 | $1,685 | $1.11 | 21d | 1 | 0.90mi |
| 221 W 44th St Houston, TX | 3.0 | 2.0 | 1300 | $1,600 | $1.23 | 43d | 1 | 0.93mi |
| 4132 Europa St Houston, TX | 3.0 | 2.0 | 1259 | $1,430 | $1.14 | 13d | 1 | 0.95mi |
| 622 Janisch Rd Houston, TX | 3.0 | 4.0 | 1785 | $2,650 | $1.48 | 43d | 1 | 1.02mi |
| 619 Thornton Oaks Ln Unit Labs Houston, TX | 3.0 | 2.5 | 1657 | $2,200 | $1.33 | 7d | 1 | 1.02mi |
| 4840 N Shepherd Dr Houston, TX | 3.0 | 1.0–2.0 | 870 | $2,057 | $2.36 | 3d | 21 | 1.05mi |
| 221 Oriole St Houston, TX | 3.0 | 2.5 | 1461 | $2,083 | $1.43 | 24d | 1 | 1.11mi |
| 611 E 39th St Houston, TX | 2.0 | 2.0 | 1326 | $2,099 | $1.58 | 43d | 1 | 1.13mi |
| 641 W Crosstimbers St Houston, TX | 1.0–2.0 | 1.0–2.0 | 866 | $2,171 | $2.51 | 2d | 38 | 1.17mi |
| 538 E 38th St Houston, TX | 3.0 | 2.5 | 1521 | $2,300 | $1.51 | 43d | 1 | 1.21mi |
| 717 Lehman St Houston, TX | 1.0–3.0 | 1.0–3.0 | 1084 | $2,362 | $2.18 | 4d | 263 | 1.22mi |
| 717 Janisch Rd Unit B Houston, TX | 3.0 | 3.5 | 1821 | $2,750 | $1.51 | 24d | 1 | 1.24mi |
| 717 Janisch Rd Unit B Houston, TX | 3.0 | 3.5 | 1821 | $2,750 | $1.51 | 43d | 1 | 1.24mi |
| 139 Van Molan St Houston, TX | 1.0 | 1.0 | 1056 | $925 | $0.88 | 43d | 1 | 1.29mi |
| 313 Sunnyside St Houston, TX | 1.0–3.0 | 1.0–2.0 | 922 | $1,071 | $1.16 | 43d | 16 | 1.32mi |
| 313 Sunnyside St Houston, TX | 1.0–2.0 | 1.0–1.5 | 880 | $1,301 | $1.48 | 2d | 24 | 1.32mi |
| 910 1/2 Oak St Houston, TX | 3.0 | 2.0 | 1526 | $1,995 | $1.31 | 43d | 1 | 1.33mi |
| 3514 Ajax St Unit 1047956P Houston, TX | 3.0 | 2.5 | 1689 | $3,114 | $1.84 | 7d | 1 | 1.34mi |
| 5115 Royal Heath Dr Houston, TX | 3.0 | 2.5 | 1600 | $2,175 | $1.36 | 24d | 1 | 1.36mi |
| 9910 Clark Rd Unit B Houston, TX | 3.0 | 2.5 | 1695 | $1,900 | $1.12 | 7d | 1 | 1.37mi |
| 714 W Tidwell Rd Houston, TX | 2.0 | 1.0 | 1296 | $1,094 | $0.84 | 43d | 1 | 1.39mi |
| 209 Clark Meadows Ln Houston, TX | 3.0 | 2.5 | 1620 | $2,399 | $1.48 | 13d | 1 | 1.39mi |
Listing history 30 events
-
2026-06-18days on market $180,000 Active 155 DOM
-
2026-06-17days on market $180,000 Active 154 DOM
-
2026-06-16days on market $180,000 Active 153 DOM
-
2026-06-15days on market $180,000 Active 152 DOM
-
2026-06-13days on market $180,000 Active 150 DOM
-
2026-06-10pricedays on market $180,000 Active 146 DOM
-
2026-06-08days on market $192,900 Active 145 DOM
-
2026-06-07days on market $192,900 Active 144 DOM
-
2026-06-04days on market $192,900 Active 141 DOM
-
2026-06-01days on market $192,900 Active 138 DOM
-
2026-05-31days on market $192,900 Active 137 DOM
-
2026-04-25price $192,999 808-char remark
Show marketing remark (808 chars)
Welcome to this charming and beautifully maintained home that blends comfort, style, and functionality. Featuring 3 spacious bedrooms and 1 well-appointed bathroom, this residence offers a warm, inviting layout that feels like home the moment you walk in. Inside, you’ll find tile flooring throughout, creating a clean, cohesive look that’s both stylish and easy to maintain. The home has been lovingly cared for and is truly move-in ready. The expansive backyard is a standout feature, offering endless possibilities for entertaining, gardening, or simply enjoying outdoor living. While there’s no garage, the generous lot provides flexibility and room to make the space your own. Perfectly for the one looking at a well-kept home with great outdoor space, this one is a must-see.
-
2026-01-14$199,999 Active 808-char remark
Show marketing remark (808 chars)
Welcome to this charming and beautifully maintained home that blends comfort, style, and functionality. Featuring 3 spacious bedrooms and 1 well-appointed bathroom, this residence offers a warm, inviting layout that feels like home the moment you walk in. Inside, you’ll find tile flooring throughout, creating a clean, cohesive look that’s both stylish and easy to maintain. The home has been lovingly cared for and is truly move-in ready. The expansive backyard is a standout feature, offering endless possibilities for entertaining, gardening, or simply enjoying outdoor living. While there’s no garage, the generous lot provides flexibility and room to make the space your own. Perfectly for the one looking at a well-kept home with great outdoor space, this one is a must-see.
-
2020-11-03historical
-
2020-10-27price $149,999
-
2020-10-16status Active
-
2020-10-09status Pending
-
2020-09-22status Option Pending
-
2020-09-16price $155,900
-
2020-08-04$158,000 Active
-
2013-09-23historical
-
2013-09-22soldstatus Sold
-
2013-09-20soldstatus
-
2013-08-27status Pending
-
2013-07-27status Pending, Continue to Show
-
2013-07-17status Option Pending
-
2013-05-16status Active
-
2013-05-04status Pending
-
2013-04-25$62,000 Active
-
1988-01-02soldstatus
ⓘ Source: listings_history table (triggers on properties + properties_extension) + one-shot
backfill from property_details.listing_events for pre-trigger history.
Tax reassessment forecast TX · Resets to sale price
- Current annual tax
- $3,192 · $266/mo
- Projected year-2 tax
- $3,294 · $274/mo
- Expected delta
- +$102/yr (+$9/mo · 3.2%)
ⓘ Screening estimate from a state-policy table — verify with the county assessor before closing.
Climate risk First Street
- Flood 6/10 Major FEMA zone AE · 72% chance over 30 yrs
- Wildfire 1/10 Low
- Heat 9/10 Extreme 7 d/yr ≥109°F today · 24 d/yr by 30 yrs out
- Wind 8/10 Severe 99% chance of damaging wind over 30 yrs
- Air quality 3/10 Moderate 2 unhealthy d/yr today · 3 by 30 yrs out
Nearby sold comps map
Loading sold comps map…
Walkable amenities ~0.75 mi
Loading nearby amenities…
Taxation est. · year 1
- Rental income
- $23,540
- − Mortgage interest
- −$10,083
- − Property taxes
- −$3,192
- − Insurance
- −$6,018
- − Repairs & maintenance
- −$1,883
- − Management
- −$1,883
- − Depreciation
- −$5,236
- Taxable loss
- −$4,756
- Est. tax savings @ 24.0%
- +$1,141
- After-tax cash flow
- $-799/yr
For passive investors: Depreciation is non-cash, so a rental often shows a tax loss while cash-flowing — sheltering income. Rental losses are passive: they offset passive income freely, and up to $25,000/yr can offset ordinary (W-2) income if you actively participate and your MAGI is under $100k (phasing out to $0 by $150k); unused losses carry forward. On sale, claimed depreciation is recaptured at up to 25%, and gains may owe capital-gains tax (a 1031 exchange can defer both). Figures are a year-1 estimate at your 24.0% rate — not tax advice; consult a CPA.
Schools (NCES district)
- District
- Houston ISD
- NCES district ID
- 4823640
- Math proficiency
- 27% ▼ -18.00%
- Reading proficiency
- 35% ▼ -6.00%
- Median HH income
- $46,054
- Composite
- 26.63/100
- National rank
- #7173
- State rank
- #593 of 826 in TX
Livability — Houston
- Score
- 74/100
- State rank
- #184
- US rank
- #4771
Category grades
Schools grade is shown separately in the Schools card above.
Census & demographics
- Census place
- Houston, TX
- County
- Harris County · 4,702,590 people
- City population
- 3,226,434
- Metro
- Houston-The Woodlands-Sugar Land, TX
- Population (ZIP)
- 25,805
- Household income
- $52,739
- Rent vs Own
- Severe rent burden
- 1354.0
Population outlook (Harris County) Hauer SSP2
- Today (2025)
- 5,571,493 people
- By 2030
- 6,089,821 · +9.3%
- By 2040
- 7,142,806 · +28.2%
- By 2050
- 8,185,864 · +46.9%
- By 2075
- 10,574,329 · +89.8%
- By 2100
- 12,109,958 · +117.4%
Race, ethnicity, and origin ACS 2023
- Neighborhood character
- Predominantly Hispanic (72%)
- Race & ethnicity
- Hispanic / Latino 72% Two or more races 24% Black 19% White 7% Native American 1%
- Hispanic origin (detail)
- Mexican 54%
- Common ancestry
- Romanian 1% Portuguese 1%
- Foreign-born
- 30% · Canada, Jamaica
- Languages at home
- 40% English-only · Spanish 59%
Political lean MEDSL · Harris
- 2024 margin
- Lean D (+5.5) · D 52.0% · R 46.4% · Other 1.6%
- 2008→2024 swing
- +3.9pp toward D · 2008: 1.6pp · 2024: 5.5pp
- All cycles
- 2024: D+5.5 2020: D+13.3 2016: D+12.4 2012: D+0.1 2008: D+1.6
Not yet ingested
- Civics
- —
Market trends
- HPI YoY
- ▼ -151.13%
- Current HPI
- 304.3745
- Rent YoY
- ▲ 4.47%
- Metro
- Houston-The Woodlands-Sugar Land, TX
- State GDP YoY
- ▲ 3.95%
- F500 in state
- 110
Industry mix (Fortune 500 HQ in TX)
| Industry | F500 HQs | Revenue |
|---|---|---|
| Energy | 16 | $1,198B |
|
||
| Technology | 5 | $198B |
|
||
| Engineering / Construction | 4 | $72B |
|
||
| Energy Services | 3 | $60B |
|
||
| Utilities | 3 | $41B |
|
||
| Healthcare | 2 | $330B |
|
||
Price history
+211.3% since first listed19 events — show timeline
- 2026-04-25 Price Changed $192,999 HARMLS
- 2026-01-14 Listed $199,999 HARMLS
- 2020-11-03 Listing Removed — HARMLS
- 2020-10-27 Price Changed $149,999 HARMLS
- 2020-10-16 Relisted — HARMLS
- 2020-10-09 Pending — HARMLS
- 2020-09-22 Pending — HARMLS
- 2020-09-16 Price Changed $155,900 HARMLS
- 2020-08-04 Listed $158,000 HARMLS
- 2013-09-23 Listing Removed — HARMLS
- 2013-09-22 Sold (MLS) — HARMLS
- 2013-09-20 Sold (Public Records) — Public Records
- 2013-08-27 Pending — HARMLS
- 2013-07-27 Pending — HARMLS
- 2013-07-17 Pending — HARMLS
- 2013-05-16 Relisted — HARMLS
- 2013-05-04 Pending — HARMLS
- 2013-04-25 Listed $62,000 HARMLS
- 1988-01-02 Sold (Public Records) — Public Records
Property tax history
+8.7%/yrLatest (2025): $3,192 · -1.3% YoY. Source: county tax records.
Cash-flow waterfall
monthlySold comps — $/sqft
last 12 mo · ≤1 miLoading sold comps…