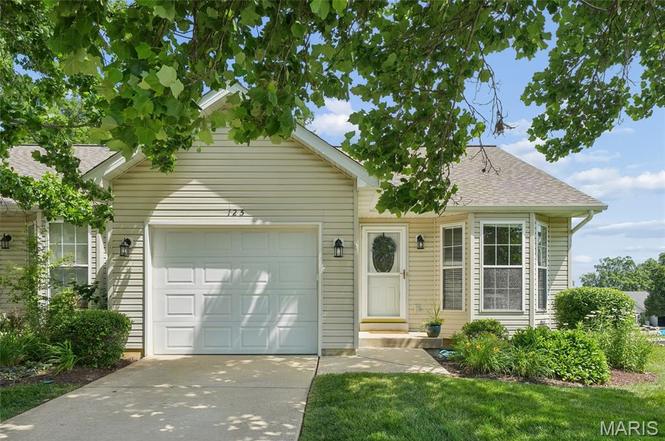
125 Fort Hancock Cir · Wright City, MO
Flood risk 1/10 · Minimal
- FEMA flood zone
- X (unshaded)
- Chance of flooding over 30 yrs
- 0.0%
- Est. flood insurance / yr
- $473 – $860
Fire risk 1/10 · Minimal
- Est. fire insurance / yr
- $1,054 – $1,958
Heat risk 4/10 · Minor
- Hot days now (above 106°F)
- 7 days/yr
- Hot days in 30 yrs
- 19 days/yr
Wind risk 2/10 · Minimal
- Chance of severe wind over 30 yrs
- 1.0%
Air-quality risk 1/10 · Minimal
- Unhealthy air days now
- 0 days/yr
- Unhealthy air days in 30 yrs
- 0 days/yr
Risk factors via First Street. Map © Google.
Why this score? — see what drove the F grade
The composite is a weighted blend of 9 inputs, each scored 0–100. Each bar is that input's sub-score; the figure is the points it added to the 100-point composite (weight × sub-score).
- ARV discount +7.5/15.0
- Cash flow +4.2/30.0
- Livability +3.4/5.0
- Schools +3.2/10.0
- Rent growth +2.5/5.0
- Condition / age +2.5/5.0
- 1% rule +1.1/10.0
- DSCR +0.0/10.0
- Appreciation +0.0/10.0
$230,000
🖨 Deal sheet (PDF) 📄 Offer letter ✓ Due diligence
Listing remarks
This charming two-bedroom, three-bathroom house offers approximately 1,212 square feet of living space. The home features a yard, which provides a tranquil outdoor area for relaxation or entertaining. The property also has the potential to accommodate a third bedroom, making it suitable for a variety of living arrangements. The primary bedroom includes an ensuite bathroom, offering privacy and convenience. The finished basement, which is uncommon in this community, adds valuable additional living space and a full bathroom, providing opportunities for a home office, potential 3rd bedroom, or recreational area. The home also boasts a private deck, which can be utilized for outdoor enjoyment o
Key facts
- Private deck
- Finished basement
- Bamboo flooring
Tags
Property features AI
Finance
- Other:
- Financial info:
- HOA & community: Villas of Spring Lakes community; Monthly HOA fee of $305; HOA covers grounds maintenance, common area maintenance, management, pest control, roof, snow removal, and trash; Common ground amenity
Exterior
- Parking: Attached garage (1-car); Additional parking
- Security:
- Utilities: Public water; Public sewer; Single-phase electric service; Cable available
- Home design: Residential villa (attached); One-level layout; Entry level: Main
- Construction: Concrete construction; Asphalt roof
- Exterior features: Covered patio/porch; Deck; Porch; Adjoins common ground; Views
Interior
- Kitchen: Refrigerator
- Bedrooms: 2 bedrooms (both on the main level)
- Flooring: Bamboo flooring
- Bathrooms: 3 full bathrooms (2 on main level, 1 in lower level)
- Heating & cooling: Electric forced-air heating; Central air conditioning
- Interior features: Ceiling fan(s); Eat-in kitchen; Open floorplan
- Laundry & utility:
Neighborhood map
What this means for you Summary
Snapshot
- This is a 2-bed/2.0-bath condo listed at $230k.
Deal economics
- At list price, monthly cash flow is $-619 ($-7k/yr) — negative.
- To cash-flow at today's rent, offer at most $121k (47.5% below list).
- To meet the 1% rule (rent ≥ 1% of price), the offer needs to be $141k (38.7% below list).
- Recommended offer: $121k (47.5% below list) — sets the bar for cash-flow.
Location & tenants
- Location reads 68/100 on livability (#194 in MO) — a middle-class / working-renter tenant base. Strengths: crime A+, cost of living A+, housing A+; Watch: amenities F, commute F, health & safety F.
- Wright City R-II Of Warren County (town): math 32% / reading 41% proficiency, ranked #179 of 324 in MO (top 55%) — families likely to look elsewhere, expect single-tenant / working-renter base with shorter leases.
- Zoned schools: Wright City East Elem (282 students, 48% FRL); Wright City Middle (math 27% / reading 39%, grade F, #265 of 391 statewide, top 69%, 395 students, 50% FRL); Wright City High (math 17% / reading 42%, grade F, #382 of 521 statewide, top 78%, 536 students, 41% FRL) — zoned schools at 46% FRL track the district average.
- Market conditions: 267 active listings in the ZIP; 1 comparable units currently listed for rent nearby; 424 units permitted in Warren County in 2024 (126 in 5+ unit buildings).
Forward outlook
- Local home prices are declining (-3.0%/yr); year-one equity from $2k of loan paydown is wiped out by about $7k of value loss. Plan a longer hold.
Negotiation context
- Only 1 days on market — expect competitive offers; lowballing is unlikely to land.
- 2 sale attempts with the ask held roughly flat each time — persistent listings suggest the price (not the market) is what's stuck; bring a comps-based counter.
Risks & watch-outs
- Watch-outs: HOA is 22% of rent.
Questions for the listing agent
- What do current leases actually rent for vs. the listed asking? Can we see a recent rent roll and the last 12 months of T-12 income?
- What does the HOA fee cover, when was the last increase, and are there any pending special assessments or reserve-fund shortfalls?
- Any open or pending special assessments — roof, HVAC, plumbing, elevator, façade? What's the per-unit balance and payoff schedule, and is the seller paying it off at close or rolling it to the buyer?
- Is there a deadline driving the sale (1031 exchange, divorce, estate, relocation)? That informs how much negotiation room exists.
- The area grade is low — what's the realistic commute time and amenity access for the typical tenant pool here? Any planned neighborhood developments (good or bad) we should know about?
- What's the average days-on-market for RENTAL listings here right now (not sales)? A rising rental-DOM trend means longer vacancies and softer asking-rent achievability than the comps imply.
- What's the recent tenant-quality profile in this submarket — average credit score on applications, eviction rate, late-payment / NSF rate, and stable-employment percentage? A property-management company in the area should have these aggregated.
- How much new apartment / multifamily construction is in the pipeline within 1–3 miles? Heavy new supply (>2% of stock underway) typically softens rents 12–24 months out; light construction supports rent growth.
Investment metrics
- 1% rule
- 0.61% ✗
- Cap rate
- 3.06%
- Cash-on-cash
- -11.53%
- DSCR
- 0.49
- GRM
- 13.6
CMA / ARV
No comps found within radius.
Projected returns pro-forma
-3.0% appreciation · 3.0% rent growth · sell at horizon
- IRR
- -37.3%
- Equity multiple
- -0.19×
- Total profit
- $-76,569
- Equity at exit
- $34,294
- IRR
- -53.6%
- Equity multiple
- -0.82×
- Total profit
- $-116,975
- Equity at exit
- $19,886
Cash invested: $64,400 (down + closing). Projections, not guarantees.
Landlord ↔ Tenant lean methodology
- Overall (STATE)
- 81 Strongly Landlord-Friendly
- State Missouri
- 81 Strongly Landlord-Friendly · R+10
- County
- — inherits STATE
- City
- — inherits STATE
ZIP-level market 63390
- Home prices YoY
- -17.8%
- Active inventory
- 267
- Price-to-rent
- 13.6×
Monthly cashflow live
- Estimated rent
- $1,410 medium interval (Pro) →
- Mortgage (P&I)
- −$1,206
- Tax from tax record
- −$126 /mo · $1,508/yr
- Insurance
- −$96
- HOA
- −$305
- Vacancy / Maint / Mgmt
- −$296
- Net cashflow
- $-619
Break-even live
Sensitivity live
| Price | -10% $-489 | -5% $-554 | +0% $-619 | +5% $-684 | +10% $-749 |
|---|---|---|---|---|---|
| Rent | -10% $-730 | -5% $-674 | +0% $-619 | +5% $-563 | +10% $-507 |
| Rate | -1.0pp $-503 | -0.5pp $-560 | base $-619 | +0.5pp $-678 | +1.0pp $-739 |
UW: 25.0% down · 7.5% · 30yr · 1.5% tax · 5.0% vac · 8.0% maint · 8.0% mgmt
Financing live
Cash to close
- Down payment
- $57,500
- Closing costs
- $6,900
- Reserves months
- —
- Total cash needed
- —
Loan-product check · same deal, 3 products live
Conventional
25% down · 7.5% · 30yr
- Down + closing
- —
- Monthly P&I
- —
- Monthly cashflow
- —
- DSCR
- —
- Eligible?
- —
Personal DTI + credit; lowest rate.
DSCR
20% down · 8.5% · 30yr
- Down + closing
- —
- Monthly P&I
- —
- Monthly cashflow
- —
- DSCR
- —
- Eligible?
- —
No personal income docs; deal must DSCR.
Hard money
10% down · 12.0% · 12mo
- Down + closing
- —
- Monthly P&I
- —
- Monthly cashflow
- —
- DSCR
- —
- Eligible?
- —
Short-term bridge; refi at stabilization.
Rent comps 1 comps
| Address | Beds | Baths | Sqft | Rent | $/sqft | DOM | Units | Dist |
|---|---|---|---|---|---|---|---|---|
| 100 Parkview Dr Wright City, MO | 1.0–3.0 | 1.0–2.0 | 951 | $1,410 | $1.48 | 0d | 3 | 0.51mi |
HOA detail condo
- Monthly dues
- $305 · $3,660/yr
- Assessments
- None detected in remarks — confirm with the listing agent.
Listing history 3 events
-
2026-06-15status $230,000 Pending 1 DOM
-
2026-06-13remarks 699-char remark
-
2026-06-13$230,000 Active 1 DOM
ⓘ Source: listings_history table (triggers on properties + properties_extension) + one-shot
backfill from property_details.listing_events for pre-trigger history.
Tax reassessment forecast MO · Resets to sale price
- Current annual tax
- $1,508 · $126/mo
- Projected year-2 tax
- $2,231 · $186/mo
- Expected delta
- +$723/yr (+$60/mo · 47.9%)
ⓘ Screening estimate from a state-policy table — verify with the county assessor before closing.
Climate risk First Street
- Flood 1/10 Low FEMA zone X (unshaded) · 0% chance over 30 yrs
- Wildfire 1/10 Low
- Heat 4/10 Moderate 7 d/yr ≥106°F today · 19 d/yr by 30 yrs out
- Wind 2/10 Low 100% chance of damaging wind over 30 yrs
- Air quality 1/10 Low 0 unhealthy d/yr today · 0 by 30 yrs out
Nearby sold comps map
Loading sold comps map…
Walkable amenities ~0.75 mi
Loading nearby amenities…
Taxation est. · year 1
- Rental income
- $16,920
- − Mortgage interest
- −$12,884
- − Property taxes
- −$1,508
- − Insurance
- −$1,150
- − Repairs & maintenance
- −$1,354
- − Management
- −$1,354
- − HOA
- −$3,660
- − Depreciation
- −$6,691
- Taxable loss
- −$11,680
- Est. tax savings @ 24.0%
- +$2,803
- After-tax cash flow
- $-4,622/yr
For passive investors: Depreciation is non-cash, so a rental often shows a tax loss while cash-flowing — sheltering income. Rental losses are passive: they offset passive income freely, and up to $25,000/yr can offset ordinary (W-2) income if you actively participate and your MAGI is under $100k (phasing out to $0 by $150k); unused losses carry forward. On sale, claimed depreciation is recaptured at up to 25%, and gains may owe capital-gains tax (a 1031 exchange can defer both). Figures are a year-1 estimate at your 24.0% rate — not tax advice; consult a CPA.
Schools (NCES district)
- District
- Wright City R-II Of Warren County
- NCES district ID
- 2932310
- Math proficiency
- 32% ▲ 5.00%
- Reading proficiency
- 41% ▼ -1.00%
- Median HH income
- $56,573
- Composite
- 32.19/100
- National rank
- #5781
- State rank
- #179 of 324 in MO
Livability — Wright City
- Score
- 68/100
- State rank
- #194
- US rank
- #10018
Category grades
Schools grade is shown separately in the Schools card above.
Census & demographics
- Census place
- Wright City, MO
- Population (ZIP)
- 10,856
Population outlook (Warren County) Hauer SSP2
- Today (2025)
- 35,105 people
- By 2030
- 35,605 · +1.4%
- By 2040
- 36,047 · +2.7%
- By 2050
- 35,479 · +1.1%
- By 2075
- 33,325 · -5.1%
- By 2100
- 28,282 · -19.4%
Race, ethnicity, and origin ACS 2023
- Neighborhood character
- Predominantly White (84%)
- Race & ethnicity
- White 84% Two or more races 8% Hispanic / Latino 7% Black 5% Native American 1%
- Hispanic origin (detail)
- Mexican 4%
- Common ancestry
- Lithuanian 5% Iranian 2% Romanian 1%
- Foreign-born
- 3% · Canada
- Languages at home
- 94% English-only · Spanish 5% German/W. Germanic 1%
Political lean MEDSL · Warren
- 2024 margin
- Solid R (+49.5) · D 24.7% · R 74.2% · Other 1.0%
- 2008→2024 swing
- -36.9pp toward R · 2008: -12.6pp · 2024: -49.5pp
- All cycles
- 2024: R+49.5 2020: R+46.0 2016: R+45.6 2012: R+26.8 2008: R+12.6
Not yet ingested
- Civics
- —
Market trends
- HPI YoY
- ▼ -40.69%
- Current HPI
- 188.5856
- Rent YoY
- —
- Metro
- —
- State GDP YoY
- ▲ 1.84%
- F500 in state
- 20
Industry mix (Fortune 500 HQ in MO)
| Industry | F500 HQs | Revenue |
|---|---|---|
| Healthcare | 1 | $163B |
|
||
| Insurance | 1 | $21B |
|
||
| Industrial Technology | 1 | $17B |
|
||
| Retail | 1 | $16B |
|
||
| Industrial Distribution | 1 | $10B |
|
||
| Utilities | 1 | $9B |
|
||
Price history
+0.0% since first listed3 events — show timeline
- 2026-06-12 Listed $230,000 MARIS as Distributed by MLS Grid
- 2026-06-11 Coming Soon $230,000 MARIS as Distributed by MLS Grid
- 2026-06-11 Listed $230,000 MARIS as Distributed by MLS Grid
Property tax history
+1.4%/yrLatest (2025): $1,508 · +13.9% YoY. Source: county tax records.
Cash-flow waterfall
monthlySold comps — $/sqft
last 12 mo · ≤1 miLoading sold comps…