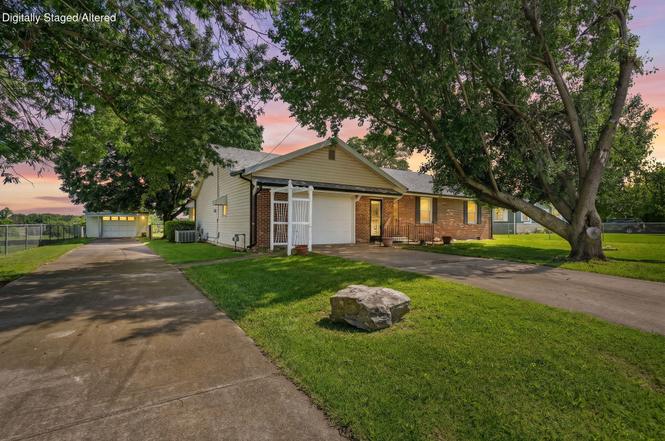
800 E Prairie Ln · Ash Grove, MO
Flood risk 1/10 · Minimal
- FEMA flood zone
- X (unshaded)
- Chance of flooding over 30 yrs
- 0.0%
- Est. flood insurance / yr
- $507 – $1,088
Fire risk 4/10 · Minor
- Est. fire insurance / yr
- $1,054 – $1,958
Heat risk 5/10 · Moderate
- Hot days now (above 105°F)
- 7 days/yr
- Hot days in 30 yrs
- 20 days/yr
Wind risk 2/10 · Minimal
- Chance of severe wind over 30 yrs
- 1.0%
Air-quality risk 2/10 · Minimal
- Unhealthy air days now
- 1 days/yr
- Unhealthy air days in 30 yrs
- 1 days/yr
Risk factors via First Street. Map © Google.
Why this score? — see what drove the D grade
The composite is a weighted blend of 9 inputs, each scored 0–100. Each bar is that input's sub-score; the figure is the points it added to the 100-point composite (weight × sub-score).
- Cash flow +19.1/30.0
- DSCR +6.0/10.0
- 1% rule +4.1/10.0
- Schools +3.5/10.0
- Livability +3.1/5.0
- Rent growth +2.5/5.0
- Condition / age +2.5/5.0
- ARV discount +1.1/15.0
- Appreciation +0.0/10.0
$230,000
🖨 Deal sheet (PDF) 📄 Offer letter ✓ Due diligence
Listing remarks
Charming ranch-style home nestled in the heart of Ash Grove! This inviting 2-bedroom, 2-bath residence offers comfortable single-level living with a functional floor plan and plenty of natural light throughout. The spacious living area flows seamlessly into the kitchen and dining space, creating a warm and welcoming atmosphere. Both bedrooms provide comfortable accommodations, while the large yard offers ample room for gardening, outdoor entertaining, or simply enjoying the peaceful surroundings. Bonus features include an updated kitchen, gorgeous brick fireplace and an extra outbuilding/garage/shop. Conveniently located near local schools, parks, and community amenities, this home is an ex
Key facts
- Outbuilding
- Brick fireplace
- Large yard
Tags
Property features AI
Exterior
- Parking: 2-car garage; Driveway (paved); Garage faces front
- Utilities: Public water; Public sewer
- Home design: Single-family residence; One level
- Construction: Vinyl siding; Brick/mortar foundation; Composition roof; Built features date not provided
- Exterior features: Front and rear porches, enclosed front porch; Chain link fencing; Outbuilding
Interior
- Kitchen: Electric cooktop; Built-in electric oven; Dishwasher
- Bedrooms: Bedrooms not specifically listed
- Flooring: Carpet; Tile
- Bathrooms: 2 full bathrooms
- Heating & cooling: Central heating; Natural gas heating; Pellet stove; Central air conditioning; Ceiling fan(s)
- Interior features: Insulated, double-pane windows; Family room fireplace; Rain gutters
- Laundry & utility: Laundry located in garage
Neighborhood map
What this means for you Summary
Snapshot
- This is a 2-bed/2.0-bath single-family listed at $230k.
Deal economics
- At list price, monthly cash flow is $245 ($3k/yr) — positive.
- The deal already cash-flows at list — no discount required.
- To meet the 1% rule (rent ≥ 1% of price), the offer needs to be $210k (8.6% below list).
- Recommended offer: $210k (8.6% below list) — sets the bar for 1% rule.
- Cap rate 7.6% vs local median 5.4% in Ash Grove — top-decile yield for the area; either an underpriced asset or a hidden risk that comps aren't pricing in. Stress-test before assuming the spread holds.
Location & tenants
- Location reads 61/100 on livability (#435 in MO) — a middle-class / working-renter tenant base. Strengths: cost of living A+, housing A+; Watch: crime C-, amenities F, commute F.
- Ash Grove R-IV (rural): math 33% / reading 50% proficiency, ranked #121 of 324 in MO (top 37%) — families likely to look elsewhere, expect single-tenant / working-renter base with shorter leases.
- Zoned schools: Ash Grove Elem. (math 34% / reading 44%, grade F, #537 of 1,115 statewide, top 53%, 259 students, 47% FRL); Bois D'Arc Elem. (math 42% / reading 52%, grade D+, #95 of 391 statewide, top 25%, 144 students, 47% FRL); Ash Grove High (math 22% / reading 52%, grade F, #291 of 521 statewide, top 60%, 329 students, 37% FRL).
- Market conditions: 61 active listings in the ZIP; 1,302 units permitted in Greene County in 2024 (250 in 5+ unit buildings).
Forward outlook
- Local home prices are declining (-3.0%/yr); year-one equity from $2k of loan paydown is wiped out by about $7k of value loss. Plan a longer hold.
- Greene County population projected at +25% by 2050 — long-run rental-demand tailwind backs the buy-and-hold thesis.
Negotiation context
- Only 4 days on market — expect competitive offers; lowballing is unlikely to land.
Risks & watch-outs
- Climate carrying-cost: extreme-heat days projected 7→20/yr by 2055 (HVAC capex compounding) — expect insurance premiums to compound above CPI over the hold.
Questions for the listing agent
- Is there a deadline driving the sale (1031 exchange, divorce, estate, relocation)? That informs how much negotiation room exists.
- The area grade is low — what's the realistic commute time and amenity access for the typical tenant pool here? Any planned neighborhood developments (good or bad) we should know about?
- What's the average days-on-market for RENTAL listings here right now (not sales)? A rising rental-DOM trend means longer vacancies and softer asking-rent achievability than the comps imply.
- What's the recent tenant-quality profile in this submarket — average credit score on applications, eviction rate, late-payment / NSF rate, and stable-employment percentage? A property-management company in the area should have these aggregated.
- How much new for-sale + rental construction is in the pipeline within 1–3 miles? Heavy new supply typically softens prices + rents 12–24 months out; constrained supply supports both.
Investment metrics
- 1% rule
- 0.91% ✗
- Cap rate
- 7.57%
- Cash-on-cash
- 4.56%
- DSCR
- 1.20
- GRM
- 9.1
CMA / ARV
- ARV (on-the-fly)
- $201,348
- Comps found
- 7
Show comp detail 7 sales within ~0.75 mi
| Address | Dist | Beds/Ba | Sqft | Sold | Price | $/sf | Match |
|---|---|---|---|---|---|---|---|
| 606 E Prairie Ln | 0.20mi | 3/2.0 (+1) | 1,456 (+2%) | 8mo | $186,000 | $128 | 76 |
| 806 E Grant St | 0.08mi | 3/2.0 (+1) | 1,551 (+9%) | 3mo | $235,000 | $152 | 74 |
| 804 E Prairie Ln | 0.04mi | 2/1.5 | 1,239 (-13%) | 14mo | $175,000 | $141 | 63 |
| 902 E Auburn Dr | 0.34mi | 3/2.0 (+1) | 1,515 (+6%) | 14mo | $249,900 | $165 | 57 |
| 101 W Murray St | 0.75mi | 3/1.0 (+1) | 1,380 (-3%) | 12mo | $145,000 | $105 | 40 |
| 125 S Calhoun Ave | 0.72mi | 3/2.0 (+1) | 1,380 (-3%) | 24mo | $249,000 | $180 | 36 |
| 204 S Calhoun Ave | 0.71mi | 3/1.5 (+1) | 1,637 (+15%) | 19mo | $217,700 | $133 | 20 |
Match score weights: distance 35% · size 25% · config 20% · recency 20%. Top-matched comps best support the ARV.
Projected returns pro-forma
-3.0% appreciation · 3.0% rent growth · sell at horizon
- IRR
- -9.2%
- Equity multiple
- 0.66×
- Total profit
- $-21,767
- Equity at exit
- $34,294
- IRR
- 0.2%
- Equity multiple
- 1.01×
- Total profit
- $803
- Equity at exit
- $19,886
Cash invested: $64,400 (down + closing). Projections, not guarantees.
Landlord ↔ Tenant lean methodology
- Overall (STATE)
- 81 Strongly Landlord-Friendly
- State Missouri
- 81 Strongly Landlord-Friendly · R+10
- County
- — inherits STATE
- City
- — inherits STATE
ZIP-level market 65604
- Home prices YoY
- -13.1%
- Active inventory
- 61
- Price-to-rent
- 9.1×
Monthly cashflow live
- Estimated rent
- $2,103 medium interval (Pro) →
- Mortgage (P&I)
- −$1,206
- Tax from tax record
- −$115 /mo · $1,378/yr
- Insurance
- −$96
- HOA
- −$0
- Vacancy / Maint / Mgmt
- −$442
- Net cashflow
- $245
Break-even live
Sensitivity live
| Price | -10% $375 | -5% $310 | +0% $245 | +5% $179 | +10% $114 |
|---|---|---|---|---|---|
| Rent | -10% $78 | -5% $162 | +0% $245 | +5% $328 | +10% $411 |
| Rate | -1.0pp $360 | -0.5pp $303 | base $245 | +0.5pp $185 | +1.0pp $124 |
UW: 25.0% down · 7.5% · 30yr · 1.5% tax · 5.0% vac · 8.0% maint · 8.0% mgmt
Financing live
Cash to close
- Down payment
- $57,500
- Closing costs
- $6,900
- Reserves months
- —
- Total cash needed
- —
Loan-product check · same deal, 3 products live
Conventional
25% down · 7.5% · 30yr
- Down + closing
- —
- Monthly P&I
- —
- Monthly cashflow
- —
- DSCR
- —
- Eligible?
- —
Personal DTI + credit; lowest rate.
DSCR
20% down · 8.5% · 30yr
- Down + closing
- —
- Monthly P&I
- —
- Monthly cashflow
- —
- DSCR
- —
- Eligible?
- —
No personal income docs; deal must DSCR.
Hard money
10% down · 12.0% · 12mo
- Down + closing
- —
- Monthly P&I
- —
- Monthly cashflow
- —
- DSCR
- —
- Eligible?
- —
Short-term bridge; refi at stabilization.
Listing history 3 events
-
2026-06-22days on market $230,000 Active 4 DOM
-
2026-06-17remarks 699-char remark
-
2026-06-17$230,000 Active 1 DOM
ⓘ Source: listings_history table (triggers on properties + properties_extension) + one-shot
backfill from property_details.listing_events for pre-trigger history.
Tax reassessment forecast MO · Resets to sale price
- Current annual tax
- $1,378 · $115/mo
- Projected year-2 tax
- $2,231 · $186/mo
- Expected delta
- +$853/yr (+$71/mo · 61.9%)
ⓘ Screening estimate from a state-policy table — verify with the county assessor before closing.
Climate risk First Street
- Flood 1/10 Low FEMA zone X (unshaded) · 0% chance over 30 yrs
- Wildfire 4/10 Moderate
- Heat 5/10 Major 7 d/yr ≥105°F today · 20 d/yr by 30 yrs out
- Wind 2/10 Low 100% chance of damaging wind over 30 yrs
- Air quality 2/10 Low 1 unhealthy d/yr today · 1 by 30 yrs out
Nearby sold comps map
Loading sold comps map…
Walkable amenities ~0.75 mi
Loading nearby amenities…
Taxation est. · year 1
- Rental income
- $25,237
- − Mortgage interest
- −$12,884
- − Property taxes
- −$1,378
- − Insurance
- −$1,150
- − Repairs & maintenance
- −$2,019
- − Management
- −$2,019
- − Depreciation
- −$6,691
- Taxable loss
- −$904
- Est. tax savings @ 24.0%
- +$217
- After-tax cash flow
- $3,152/yr
For passive investors: Depreciation is non-cash, so a rental often shows a tax loss while cash-flowing — sheltering income. Rental losses are passive: they offset passive income freely, and up to $25,000/yr can offset ordinary (W-2) income if you actively participate and your MAGI is under $100k (phasing out to $0 by $150k); unused losses carry forward. On sale, claimed depreciation is recaptured at up to 25%, and gains may owe capital-gains tax (a 1031 exchange can defer both). Figures are a year-1 estimate at your 24.0% rate — not tax advice; consult a CPA.
Schools (NCES district)
- District
- Ash Grove R-IV
- NCES district ID
- 2903270
- Math proficiency
- 33% ▼ -7.00%
- Reading proficiency
- 50% ▲ 1.00%
- Median HH income
- $47,679
- Composite
- 35.45/100
- National rank
- #4929
- State rank
- #121 of 324 in MO
Livability — Ash Grove
- Score
- 61/100
- State rank
- #435
- US rank
- #17867
Category grades
Schools grade is shown separately in the Schools card above.
Census & demographics
- Census place
- Ash Grove, MO
- Population (ZIP)
- 3,909
Population outlook (Greene County) Hauer SSP2
- Today (2025)
- 319,054 people
- By 2030
- 335,135 · +5.0%
- By 2040
- 366,186 · +14.8%
- By 2050
- 397,431 · +24.6%
- By 2075
- 477,035 · +49.5%
- By 2100
- 520,828 · +63.2%
Race, ethnicity, and origin ACS 2023
- Neighborhood character
- Predominantly White (91%)
- Race & ethnicity
- White 91% Two or more races 7% Hispanic / Latino 5%
- Hispanic origin (detail)
- Mexican 3% Puerto Rican 2%
- Common ancestry
- Italian 2% Lithuanian 2% Romanian 2%
- Foreign-born
- 0%
- Languages at home
- 98% English-only · Spanish 2%
Political lean MEDSL · Greene
- 2024 margin
- Strong R (+20.8) · D 38.9% · R 59.7% · Other 1.4%
- 2008→2024 swing
- -5.0pp toward R · 2008: -15.8pp · 2024: -20.8pp
- All cycles
- 2024: R+20.8 2020: R+20.1 2016: R+27.4 2012: R+24.4 2008: R+15.8
Not yet ingested
- Civics
- —
Market trends
- HPI YoY
- ▼ -34.86%
- Current HPI
- 231.5643
- Rent YoY
- —
- Metro
- —
- State GDP YoY
- ▲ 1.84%
- F500 in state
- 20
Industry mix (Fortune 500 HQ in MO)
| Industry | F500 HQs | Revenue |
|---|---|---|
| Healthcare | 1 | $163B |
|
||
| Insurance | 1 | $21B |
|
||
| Industrial Technology | 1 | $17B |
|
||
| Retail | 1 | $16B |
|
||
| Industrial Distribution | 1 | $10B |
|
||
| Utilities | 1 | $9B |
|
||
Price history
2 events — show timeline
- 2026-06-17 Listed $230,000 SOMO
- 2004-05-12 Sold (Public Records) — Public Records
Property tax history
+3.9%/yrLatest (2025): $1,378 · -0.0% YoY. Source: county tax records.
Cash-flow waterfall
monthlySold comps — $/sqft
last 12 mo · ≤1 miLoading sold comps…