 Multi-family
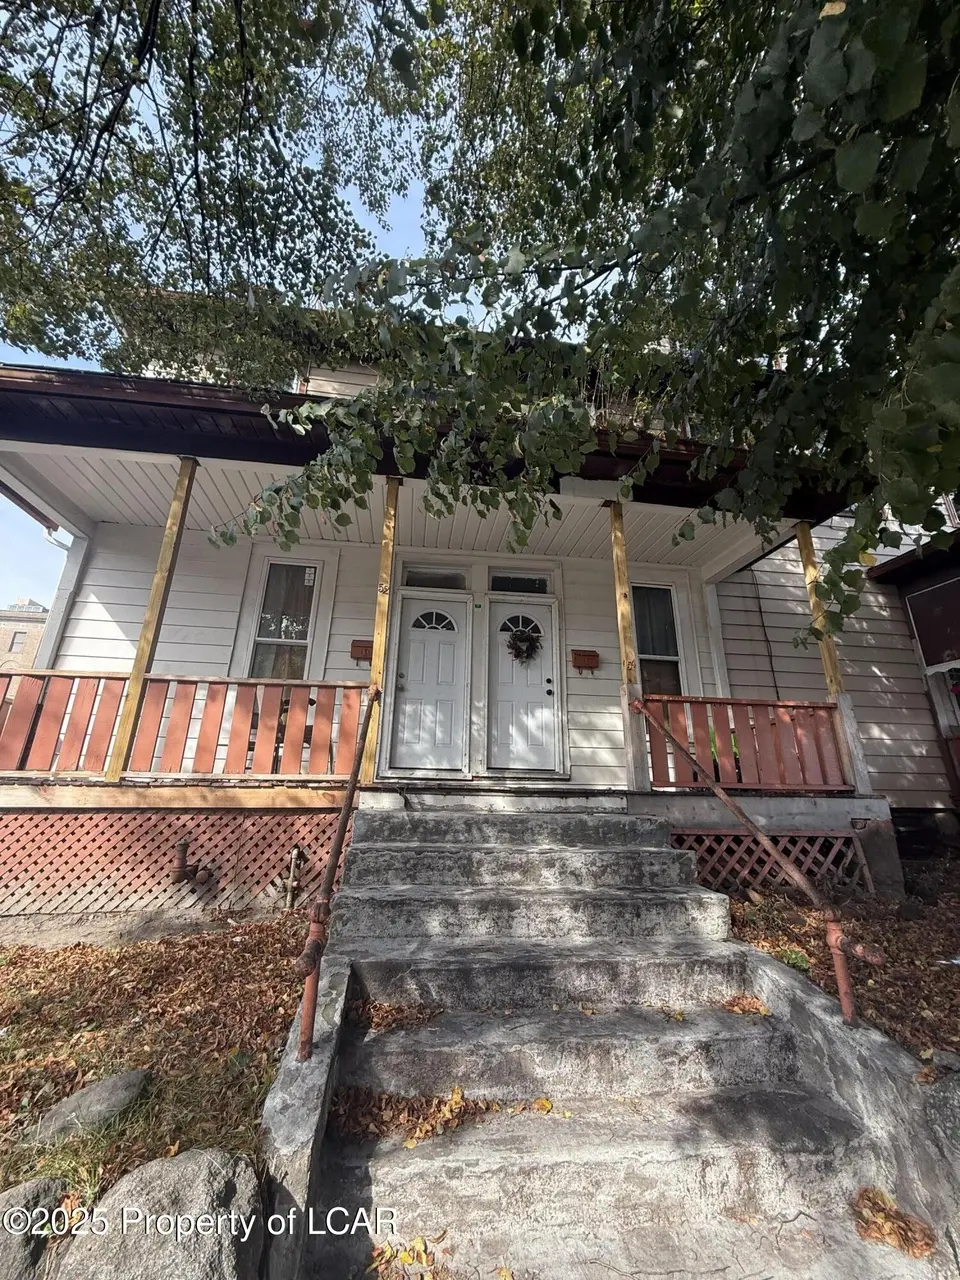
52 54 Laurel St · Hazleton, PA
Flood risk 1/10 · Minimal
- FEMA flood zone
- X (unshaded)
- Chance of flooding over 30 yrs
- 0.0%
- Est. flood insurance / yr
- $507 – $1,088
Fire risk 3/10 · Minor
- Est. fire insurance / yr
- $511 – $949
Heat risk 3/10 · Minor
- Hot days now (above 91°F)
- 7 days/yr
- Hot days in 30 yrs
- 16 days/yr
Wind risk 3/10 · Minor
- Chance of severe wind over 30 yrs
- 6.0%
Air-quality risk 2/10 · Minimal
- Unhealthy air days now
- 1 days/yr
- Unhealthy air days in 30 yrs
- 2 days/yr
Risk factors via First Street. Map © Google.
Why this score? — see what drove the C- grade
The composite is a weighted blend of 9 inputs, each scored 0–100. Each bar is that input's sub-score; the figure is the points it added to the 100-point composite (weight × sub-score).
- Cash flow +19.0/30.0
- ARV discount +11.7/15.0
- DSCR +6.0/10.0
- 1% rule +5.0/10.0
- Livability +3.4/5.0
- Rent growth +2.5/5.0
- Condition / age +2.5/5.0
- Schools +2.0/10.0
- Appreciation +0.0/10.0
$289,999
🖨 Deal sheet 📄 Offer letter ✓ Due diligence
Multi-family units
County records classify this as Multi-Family (2-4 Unit). Listing-text estimate: 1 unit. estimate disagrees with records
Listing remarks MLS
Great Rental Income Opportunity! Spacious multi-unit home -- live in one side and rent the other. Each unit offers 4 bedrooms, 1.5 baths, and a bright living/dining room combo. Enjoy a fenced-in yard perfect for privacy and outdoor fun. Excellent investment or owner-occupant option. Schedule your showing today!
Key facts
- Multi-unit home
- Fenced-in yard
- 2,400 sq ft lot
Tags
Neighborhood map
What this means for you Summary
Snapshot
- This is a 8-bed/2.0-bath multifamily listed at $290k.
Deal economics
- At list price, monthly cash flow is $304 ($4k/yr) — positive.
- The deal already cash-flows at list — no discount required.
- Meets the 1% rule at list price ($3k rent vs $290k).
- Recommended offer: $255k (12.0% below list) — sets the bar for market timing.
- Cap rate 7.6% vs local median 4.5% in Hazleton — top-decile yield for the area; either an underpriced asset or a hidden risk that comps aren't pricing in. Stress-test before assuming the spread holds.
Location & tenants
- Location reads 67/100 on livability (#930 in PA) — a middle-class / working-renter tenant base. Strengths: cost of living A+, housing A+, crime A-; Watch: schools F, amenities F, commute F.
- Hazleton Area SD (suburban): math 18% / reading 30% proficiency, ranked #476 of 539 in PA (top 88%) — low school quality limits family demand, transient renter base, plan for 1-2y turnover.
- Market conditions: 118 active listings in the ZIP; 349 units permitted in Luzerne County in 2024 (16 in 5+ unit buildings).
Forward outlook
- Local home prices are declining (-3.0%/yr); year-one equity from $2k of loan paydown is wiped out by about $9k of value loss. Plan a longer hold.
- Luzerne County population projected at +4% by 2050 — modest demand growth; plan on rents tracking national, not racing it.
Negotiation context
- It's been on market 229 days — a 12% lower offer ($255k) is reasonable based on typical stale-listing flexibility.
- Current owner paid $20k; list at $290k implies a 1350% gain — meaningful room to come down on a strong offer.
Risks & watch-outs
- Watch-outs: built in 1920 — expect roof / HVAC / electrical / plumbing capex.
Questions for the listing agent
- It's been on market 229 days. Have you received any prior offers? Is the seller open to a 12% concession, seller financing, or rate buy-down credit?
- Built in 1920 — when were the roof, HVAC, electrical panel, plumbing, and water heater last replaced?
- Why hasn't it sold? Are there any deal-killer items the seller is aware of (foundation, flood, title, zoning, code violations)?
- Is there a deadline driving the sale (1031 exchange, divorce, estate, relocation)? That informs how much negotiation room exists.
- Schools are F-rated, which usually means shorter tenancies and higher turnover. Who's the typical renter profile here, and what's been the actual vacancy rate?
- What's the average days-on-market for RENTAL listings here right now (not sales)? A rising rental-DOM trend means longer vacancies and softer asking-rent achievability than the comps imply.
- What's the recent tenant-quality profile in this submarket — average credit score on applications, eviction rate, late-payment / NSF rate, and stable-employment percentage? A property-management company in the area should have these aggregated.
- How much new apartment / multifamily construction is in the pipeline within 1–3 miles? Heavy new supply (>2% of stock underway) typically softens rents 12–24 months out; light construction supports rent growth.
Investment metrics
- 1% rule
- 1.00% ✓
- Cap rate
- 7.55%
- Cash-on-cash
- 4.50%
- DSCR
- 1.20
- GRM
- 8.3
CMA / ARV
- ARV (median comp)
- $319,477
- List price
- $289,999
- Delta
- -9.23%
- Verdict
- FAIR
- Comps
- 20 within 1.0 mi
Show comp detail 6 sales within ~0.75 mi
| Address | Dist | Beds/Ba | Sqft | Sold | Price | $/sf | Match |
|---|---|---|---|---|---|---|---|
| 718 720 Diamond Ave | 0.47mi | 8/4.0 | 3,600 (+4%) | 10mo | $369,999 | $103 | 55 |
| 321 323 Diamond Ave | 0.29mi | 8/4.0 | 3,750 (+8%) | 11mo | $360,000 | $96 | 55 |
| 441 443 Spruce St | 0.35mi | 8/4.0 | 3,000 (-13%) | 14mo | $2,700 | $1 | 41 |
| 209 211 Green St | 0.28mi | 9/2.0 (+1) | 2,987 (-14%) | 24mo | $273,000 | $91 | 39 |
| 830 7th St | 0.73mi | 8/4.0 | 3,904 (+13%) | 10mo | $407,000 | $104 | 29 |
| 688 690 Vine St | 0.64mi | 8/4.0 | 2,970 (-14%) | 15mo | $285,000 | $96 | 26 |
Match score weights: distance 35% · size 25% · config 20% · recency 20%. Top-matched comps best support the ARV.
Projected returns pro-forma
-3.0% appreciation · 3.0% rent growth · sell at horizon
- IRR
- -9.3%
- Equity multiple
- 0.66×
- Total profit
- $-27,574
- Equity at exit
- $43,240
- IRR
- 0.2%
- Equity multiple
- 1.01×
- Total profit
- $1,084
- Equity at exit
- $25,074
Cash invested: $81,200 (down + closing). Projections, not guarantees.
Landlord ↔ Tenant lean methodology
- Overall (STATE)
- 62 Landlord-Friendly
- State Pennsylvania
- 62 Landlord-Friendly · EVEN
- County
- — inherits STATE
- City
- — inherits STATE
ZIP-level market 18201
- Home prices YoY
- -14.9%
- Active inventory
- 118
- Price-to-rent
- 16.7×
Monthly cashflow live
- Estimated rent
- $2,900 medium interval (Pro) →
- Mortgage (P&I)
- −$1,521
- Tax from tax record
- −$345 /mo · $4,140/yr
- Insurance
- −$121
- HOA
- −$0
- Vacancy / Maint / Mgmt
- −$609
- Net cashflow
- $304
Break-even live
2-unit breakdown (identical units grouped — click to expand)
| Units | Beds | Baths | Est. rent |
|---|---|---|---|
| 2× units | 4 | 1.5 | $2,900 |
| #1 | 4 | 1.5 | $1,450 |
| #2 | 4 | 1.5 | $1,450 |
| Total (2 units) | $2,900 | ||
UW: 25.0% down · 7.5% · 30yr · 1.5% tax · 5.0% vac · 8.0% maint · 8.0% mgmt
Financing live
Cash to close
- Down payment
- $72,500
- Closing costs
- $8,700
- Reserves months
- —
- Total cash needed
- —
Loan-product check · same deal, 3 products live
Conventional
25% down · 7.5% · 30yr
- Down + closing
- —
- Monthly P&I
- —
- Monthly cashflow
- —
- DSCR
- —
- Eligible?
- —
Personal DTI + credit; lowest rate.
DSCR
20% down · 8.5% · 30yr
- Down + closing
- —
- Monthly P&I
- —
- Monthly cashflow
- —
- DSCR
- —
- Eligible?
- —
No personal income docs; deal must DSCR.
Hard money
10% down · 12.0% · 12mo
- Down + closing
- —
- Monthly P&I
- —
- Monthly cashflow
- —
- DSCR
- —
- Eligible?
- —
Short-term bridge; refi at stabilization.
Listing history 17 events
-
2026-06-19days on market $289,999 Active 229 DOM
-
2026-06-18days on market $289,999 Active 228 DOM
-
2026-06-17days on market $289,999 Active 227 DOM
-
2026-06-16days on market $289,999 Active 226 DOM
-
2026-06-15days on market $289,999 Active 225 DOM
-
2026-06-14days on market $289,999 Active 223 DOM
-
2026-06-12days on market $289,999 Active 222 DOM
-
2026-06-09days on market $289,999 Active 219 DOM
-
2026-06-08days on market $289,999 Active 218 DOM
-
2026-06-07days on market $289,999 Active 217 DOM
-
2026-06-02days on market $289,999 Active 212 DOM
-
2026-06-01days on market $289,999 Active 211 DOM
-
2026-05-31days on market $289,999 Active 210 DOM
-
2026-05-30days on market $289,999 Active 209 DOM
-
2026-02-16price $289,999 312-char remark
Show marketing remark (312 chars)
Great Rental Income Opportunity! Spacious multi-unit home -- live in one side and rent the other. Each unit offers 4 bedrooms, 1.5 baths, and a bright living/dining room combo. Enjoy a fenced-in yard perfect for privacy and outdoor fun. Excellent investment or owner-occupant option. Schedule your showing today!
-
2025-11-03$299,900 Active 312-char remark
Show marketing remark (312 chars)
Great Rental Income Opportunity! Spacious multi-unit home -- live in one side and rent the other. Each unit offers 4 bedrooms, 1.5 baths, and a bright living/dining room combo. Enjoy a fenced-in yard perfect for privacy and outdoor fun. Excellent investment or owner-occupant option. Schedule your showing today!
-
2019-05-15soldstatus $20,000
ⓘ Source: listings_history table (triggers on properties + properties_extension) + one-shot
backfill from property_details.listing_events for pre-trigger history.
Tax reassessment forecast PA · Partial reset (capped growth)
- Current annual tax
- $4,140 · $345/mo
- Projected year-2 tax
- $4,361 · $363/mo
- Expected delta
- +$221/yr (+$18/mo · 5.3%)
ⓘ Screening estimate from a state-policy table — verify with the county assessor before closing.
Climate risk First Street
- Flood 1/10 Low FEMA zone X (unshaded) · 0% chance over 30 yrs
- Wildfire 3/10 Moderate
- Heat 3/10 Moderate 7 d/yr ≥91°F today · 16 d/yr by 30 yrs out
- Wind 3/10 Moderate 6% chance of damaging wind over 30 yrs
- Air quality 2/10 Low 1 unhealthy d/yr today · 2 by 30 yrs out
Nearby sold comps map
Loading sold comps map…
Walkable amenities ~0.75 mi
Loading nearby amenities…
Taxation est. · year 1
- Rental income
- $34,800
- − Mortgage interest
- −$16,244
- − Property taxes
- −$4,140
- − Insurance
- −$1,450
- − Repairs & maintenance
- −$2,784
- − Management
- −$2,784
- − Depreciation
- −$8,436
- Taxable loss
- −$1,039
- Est. tax savings @ 24.0%
- +$249
- After-tax cash flow
- $3,902/yr
For passive investors: Depreciation is non-cash, so a rental often shows a tax loss while cash-flowing — sheltering income. Rental losses are passive: they offset passive income freely, and up to $25,000/yr can offset ordinary (W-2) income if you actively participate and your MAGI is under $100k (phasing out to $0 by $150k); unused losses carry forward. On sale, claimed depreciation is recaptured at up to 25%, and gains may owe capital-gains tax (a 1031 exchange can defer both). Figures are a year-1 estimate at your 24.0% rate — not tax advice; consult a CPA.
Schools (NCES district)
- District
- Hazleton Area SD
- NCES district ID
- 4211700
- Math proficiency
- 18% ▼ -3.00%
- Reading proficiency
- 30% ▼ -15.00%
- Median HH income
- $42,247
- Composite
- 20.44/100
- National rank
- #8582
- State rank
- #476 of 539 in PA
Livability — Hazleton
- Score
- 67/100
- State rank
- #930
- US rank
- #10115
Category grades
Schools grade is shown separately in the Schools card above.
Census & demographics
- Census place
- Hazleton, PA
- City population
- 13,755
- Population (ZIP)
- 31,428
Population outlook (Luzerne County) Hauer SSP2
- Today (2025)
- 319,505 people
- By 2030
- 319,943 · +0.1%
- By 2040
- 322,643 · +1.0%
- By 2050
- 330,817 · +3.5%
- By 2075
- 379,145 · +18.7%
- By 2100
- 431,908 · +35.2%
Race, ethnicity, and origin ACS 2023
- Neighborhood character
- Majority Hispanic (60%)
- Race & ethnicity
- Hispanic / Latino 60% White 36% Two or more races 18% Black 2%
- Hispanic origin (detail)
- Mexican 6% Puerto Rican 6% Dominican 41%
- Common ancestry
- Romanian 5% Iranian 1% Russian 1%
- Foreign-born
- 36% · Canada, Jamaica
- Languages at home
- 43% English-only · Spanish 54% Russian/Polish/Slavic 1% Other Indo-European 1%
Political lean MEDSL · Luzerne
- 2024 margin
- R (+19.2) · D 40.0% · R 59.2%
- 2008→2024 swing
- -27.6pp toward R · 2008: 8.4pp · 2024: -19.2pp
- All cycles
- 2024: R+19.2 2020: R+14.4 2016: R+19.6 2012: D+4.8 2008: D+8.4
Not yet ingested
- Civics
- —
Market trends
- HPI YoY
- ▼ -62.00%
- Current HPI
- 354.7443
- Rent YoY
- —
- Metro
- —
- State GDP YoY
- ▲ 1.68%
- F500 in state
- 34
Industry mix (Fortune 500 HQ in PA)
| Industry | F500 HQs | Revenue |
|---|---|---|
| Healthcare | 2 | $309B |
|
||
| Insurance | 2 | $27B |
|
||
| Telecommunications / Media | 1 | $124B |
|
||
| Industrial Distribution | 1 | $22B |
|
||
| Financial Services | 1 | $20B |
|
||
| Chemicals / Materials | 1 | $18B |
|
||
Price history
+1350.0% since first listed3 events — show timeline
- 2026-02-16 Price Changed $289,999 LCAR
- 2025-11-03 Listed $299,900 LCAR
- 2019-05-15 Sold (Public Records) $20,000 Public Records
Property tax history
+6.8%/yrLatest (2026): $4,140 · +10.3% YoY. Source: county tax records.
Cash-flow waterfall
monthlySold comps — $/sqft
last 12 mo · ≤1 miLoading sold comps…