2763 N Vasser Ter · Hernando, FL
Flood risk 1/10 · Minimal
- FEMA flood zone
- X (unshaded)
- Chance of flooding over 30 yrs
- 0.0%
- Est. flood insurance / yr
- $507 – $1,088
Fire risk 5/10 · Moderate
- Est. fire insurance / yr
- $947 – $1,759
Heat risk 9/10 · Severe
- Hot days now (above 108°F)
- 7 days/yr
- Hot days in 30 yrs
- 23 days/yr
Wind risk 9/10 · Severe
- Chance of severe wind over 30 yrs
- 99.0%
Air-quality risk 1/10 · Minimal
- Unhealthy air days now
- 0 days/yr
- Unhealthy air days in 30 yrs
- 0 days/yr
Risk factors via First Street. Map © Google.
Why this score? — see what drove the D- grade
The composite is a weighted blend of 9 inputs, each scored 0–100. Each bar is that input's sub-score; the figure is the points it added to the 100-point composite (weight × sub-score).
- Cash flow +12.0/30.0
- ARV discount +7.5/15.0
- Schools +4.1/10.0
- Livability +3.6/5.0
- DSCR +3.5/10.0
- Rent growth +2.5/5.0
- Condition / age +2.5/5.0
- 1% rule +2.3/10.0
- Appreciation +0.0/10.0
$199,760
🖨 Deal sheet 📄 Offer letter ✓ Due diligence
Listing remarks
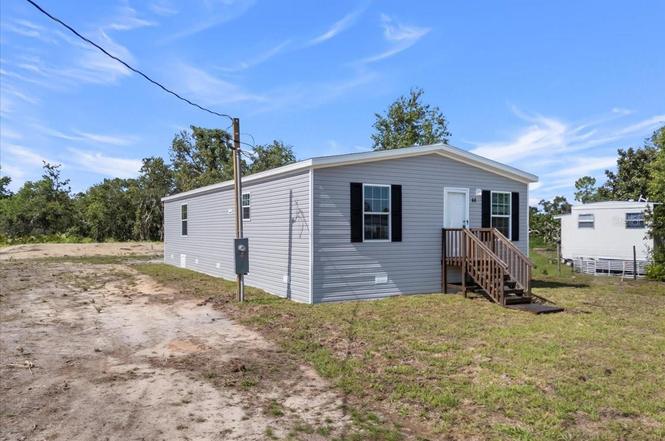
Experience the perfect blend of modern living and natural beauty with this BRAND-NEW manufactured home, situated on your own lot, you own! This beautifully designed 3-bedroom, 2-bathroom home offers a spacious, open floor plan ideal for modern living. From the moment you step inside, you'll appreciate the high-quality finishes and attention to detail with vinyl flooring throughout. The spacious living room seamlessly flows into the kitchen and dining area, perfect for entertaining guests. The master bedroom is a serene retreat, with a luxurious en-suite master bath with a dual sink vanity, shower, and a walk-in closet. The chef-inspired kitchen is equipped with brand-new stainless steel app
Key facts
- Open floor plan
- Vinyl flooring
- Spacious living room
Tags
Property features AI
Finance
- Other: Unfurnished; Living area approximately 1,280 square feet; Lot about 0.19 acres (approx. 50 x 182)
- HOA & community: Pets allowed; No association approval required
Exterior
- Utilities: Well water; Septic tank; Broadband/high-speed internet available; Cable available; Electricity available; Phone available
- Home design: Manufactured double wide home; Single-story; Faces west; Completed, new construction model (Champion Prime)
- Construction: Vinyl siding; Shingle roof; Block foundation; Crawlspace foundation; Built as new construction (projected completion listed)
- Exterior features: Private mailbox; Asphalt road access
Interior
- Kitchen: Dishwasher; Range; Refrigerator; Electric water heater
- Bedrooms: 3 bedrooms (total)
- Flooring: Vinyl
- Bathrooms: 2 full bathrooms
- Heating & cooling: Central heating; Electric heating; Heat pump; Central air conditioning
- Interior features: Eat-in kitchen; Kitchen/family room combo; Open floorplan; Thermostat; Walk-in closet(s); Blinds
- Laundry & utility: Indoor laundry room
Neighborhood map
What this means for you Summary
Snapshot
- This is a 2-bed/1.0-bath manufactured listed at $200k.
Deal economics
- At list price, monthly cash flow is $-48 ($-574/yr) — negative.
- To cash-flow at today's rent, offer at most $191k (4.2% below list).
- To meet the 1% rule (rent ≥ 1% of price), the offer needs to be $145k (27.5% below list).
- Recommended offer: $145k (27.5% below list) — sets the bar for 1% rule.
Location & tenants
- Location reads 71/100 on livability (#402 in FL) — a middle-class / working-renter tenant base. Strengths: cost of living A+, housing A+, health & safety A+; Watch: amenities F, commute F, employment D-.
- Citrus (rural): math 49% / reading 50% proficiency, ranked #44 of 73 in FL (top 60%) — families likely to look elsewhere, expect single-tenant / working-renter base with shorter leases.
- Zoned schools: Hernando Elementary School (math 47% / reading 51%, grade D, #1,134 of 2,144 statewide, top 54%, 813 students, 71% FRL); Citrus High School (math 34% / reading 51%, grade F, #264 of 667 statewide, top 41%, 1,503 students, 54% FRL).
- Market conditions: 444 active listings in the ZIP; 2,443 units permitted in Citrus County in 2024 (0 in 5+ unit buildings).
- This rent runs 30% of the median local income ($57k/yr) — at the standard rent-burdened threshold; future hikes will face affordability resistance.
Forward outlook
- Local home prices are declining (-3.0%/yr); year-one equity from $1k of loan paydown is wiped out by about $6k of value loss. Plan a longer hold.
- Citrus County population projected to shrink 10% by 2050 — rents likely to lag national; underwrite the cash flow, not the appreciation.
Negotiation context
- It's been on market 262 days — a 12% lower offer ($176k) is reasonable based on typical stale-listing flexibility.
- 2 sale attempts since 2y ago with the ask held roughly flat each time — persistent listings suggest the price (not the market) is what's stuck; bring a comps-based counter.
- Current owner paid $17k; list at $200k implies a 1075% gain — meaningful room to come down on a strong offer.
Risks & watch-outs
- Climate carrying-cost: severe wind risk, 99% chance of damaging wind over 30y; moderate wildfire risk; extreme-heat days projected 7→23/yr by 2055 (HVAC capex compounding) — expect insurance premiums to compound above CPI over the hold.
Questions for the listing agent
- What do current leases actually rent for vs. the listed asking? Can we see a recent rent roll and the last 12 months of T-12 income?
- It's been on market 262 days. Have you received any prior offers? Is the seller open to a 27% concession, seller financing, or rate buy-down credit?
- Why hasn't it sold? Are there any deal-killer items the seller is aware of (foundation, flood, title, zoning, code violations)?
- Is there a deadline driving the sale (1031 exchange, divorce, estate, relocation)? That informs how much negotiation room exists.
- The area grade is low — what's the realistic commute time and amenity access for the typical tenant pool here? Any planned neighborhood developments (good or bad) we should know about?
- What's the average days-on-market for RENTAL listings here right now (not sales)? A rising rental-DOM trend means longer vacancies and softer asking-rent achievability than the comps imply.
- What's the recent tenant-quality profile in this submarket — average credit score on applications, eviction rate, late-payment / NSF rate, and stable-employment percentage? A property-management company in the area should have these aggregated.
- How much new for-sale + rental construction is in the pipeline within 1–3 miles? Heavy new supply typically softens prices + rents 12–24 months out; constrained supply supports both.
Investment metrics
- 1% rule
- 0.73% ✗
- Cap rate
- 6.01%
- Cash-on-cash
- -1.03%
- DSCR
- 0.95
- GRM
- 11.5
CMA / ARV
- ARV (on-the-fly)
- $75,936
- Comps found
- 4
Show comp detail 4 sales within ~0.75 mi
| Address | Dist | Beds/Ba | Sqft | Sold | Price | $/sf | Match |
|---|---|---|---|---|---|---|---|
| 4815 E Princeton Ln | 0.32mi | 2/1.0 | 672 (0%) | 14mo | $65,000 | $97 | 74 |
| 2555 N Park Pt | 0.49mi | 2/1.0 | 672 (0%) | 20mo | $76,000 | $113 | 61 |
| 4680 E Parsons Point Rd | 0.21mi | 2/1.5 | 756 (+12%) | 13mo | $42,500 | $56 | 57 |
| 2820 N Lakefront Dr | 0.42mi | 3/1.0 (+1) | 750 (+12%) | 11mo | $95,000 | $127 | 46 |
Match score weights: distance 35% · size 25% · config 20% · recency 20%. Top-matched comps best support the ARV.
Projected returns pro-forma
-3.0% appreciation · 3.0% rent growth · sell at horizon
- IRR
- -18.1%
- Equity multiple
- 0.37×
- Total profit
- $-35,508
- Equity at exit
- $29,785
- IRR
- -10.4%
- Equity multiple
- 0.37×
- Total profit
- $-35,221
- Equity at exit
- $17,272
Cash invested: $55,933 (down + closing). Projections, not guarantees.
Landlord ↔ Tenant lean methodology
- Overall (STATE)
- 87 Strongly Landlord-Friendly
- State Florida
- 87 Strongly Landlord-Friendly · R+3
- County
- — inherits STATE
- City
- — inherits STATE
ZIP-level market 34442
- Home prices YoY
- -21.9%
- Active inventory
- 444
- Price-to-rent
- 11.5×
Monthly cashflow live
- Estimated rent
- $1,449 medium interval (Pro) →
- Mortgage (P&I)
- −$1,048
- Tax from tax record
- −$62 /mo · $739/yr
- Insurance
- −$83
- HOA
- −$0
- Vacancy / Maint / Mgmt
- −$304
- Net cashflow
- $-48
Break-even live
UW: 25.0% down · 7.5% · 30yr · 1.5% tax · 5.0% vac · 8.0% maint · 8.0% mgmt
Financing live
Cash to close
- Down payment
- $49,940
- Closing costs
- $5,993
- Reserves months
- —
- Total cash needed
- —
Loan-product check · same deal, 3 products live
Conventional
25% down · 7.5% · 30yr
- Down + closing
- —
- Monthly P&I
- —
- Monthly cashflow
- —
- DSCR
- —
- Eligible?
- —
Personal DTI + credit; lowest rate.
DSCR
20% down · 8.5% · 30yr
- Down + closing
- —
- Monthly P&I
- —
- Monthly cashflow
- —
- DSCR
- —
- Eligible?
- —
No personal income docs; deal must DSCR.
Hard money
10% down · 12.0% · 12mo
- Down + closing
- —
- Monthly P&I
- —
- Monthly cashflow
- —
- DSCR
- —
- Eligible?
- —
Short-term bridge; refi at stabilization.
Listing history 50 events
-
2026-06-19days on market $199,760 Active 262 DOM
-
2026-06-18price $199,760 Active 261 DOM
-
2026-06-18days on market $199,761 Active 261 DOM
-
2026-06-17price $199,761 Active 260 DOM
-
2026-06-17days on market $199,762 Active 260 DOM
-
2026-06-16days on market $199,762 Active 259 DOM
-
2026-06-15price $199,762 Active 258 DOM
-
2026-06-15pricedays on market $199,763 Active 258 DOM
-
2026-06-14days on market $199,863 Active 256 DOM
-
2026-06-13pricedays on market $199,863 Active 255 DOM
-
2026-06-09pricedays on market $199,866 Active 252 DOM
-
2026-06-09price $199,867 Active 251 DOM
-
2026-06-08pricedays on market $199,868 Active 251 DOM
-
2026-06-03pricedays on market $199,870 Active 246 DOM
-
2026-06-03price $199,871 Active 245 DOM
-
2026-06-02days on market $199,872 Active 245 DOM
-
2026-06-01pricedays on market $199,872 Active 244 DOM
-
2026-05-31days on market $199,873 Active 243 DOM
-
2026-05-30days on market $199,873 Active 242 DOM
-
2026-05-25price $199,877
-
2026-05-21price $199,878
-
2026-05-20price $199,879
-
2026-05-19price $199,880
-
2026-05-18price $199,881
-
2026-05-15price $199,882
-
2026-05-14price $199,883
-
2026-05-13price $199,884
-
2026-05-12price $199,885
-
2026-05-11price $199,886
-
2026-05-08price $199,887
-
2026-05-07price $199,888
-
2026-05-06price $199,889
-
2026-05-05price $199,890
-
2026-05-04price $199,891
-
2026-05-01price $199,892
-
2026-04-30price $199,893
-
2026-04-29price $199,894
-
2026-04-28price $199,895
-
2026-04-24price $199,896
-
2026-04-23price $199,897
-
2026-04-22price $199,898
-
2026-04-21price $199,899
-
2026-04-20price $199,900
-
2026-04-17price $199,949
-
2026-04-16price $200,049
-
2026-04-14price $200,149
-
2026-04-13price $200,150
-
2026-04-10price $200,151
-
2026-04-09price $200,152
-
2026-04-08price $200,153
ⓘ Source: listings_history table (triggers on properties + properties_extension) + one-shot
backfill from property_details.listing_events for pre-trigger history.
Tax reassessment forecast FL · Resets to sale price
- Current annual tax
- $739 · $62/mo
- Projected year-2 tax
- $1,658 · $138/mo
- Expected delta
- +$919/yr (+$77/mo · 124.3%)
ⓘ Screening estimate from a state-policy table — verify with the county assessor before closing.
Climate risk First Street
- Flood 1/10 Low FEMA zone X (unshaded) · 0% chance over 30 yrs
- Wildfire 5/10 Major
- Heat 9/10 Extreme 7 d/yr ≥108°F today · 23 d/yr by 30 yrs out
- Wind 9/10 Extreme 99% chance of damaging wind over 30 yrs
- Air quality 1/10 Low 0 unhealthy d/yr today · 0 by 30 yrs out
Nearby sold comps map
Loading sold comps map…
Walkable amenities ~0.75 mi
Loading nearby amenities…
Taxation est. · year 1
- Rental income
- $17,386
- − Mortgage interest
- −$11,190
- − Property taxes
- −$739
- − Insurance
- −$999
- − Repairs & maintenance
- −$1,391
- − Management
- −$1,391
- − Depreciation
- −$5,811
- Taxable loss
- −$4,134
- Est. tax savings @ 24.0%
- +$992
- After-tax cash flow
- $419/yr
For passive investors: Depreciation is non-cash, so a rental often shows a tax loss while cash-flowing — sheltering income. Rental losses are passive: they offset passive income freely, and up to $25,000/yr can offset ordinary (W-2) income if you actively participate and your MAGI is under $100k (phasing out to $0 by $150k); unused losses carry forward. On sale, claimed depreciation is recaptured at up to 25%, and gains may owe capital-gains tax (a 1031 exchange can defer both). Figures are a year-1 estimate at your 24.0% rate — not tax advice; consult a CPA.
Schools (NCES district)
- District
- Citrus
- NCES district ID
- 1200270
- Math proficiency
- 49% ▼ -10.00%
- Reading proficiency
- 50% ▼ -6.00%
- Median HH income
- $38,618
- Composite
- 41.28/100
- National rank
- #3519
- State rank
- #44 of 73 in FL
Livability — Hernando
- Score
- 71/100
- State rank
- #402
- US rank
- #7137
Category grades
Schools grade is shown separately in the Schools card above.
Census & demographics
- Census place
- Hernando, FL
- County
- Citrus County · 111,314 people
- City population
- 17,281
- Metro
- Homosassa Springs, FL
- Population (ZIP)
- 17,281
- Household income
- $57,259
- Rent vs Own
- Severe rent burden
- 314.0
Population outlook (Citrus County) Hauer SSP2
- Today (2025)
- 138,622 people
- By 2030
- 136,886 · -1.3%
- By 2040
- 132,009 · -4.8%
- By 2050
- 125,196 · -9.7%
- By 2075
- 108,570 · -21.7%
- By 2100
- 84,454 · -39.1%
Race, ethnicity, and origin ACS 2023
- Neighborhood character
- Predominantly White (90%)
- Race & ethnicity
- White 90% Hispanic / Latino 4% Two or more races 3% Asian 2% Black 2%
- Common ancestry
- Romanian 4% Slovak 4% Lithuanian 3%
- Foreign-born
- 8% · Canada, China, South Korea
- Languages at home
- 93% English-only · Spanish 3% German/W. Germanic 2% Tagalog/Filipino 1%
Political lean MEDSL · Citrus
- 2024 margin
- Solid R (+45.9) · D 26.8% · R 72.6%
- 2008→2024 swing
- -29.8pp toward R · 2008: -16.1pp · 2024: -45.9pp
- All cycles
- 2024: R+45.9 2020: R+41.0 2016: R+39.7 2012: R+21.9 2008: R+16.1
Not yet ingested
- Civics
- —
Market trends
- HPI YoY
- ▼ -76.70%
- Current HPI
- 273.3262
- Rent YoY
- —
- Metro
- Homosassa Springs, FL
- State GDP YoY
- ▲ 3.28%
- F500 in state
- 36
Industry mix (Fortune 500 HQ in FL)
| Industry | F500 HQs | Revenue |
|---|---|---|
| Industrial Technology | 2 | $29B |
|
||
| Insurance | 2 | $17B |
|
||
| Retail | 1 | $60B |
|
||
| Technology Distribution | 1 | $58B |
|
||
| Homebuilding | 1 | $35B |
|
||
| Technology Manufacturing | 1 | $35B |
|
||
Price history
+1111.4% since first listed101 events — show timeline
- 2026-05-25 Price Changed $199,877 Stellar MLS as Distributed by MLS Grid
- 2026-05-21 Price Changed $199,878 Stellar MLS as Distributed by MLS Grid
- 2026-05-20 Price Changed $199,879 Stellar MLS as Distributed by MLS Grid
- 2026-05-19 Price Changed $199,880 Stellar MLS as Distributed by MLS Grid
- 2026-05-18 Price Changed $199,881 Stellar MLS as Distributed by MLS Grid
- 2026-05-15 Price Changed $199,882 Stellar MLS as Distributed by MLS Grid
- 2026-05-14 Price Changed $199,883 Stellar MLS as Distributed by MLS Grid
- 2026-05-13 Price Changed $199,884 Stellar MLS as Distributed by MLS Grid
- 2026-05-12 Price Changed $199,885 Stellar MLS as Distributed by MLS Grid
- 2026-05-11 Price Changed $199,886 Stellar MLS as Distributed by MLS Grid
- 2026-05-08 Price Changed $199,887 Stellar MLS as Distributed by MLS Grid
- 2026-05-07 Price Changed $199,888 Stellar MLS as Distributed by MLS Grid
- 2026-05-06 Price Changed $199,889 Stellar MLS as Distributed by MLS Grid
- 2026-05-05 Price Changed $199,890 Stellar MLS as Distributed by MLS Grid
- 2026-05-04 Price Changed $199,891 Stellar MLS as Distributed by MLS Grid
- 2026-05-01 Price Changed $199,892 Stellar MLS as Distributed by MLS Grid
- 2026-04-30 Price Changed $199,893 Stellar MLS as Distributed by MLS Grid
- 2026-04-29 Price Changed $199,894 Stellar MLS as Distributed by MLS Grid
- 2026-04-28 Price Changed $199,895 Stellar MLS as Distributed by MLS Grid
- 2026-04-24 Price Changed $199,896 Stellar MLS as Distributed by MLS Grid
- 2026-04-23 Price Changed $199,897 Stellar MLS as Distributed by MLS Grid
- 2026-04-22 Price Changed $199,898 Stellar MLS as Distributed by MLS Grid
- 2026-04-21 Price Changed $199,899 Stellar MLS as Distributed by MLS Grid
- 2026-04-20 Price Changed $199,900 Stellar MLS as Distributed by MLS Grid
- 2026-04-17 Price Changed $199,949 Stellar MLS as Distributed by MLS Grid
- 2026-04-16 Price Changed $200,049 Stellar MLS as Distributed by MLS Grid
- 2026-04-14 Price Changed $200,149 Stellar MLS as Distributed by MLS Grid
- 2026-04-13 Price Changed $200,150 Stellar MLS as Distributed by MLS Grid
- 2026-04-10 Price Changed $200,151 Stellar MLS as Distributed by MLS Grid
- 2026-04-09 Price Changed $200,152 Stellar MLS as Distributed by MLS Grid
- 2026-04-08 Price Changed $200,153 Stellar MLS as Distributed by MLS Grid
- 2026-04-07 Price Changed $200,154 Stellar MLS as Distributed by MLS Grid
- 2026-04-06 Price Changed $200,155 Stellar MLS as Distributed by MLS Grid
- 2026-04-03 Price Changed $200,156 Stellar MLS as Distributed by MLS Grid
- 2026-04-02 Price Changed $200,157 Stellar MLS as Distributed by MLS Grid
- 2026-04-01 Price Changed $200,158 Stellar MLS as Distributed by MLS Grid
- 2026-03-31 Price Changed $200,159 Stellar MLS as Distributed by MLS Grid
- 2026-03-30 Price Changed $200,160 Stellar MLS as Distributed by MLS Grid
- 2026-03-27 Price Changed $200,161 Stellar MLS as Distributed by MLS Grid
- 2026-03-26 Price Changed $200,162 Stellar MLS as Distributed by MLS Grid
- 2026-03-25 Price Changed $200,163 Stellar MLS as Distributed by MLS Grid
- 2026-03-24 Price Changed $200,164 Stellar MLS as Distributed by MLS Grid
- 2026-03-23 Price Changed $200,165 Stellar MLS as Distributed by MLS Grid
- 2026-03-20 Price Changed $200,166 Stellar MLS as Distributed by MLS Grid
- 2026-03-19 Price Changed $200,167 Stellar MLS as Distributed by MLS Grid
- 2026-03-18 Price Changed $200,168 Stellar MLS as Distributed by MLS Grid
- 2026-03-17 Price Changed $200,169 Stellar MLS as Distributed by MLS Grid
- 2026-03-16 Price Changed $200,170 Stellar MLS as Distributed by MLS Grid
- 2026-03-13 Price Changed $200,171 Stellar MLS as Distributed by MLS Grid
- 2026-03-12 Price Changed $200,172 Stellar MLS as Distributed by MLS Grid
- 2026-03-11 Price Changed $200,173 Stellar MLS as Distributed by MLS Grid
- 2026-03-10 Price Changed $200,174 Stellar MLS as Distributed by MLS Grid
- 2026-03-09 Price Changed $200,175 Stellar MLS as Distributed by MLS Grid
- 2026-03-09 Price Changed $252,581 Stellar MLS as Distributed by MLS Grid
- 2026-03-06 Price Changed $200,176 Stellar MLS as Distributed by MLS Grid
- 2026-03-05 Price Changed $200,177 Stellar MLS as Distributed by MLS Grid
- 2026-03-04 Price Changed $200,178 Stellar MLS as Distributed by MLS Grid
- 2026-03-03 Price Changed $200,179 Stellar MLS as Distributed by MLS Grid
- 2026-03-02 Price Changed $200,180 Stellar MLS as Distributed by MLS Grid
- 2026-02-27 Price Changed $200,181 Stellar MLS as Distributed by MLS Grid
- 2026-02-26 Price Changed $200,182 Stellar MLS as Distributed by MLS Grid
- 2026-02-25 Price Changed $200,183 Stellar MLS as Distributed by MLS Grid
- 2026-02-24 Price Changed $200,184 Stellar MLS as Distributed by MLS Grid
- 2026-02-23 Price Changed $200,185 Stellar MLS as Distributed by MLS Grid
- 2026-02-22 Price Changed $200,186 Stellar MLS as Distributed by MLS Grid
- 2026-02-20 Price Changed $200,286 Stellar MLS as Distributed by MLS Grid
- 2026-02-19 Price Changed $200,287 Stellar MLS as Distributed by MLS Grid
- 2026-02-18 Price Changed $200,288 Stellar MLS as Distributed by MLS Grid
- 2026-02-17 Price Changed $200,289 Stellar MLS as Distributed by MLS Grid
- 2026-02-16 Price Changed $200,290 Stellar MLS as Distributed by MLS Grid
- 2026-02-14 Price Changed $200,291 Stellar MLS as Distributed by MLS Grid
- 2026-02-13 Price Changed $200,391 Stellar MLS as Distributed by MLS Grid
- 2026-02-12 Price Changed $200,392 Stellar MLS as Distributed by MLS Grid
- 2026-02-11 Price Changed $200,393 Stellar MLS as Distributed by MLS Grid
- 2026-02-10 Price Changed $200,394 Stellar MLS as Distributed by MLS Grid
- 2026-02-09 Price Changed $200,395 Stellar MLS as Distributed by MLS Grid
- 2026-02-07 Price Changed $200,396 Stellar MLS as Distributed by MLS Grid
- 2026-02-06 Price Changed $200,496 Stellar MLS as Distributed by MLS Grid
- 2026-02-05 Price Changed $200,497 Stellar MLS as Distributed by MLS Grid
- 2026-02-04 Price Changed $200,498 Stellar MLS as Distributed by MLS Grid
- 2026-02-03 Price Changed $200,499 Stellar MLS as Distributed by MLS Grid
- 2026-01-30 Price Changed $200,500 Stellar MLS as Distributed by MLS Grid
- 2026-01-25 Price Changed $200,600 Stellar MLS as Distributed by MLS Grid
- 2026-01-16 Price Changed $200,700 Stellar MLS as Distributed by MLS Grid
- 2026-01-09 Price Changed $200,800 Stellar MLS as Distributed by MLS Grid
- 2026-01-04 Price Changed $205,800 Stellar MLS as Distributed by MLS Grid
- 2025-12-18 Price Changed $205,900 Stellar MLS as Distributed by MLS Grid
- 2025-12-12 Price Changed $204,300 Stellar MLS as Distributed by MLS Grid
- 2025-12-06 Price Changed $204,400 Stellar MLS as Distributed by MLS Grid
- 2025-11-28 Price Changed $204,500 Stellar MLS as Distributed by MLS Grid
- 2025-11-21 Price Changed $204,600 Stellar MLS as Distributed by MLS Grid
- 2025-11-14 Price Changed $204,700 Stellar MLS as Distributed by MLS Grid
- 2025-11-06 Price Changed $204,800 Stellar MLS as Distributed by MLS Grid
- 2025-10-09 Price Changed $204,900 Stellar MLS as Distributed by MLS Grid
- 2025-09-30 Listed $209,900 Stellar MLS as Distributed by MLS Grid
- 2024-12-20 Listing Removed — Stellar MLS as Distributed by MLS Grid
- 2024-12-09 Relisted — Stellar MLS as Distributed by MLS Grid
- 2004-04-01 Sold (Public Records) $17,000 Public Records
- 2000-08-01 Sold (Public Records) $17,000 Public Records
- 1989-05-01 Sold (Public Records) $20,500 Public Records
- 1987-04-01 Sold (Public Records) $16,500 Public Records
Property tax history
+8.9%/yrLatest (2025): $739 · +18.2% YoY. Source: county tax records.
Cash-flow waterfall
monthlySold comps — $/sqft
last 12 mo · ≤1 miLoading sold comps…