5012 Southside Dr · Louisville, KY
Flood risk 1/10 · Minimal
- FEMA flood zone
- X (unshaded)
- Chance of flooding over 30 yrs
- 0.0%
- Est. flood insurance / yr
- $473 – $860
Fire risk 1/10 · Minimal
- Est. fire insurance / yr
- $839 – $1,559
Heat risk 5/10 · Moderate
- Hot days now (above 105°F)
- 7 days/yr
- Hot days in 30 yrs
- 20 days/yr
Wind risk 2/10 · Minimal
- Chance of severe wind over 30 yrs
- 2.0%
Air-quality risk 2/10 · Minimal
- Unhealthy air days now
- 1 days/yr
- Unhealthy air days in 30 yrs
- 3 days/yr
Risk factors via First Street. Map © Google.
Why this score? — see what drove the D- grade
The composite is a weighted blend of 9 inputs, each scored 0–100. Each bar is that input's sub-score; the figure is the points it added to the 100-point composite (weight × sub-score).
- Cash flow +12.7/30.0
- ARV discount +6.1/15.0
- DSCR +3.8/10.0
- Livability +3.2/5.0
- Rent growth +3.0/5.0
- 1% rule +2.8/10.0
- Condition / age +2.5/5.0
- Schools +2.3/10.0
- Appreciation +0.0/10.0
$265,000
🖨 Deal sheet 📄 Offer letter ✓ Due diligence
Listing remarks
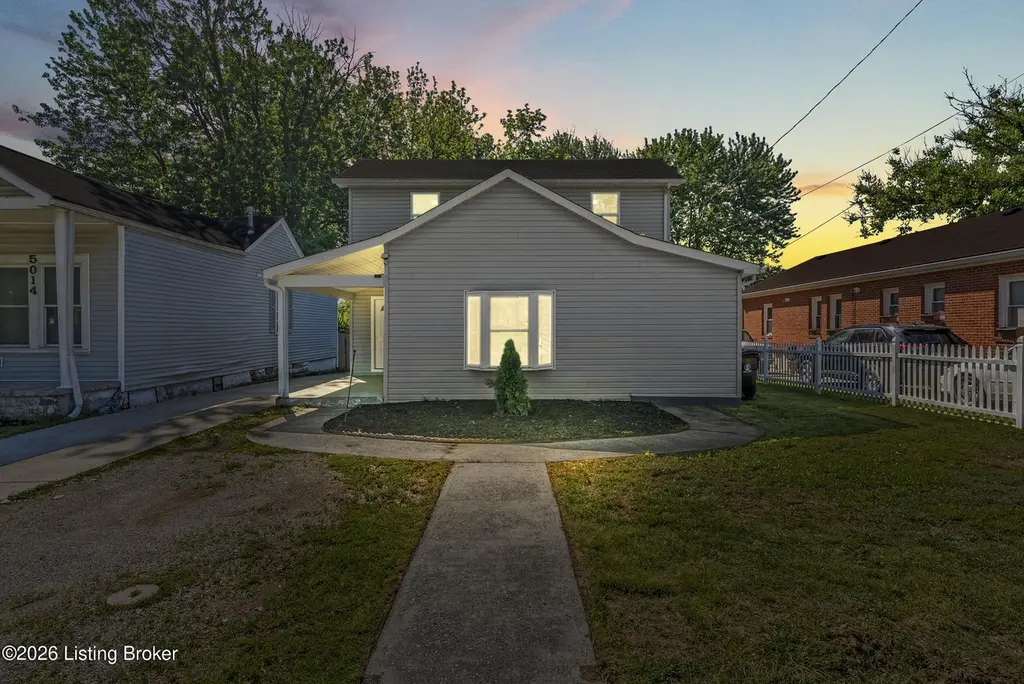
Completely rebuilt since 2022, this beautifully updated home offers 5 spacious bedrooms and 3 full bathrooms. Enjoy peace of mind with a newer roof and HVAC system, along with a modern kitchen featuring updated cabinetry and appliances. Bathrooms have been tastefully renovated, and all bedrooms offer generous space. The home is vacant, easy to show, and truly move-in ready—perfect for buyers seeking comfort, style, and convenience.
Key facts
- 7,545 sq ft lot
- Built 2021
- Listed 27 days
Property features AI
Finance
- Other: Building area reported as 2,022 (source: other)
- HOA & community: Subdivision: Meadowbrook; No association fee
Exterior
- Parking: Driveway
- Utilities: Electricity connected
- Home design: Single-family residence; Other architectural style; 2-story home; Entry and primary living spaces on the first floor
- Construction: Built in 2021; Vinyl siding; Shingle roof; Crawl space and poured concrete foundation
- Exterior features: Cleared lot; Fenced (other type)
Interior
- Kitchen: Kitchen on the first floor; Dining area on the first floor
- Bedrooms: 5 bedrooms (all on the first floor); Primary bedroom on the first floor
- Bathrooms: 3 full bathrooms (primary and full bathrooms located on the first floor); No half bathrooms
- Heating & cooling: Natural gas heating; Central air conditioning; 1 HVAC unit
- Interior features: 8 total finished rooms; 6 closets; Unfinished basement with outside entry; No fireplaces
- Laundry & utility: First-floor laundry
Neighborhood map
What this means for you Summary
Snapshot
- This is a 5-bed/3.0-bath single-family listed at $265k.
Deal economics
- At list price, monthly cash flow is $-31 ($-372/yr) — negative.
- To cash-flow at today's rent, offer at most $260k (2.1% below list).
- To meet the 1% rule (rent ≥ 1% of price), the offer needs to be $207k (21.9% below list).
- Recommended offer: $207k (21.9% below list) — sets the bar for 1% rule.
- Cap rate 6.2% vs local median 5.0% in Louisville — meaningfully above typical; check what's discounted (condition, days-on-market, listing class) to confirm the premium yield is real.
Location & tenants
- Location reads 63/100 on livability (#333 in KY) — a middle-class / working-renter tenant base. Strengths: cost of living A+, housing A+; Watch: employment C-, health & safety D+, schools D-.
- Jefferson County (urban): math 19% / reading 35% proficiency, ranked #121 of 165 in KY (top 73%) — low school quality limits family demand, transient renter base, plan for 1-2y turnover.
- Market conditions: Rents rising (+1.9%/yr); 243 active listings in the ZIP; 1 comparable units currently listed for rent nearby; 2,836 units permitted in Jefferson County in 2024 (1,558 in 5+ unit buildings).
- At $2,071/mo this rent would consume 45% of the median local household income ($55k/yr) (locally 2054% of renters already pay >50% of income on rent) — very limited rent-growth headroom before tenants either downsize or default.
Forward outlook
- Local home prices are declining (-3.0%/yr); year-one equity from $2k of loan paydown is wiped out by about $8k of value loss. Plan a longer hold.
- Jefferson County population projected at +13% by 2050 — modest demand growth; plan on rents tracking national, not racing it.
Negotiation context
- It's been on market 27 days — a 2% lower offer ($261k) is reasonable based on typical stale-listing flexibility.
- 6 sale attempts since 25y ago with the ask held roughly flat each time — persistent listings suggest the price (not the market) is what's stuck; bring a comps-based counter.
- Current owner paid $31k; list at $265k implies a 755% gain — meaningful room to come down on a strong offer.
Risks & watch-outs
- Climate carrying-cost: extreme-heat days projected 7→20/yr by 2055 (HVAC capex compounding) — expect insurance premiums to compound above CPI over the hold.
Questions for the listing agent
- What do current leases actually rent for vs. the listed asking? Can we see a recent rent roll and the last 12 months of T-12 income?
- Is there a deadline driving the sale (1031 exchange, divorce, estate, relocation)? That informs how much negotiation room exists.
- Schools are D-rated, which usually means shorter tenancies and higher turnover. Who's the typical renter profile here, and what's been the actual vacancy rate?
- Crime grade is F in this area — have there been break-ins, vandalism, or insurance claims at this property in the last 3 years? What carrier currently insures it and at what premium?
- The area grade is low — what's the realistic commute time and amenity access for the typical tenant pool here? Any planned neighborhood developments (good or bad) we should know about?
- What's the average days-on-market for RENTAL listings here right now (not sales)? A rising rental-DOM trend means longer vacancies and softer asking-rent achievability than the comps imply.
- What's the recent tenant-quality profile in this submarket — average credit score on applications, eviction rate, late-payment / NSF rate, and stable-employment percentage? A property-management company in the area should have these aggregated.
- How much new for-sale + rental construction is in the pipeline within 1–3 miles? Heavy new supply typically softens prices + rents 12–24 months out; constrained supply supports both.
Investment metrics
- 1% rule
- 0.78% ✗
- Cap rate
- 6.15%
- Cash-on-cash
- -0.50%
- DSCR
- 0.98
- GRM
- 10.7
CMA / ARV
- ARV (on-the-fly)
- $256,794
- Comps found
- 12
Show comp detail 12 sales within ~0.75 mi
| Address | Dist | Beds/Ba | Sqft | Sold | Price | $/sf | Match |
|---|---|---|---|---|---|---|---|
| 530 School Way | 0.46mi | 4/3.0 (-1) | 2,091 (+3%) | 1mo | $269,900 | $129 | 67 |
| 5605 W Southland Blvd | 0.62mi | 5/2.5 | 2,072 (+2%) | 2mo | $285,000 | $138 | 63 |
| 4736 Southern Pkwy | 0.58mi | 4/3.0 (-1) | 2,000 (-1%) | 16mo | $359,000 | $180 | 53 |
| 505 Forum Ave | 0.33mi | 4/1.0 (-1) | 2,264 (+12%) | 4mo | $255,000 | $113 | 48 |
| 4705 Southern Pkwy | 0.57mi | 4/3.0 (-1) | 2,160 (+7%) | 12mo | $400,000 | $185 | 48 |
| 227 Inverness Ave | 0.43mi | 4/1.5 (-1) | 1,910 (-6%) | 20mo | $141,500 | $74 | 43 |
| 629 Iroquois Ave | 0.69mi | 4/2.0 (-1) | 2,053 (+2%) | 19mo | $260,000 | $127 | 41 |
| 5610 Southland Blvd | 0.65mi | 4/3.0 (-1) | 1,778 (-12%) | 9mo | $200,000 | $112 | 37 |
| 1019 Brookline Ave | 0.75mi | 4/2.0 (-1) | 1,824 (-10%) | 6mo | $258,000 | $141 | 35 |
| 4840 S 6th St | 0.61mi | 4/1.5 (-1) | 1,832 (-9%) | 21mo | $230,000 | $126 | 28 |
| 124 E Wellington Ave | 0.69mi | 4/2.0 (-1) | 2,300 (+14%) | 11mo | $269,000 | $117 | 27 |
| 707 Iroquois Ave | 0.75mi | 4/1.5 (-1) | 1,896 (-6%) | 23mo | $232,700 | $123 | 25 |
Match score weights: distance 35% · size 25% · config 20% · recency 20%. Top-matched comps best support the ARV.
Projected returns pro-forma
-3.0% appreciation · 1.89% rent growth · sell at horizon
- IRR
- -18.3%
- Equity multiple
- 0.36×
- Total profit
- $-47,271
- Equity at exit
- $39,512
- IRR
- -12.8%
- Equity multiple
- 0.28×
- Total profit
- $-53,164
- Equity at exit
- $22,912
Cash invested: $74,200 (down + closing). Projections, not guarantees.
Landlord ↔ Tenant lean methodology
- Overall (STATE)
- 83 Strongly Landlord-Friendly
- State Kentucky
- 83 Strongly Landlord-Friendly · R+16
- County
- — inherits STATE
- City
- — inherits STATE
ZIP-level market 40214
- Rents YoY
- 1.9%
- Active inventory
- 243
- Price-to-rent
- 10.7×
Monthly cashflow live
- Estimated rent
- $2,071 medium interval (Pro) →
- Mortgage (P&I)
- −$1,390
- Tax from tax record
- −$167 /mo · $2,000/yr
- Insurance
- −$110
- HOA
- −$0
- Vacancy / Maint / Mgmt
- −$435
- Net cashflow
- $-31
Break-even live
UW: 25.0% down · 7.5% · 30yr · 1.5% tax · 5.0% vac · 8.0% maint · 8.0% mgmt
Financing live
Cash to close
- Down payment
- $66,250
- Closing costs
- $7,950
- Reserves months
- —
- Total cash needed
- —
Loan-product check · same deal, 3 products live
Conventional
25% down · 7.5% · 30yr
- Down + closing
- —
- Monthly P&I
- —
- Monthly cashflow
- —
- DSCR
- —
- Eligible?
- —
Personal DTI + credit; lowest rate.
DSCR
20% down · 8.5% · 30yr
- Down + closing
- —
- Monthly P&I
- —
- Monthly cashflow
- —
- DSCR
- —
- Eligible?
- —
No personal income docs; deal must DSCR.
Hard money
10% down · 12.0% · 12mo
- Down + closing
- —
- Monthly P&I
- —
- Monthly cashflow
- —
- DSCR
- —
- Eligible?
- —
Short-term bridge; refi at stabilization.
Rent comps 1 comps
| Address | Beds | Baths | Sqft | Rent | $/sqft | DOM | Units | Dist |
|---|---|---|---|---|---|---|---|---|
| 4010 Taylor Blvd Louisville, KY | 4.0 | 2.0 | 1612 | $3,000 | $1.86 | 16d | 1 | 1.37mi |
Listing history 12 events
-
2026-05-01$265,000 Active
-
2021-05-17soldstatus $31,000
-
2013-09-21historical
-
2013-09-21historical
-
2012-09-21$88,900
-
2012-09-21$88,900
-
2010-06-30historical
-
2010-06-30historical
-
2010-02-17$99,900
-
2010-02-17$94,900
-
2001-06-25soldstatus $46,100
-
2001-03-09$48,000
ⓘ Source: listings_history table (triggers on properties + properties_extension) + one-shot
backfill from property_details.listing_events for pre-trigger history.
Tax reassessment forecast KY · Resets to sale price
- Current annual tax
- $2,000 · $167/mo
- Projected year-2 tax
- $2,279 · $190/mo
- Expected delta
- +$279/yr (+$23/mo · 13.9%)
ⓘ Screening estimate from a state-policy table — verify with the county assessor before closing.
Climate risk First Street
- Flood 1/10 Low FEMA zone X (unshaded) · 0% chance over 30 yrs
- Wildfire 1/10 Low
- Heat 5/10 Major 7 d/yr ≥105°F today · 20 d/yr by 30 yrs out
- Wind 2/10 Low 2% chance of damaging wind over 30 yrs
- Air quality 2/10 Low 1 unhealthy d/yr today · 3 by 30 yrs out
Nearby sold comps map
Loading sold comps map…
Walkable amenities ~0.75 mi
Loading nearby amenities…
Taxation est. · year 1
- Rental income
- $24,848
- − Mortgage interest
- −$14,844
- − Property taxes
- −$2,000
- − Insurance
- −$1,325
- − Repairs & maintenance
- −$1,988
- − Management
- −$1,988
- − Depreciation
- −$7,709
- Taxable loss
- −$5,006
- Est. tax savings @ 24.0%
- +$1,201
- After-tax cash flow
- $830/yr
For passive investors: Depreciation is non-cash, so a rental often shows a tax loss while cash-flowing — sheltering income. Rental losses are passive: they offset passive income freely, and up to $25,000/yr can offset ordinary (W-2) income if you actively participate and your MAGI is under $100k (phasing out to $0 by $150k); unused losses carry forward. On sale, claimed depreciation is recaptured at up to 25%, and gains may owe capital-gains tax (a 1031 exchange can defer both). Figures are a year-1 estimate at your 24.0% rate — not tax advice; consult a CPA.
Schools (NCES district)
- District
- Jefferson County
- NCES district ID
- 2102990
- Math proficiency
- 19% ▼ -17.00%
- Reading proficiency
- 35% ▼ -11.00%
- Median HH income
- $47,885
- Composite
- 23.45/100
- National rank
- #7884
- State rank
- #121 of 165 in KY
Livability — Louisville
- Score
- 63/100
- State rank
- #333
- US rank
- #15887
Category grades
Schools grade is shown separately in the Schools card above.
Census & demographics
- Census place
- Louisville, KY
- County
- Jefferson County · 790,184 people
- City population
- 769,292
- Metro
- Louisville/Jefferson County, KY-IN
- Population (ZIP)
- 45,405
- Household income
- $54,931
- Rent vs Own
- Severe rent burden
- 2054.0
Population outlook (Jefferson County) Hauer SSP2
- Today (2025)
- 823,112 people
- By 2030
- 849,343 · +3.2%
- By 2040
- 895,696 · +8.8%
- By 2050
- 933,630 · +13.4%
- By 2075
- 1,028,262 · +24.9%
- By 2100
- 1,072,675 · +30.3%
Race, ethnicity, and origin ACS 2023
- Neighborhood character
- Diverse neighborhood (Simpson 0.67)
- Race & ethnicity
- White 51% Black 22% Hispanic / Latino 14% Two or more races 12% Asian 7%
- Hispanic origin (detail)
- Mexican 3% Cuban 6%
- Common ancestry
- Slovak 1% Lithuanian 1% Serbian 1%
- Foreign-born
- 21% · Canada, Vietnam, Philippines
- Languages at home
- 74% English-only · Spanish 12% Vietnamese 3% Other Asian/Pacific 2%
Political lean MEDSL · Jefferson
- 2024 margin
- D (+16.6) · D 57.4% · R 40.9% · Other 1.7%
- 2008→2024 swing
- +4.5pp toward D · 2008: 12.0pp · 2024: 16.6pp
- All cycles
- 2024: D+16.6 2020: D+20.1 2016: D+13.3 2012: D+11.1 2008: D+12.0
Not yet ingested
- Civics
- —
Market trends
- HPI YoY
- ▼ -235.43%
- Current HPI
- 237.4062
- Rent YoY
- ▲ 1.89%
- Metro
- Louisville/Jefferson County, KY-IN
- State GDP YoY
- ▲ 1.81%
- F500 in state
- 4
Industry mix (Fortune 500 HQ in KY)
| Industry | F500 HQs | Revenue |
|---|---|---|
| Healthcare | 1 | $118B |
|
||
| Food / Beverage | 1 | $7B |
|
||
Price history
+452.1% since first listed12 events — show timeline
- 2026-05-01 Listed $265,000 Metro Search MLS
- 2021-05-17 Sold (Public Records) $31,000 Public Records
- 2013-09-21 Listing Removed — Metro Search MLS
- 2013-09-21 Listing Removed — Metro Search MLS
- 2012-09-21 Listed $88,900 Metro Search MLS
- 2012-09-21 Listed $88,900 Metro Search MLS
- 2010-06-30 Listing Removed — Metro Search MLS
- 2010-06-30 Listing Removed — Metro Search MLS
- 2010-02-17 Listed $94,900 Metro Search MLS
- 2010-02-17 Listed $99,900 Metro Search MLS
- 2001-06-25 Sold (MLS) $46,100 Metro Search MLS
- 2001-03-09 Listed $48,000 Metro Search MLS
Property tax history
+4.0%/yrLatest (2025): $2,000 · +43.1% YoY. Source: county tax records.
Cash-flow waterfall
monthlySold comps — $/sqft
last 12 mo · ≤1 miLoading sold comps…