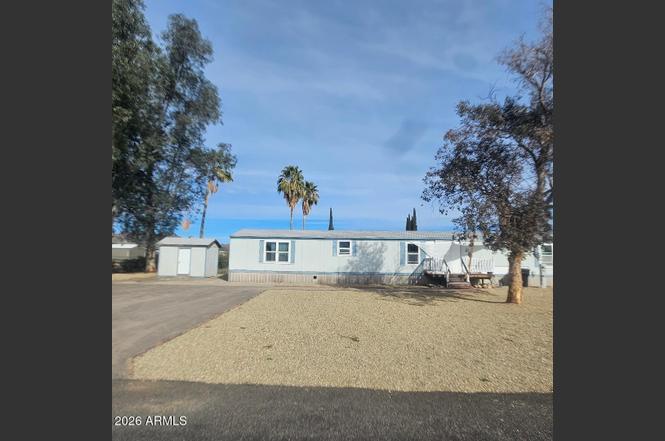
23750 W Cannon Dr · Congress, AZ
Flood risk 1/10 · Minimal
- FEMA flood zone
- X (unshaded)
- Chance of flooding over 30 yrs
- 0.0%
- Est. flood insurance / yr
- $507 – $1,088
Fire risk 6/10 · Moderate
- Est. fire insurance / yr
- $610 – $1,132
Heat risk 7/10 · Major
- Hot days now (above 104°F)
- 6 days/yr
- Hot days in 30 yrs
- 14 days/yr
Wind risk 1/10 · Minimal
- Chance of severe wind over 30 yrs
- —
Air-quality risk 2/10 · Minimal
- Unhealthy air days now
- 0 days/yr
- Unhealthy air days in 30 yrs
- 1 days/yr
Risk factors via First Street. Map © Google.
Why this score? — see what drove the F grade
The composite is a weighted blend of 9 inputs, each scored 0–100. Each bar is that input's sub-score; the figure is the points it added to the 100-point composite (weight × sub-score).
- Cash flow +9.6/30.0
- Appreciation +6.9/10.0
- Schools +5.0/10.0
- Livability +3.3/5.0
- DSCR +2.7/10.0
- Rent growth +2.5/5.0
- Condition / age +2.5/5.0
- 1% rule +1.7/10.0
- ARV discount +0.0/15.0
$219,900
🖨 Deal sheet (PDF) 📄 Offer letter ✓ Due diligence
Listing remarks MLS
This is an affordable opportunity to own a home in the Paso Del Sol subdivision. Enjoy the clean country air, mountain views, and the tranquil neighborhood. The remodeling on this 1116 Sq Ft Manufactured Home has been started. Now you can finish it and make it your own! The home is located on a large .45 acre fenced lot and includes two additional storage sheds in the backyard. **This property is in Auction Status**
Key facts
- 0.46 acre lot
- 2 parking spots
- Built 1999
Property features AI
Finance
- Other: Lot size recorded by assessor
- Financial info: Current financing non-assumable
- HOA & community: No association fees
Exterior
- Parking: 2 open parking spaces; Separate storage area for parking
- Utilities: City water; Septic — connected; 220V in kitchen
- Home design: Manufactured/mobile home; Fee simple ownership
- Construction: Wood frame construction with wood siding; Composition roof
- Exterior features: Chain-link fencing; Exterior storage; Desert front and back landscaping; Gravel/stone front; County-maintained road access; Asphalt road surface
Interior
- Kitchen: Refrigerator provided; 220V outlet in kitchen
- Bedrooms: 2 possible bedrooms
- Flooring: Vinyl flooring
- Bathrooms: 2 full bathrooms
- Heating & cooling: Electric heating; Central air; Ceiling fans
- Interior features: Eat-in kitchen; Vaulted ceilings; Double vanity; Master bedroom with 3/4 bath; Dual-pane windows; Storage inside the property
- Laundry & utility: Indoor laundry with washer/dryer hookups (washer/dryer not included)
Neighborhood map
What this means for you Summary
Snapshot
- This is a 2-bed/2.0-bath manufactured listed at $220k.
Deal economics
- At list price, monthly cash flow is $-150 ($-2k/yr) — negative.
- To cash-flow at today's rent, offer at most $193k (12.1% below list).
- To meet the 1% rule (rent ≥ 1% of price), the offer needs to be $147k (33.3% below list).
- Recommended offer: $147k (33.3% below list) — sets the bar for 1% rule.
- Cap rate 5.5% vs local median 4.2% in Congress — meaningfully above typical; check what's discounted (condition, days-on-market, listing class) to confirm the premium yield is real.
Location & tenants
- Location reads 66/100 on livability (#75 in AZ) — a middle-class / working-renter tenant base. Strengths: crime A+, cost of living A+, housing A+; Watch: employment D, amenities F, commute F.
- Congress Elementary District (4479) (rural): math 60% / reading 55% proficiency, ranked #91 of 501 in AZ (top 18%) — acceptable for families but not a draw, mixed tenant base, ~2y average lease.
- Zoned schools: Congress Elementary School (math 44% / reading 34%, grade F, #398 of 1,109 statewide, top 37%, 102 students, 74% FRL) — zoned schools average 74% FRL vs 59% district-wide (16 pts higher); higher-poverty schools than district average — tighter screening recommended.
- Zoned-school proficiency averages 40% at this address vs 58% district-wide (-18 pts) — the specific schools serving this property underperform the Congress Elementary District (4479) average; the district grade overstates school quality for this exact location.
- Market conditions: 110 active listings in the ZIP; 2,062 units permitted in Yavapai County in 2024 (98 in 5+ unit buildings).
Forward outlook
- In year one you build about $10k of equity ($2k loan paydown + $8k appreciation (3.8% local appreciation)).
- Yavapai County population projected at +10% by 2050 — modest demand growth; plan on rents tracking national, not racing it.
- By year 4, paydown + projected appreciation supports a ~$33k cash-out refi (75% LTV) — recoverable capital for the next deal without selling this one.
Negotiation context
- It's been on market 131 days — a 12% lower offer ($194k) is reasonable based on typical stale-listing flexibility.
- 5 sale attempts since 16y ago with the ask held roughly flat each time — persistent listings suggest the price (not the market) is what's stuck; bring a comps-based counter.
- Current owner paid $28k; list at $220k implies a 685% gain — meaningful room to come down on a strong offer.
Risks & watch-outs
- Climate carrying-cost: major wildfire risk; extreme-heat days projected 6→14/yr by 2055 (HVAC capex compounding) — expect insurance premiums to compound above CPI over the hold.
Questions for the listing agent
- What do current leases actually rent for vs. the listed asking? Can we see a recent rent roll and the last 12 months of T-12 income?
- It's been on market 131 days. Have you received any prior offers? Is the seller open to a 33% concession, seller financing, or rate buy-down credit?
- Why hasn't it sold? Are there any deal-killer items the seller is aware of (foundation, flood, title, zoning, code violations)?
- Is there a deadline driving the sale (1031 exchange, divorce, estate, relocation)? That informs how much negotiation room exists.
- Schools are B-rated — typically a magnet for longer-tenancy family renters. What's the average tenant stay here, and is there a school-zone premium baked into asking?
- The area grade is low — what's the realistic commute time and amenity access for the typical tenant pool here? Any planned neighborhood developments (good or bad) we should know about?
- What's the average days-on-market for RENTAL listings here right now (not sales)? A rising rental-DOM trend means longer vacancies and softer asking-rent achievability than the comps imply.
- What's the recent tenant-quality profile in this submarket — average credit score on applications, eviction rate, late-payment / NSF rate, and stable-employment percentage? A property-management company in the area should have these aggregated.
- How much new for-sale + rental construction is in the pipeline within 1–3 miles? Heavy new supply typically softens prices + rents 12–24 months out; constrained supply supports both.
Investment metrics
- 1% rule
- 0.67% ✗
- Cap rate
- 5.47%
- Cash-on-cash
- -2.93%
- DSCR
- 0.87
- GRM
- 12.5
CMA / ARV
- ARV (on-the-fly)
- $181,908
- Comps found
- 1
Show comp detail 1 sale within ~0.75 mi
| Address | Dist | Beds/Ba | Sqft | Sold | Price | $/sf | Match |
|---|---|---|---|---|---|---|---|
| 27197 S Bullard Dr | 0.10mi | 3/2.0 (+1) | 1,153 (+3%) | 11mo | $188,000 | $163 | 75 |
Match score weights: distance 35% · size 25% · config 20% · recency 20%. Top-matched comps best support the ARV.
Projected returns pro-forma
3.77% appreciation · 3.0% rent growth · sell at horizon
- IRR
- 7.0%
- Equity multiple
- 1.42×
- Total profit
- $25,953
- Equity at exit
- $108,592
- IRR
- 9.4%
- Equity multiple
- 2.54×
- Total profit
- $94,745
- Equity at exit
- $175,336
Cash invested: $61,572 (down + closing). Projections, not guarantees.
Landlord ↔ Tenant lean methodology
- Overall (STATE)
- 87 Strongly Landlord-Friendly
- State Arizona
- 87 Strongly Landlord-Friendly · R+3
- County
- — inherits STATE
- City
- — inherits STATE
ZIP-level market 85332
- Home prices YoY
- 0.7%
- Active inventory
- 110
- Price-to-rent
- 12.5×
Monthly cashflow live
- Estimated rent
- $1,467 medium interval (Pro) →
- Mortgage (P&I)
- −$1,153
- Tax from tax record
- −$64 /mo · $773/yr
- Insurance
- −$92
- HOA
- −$0
- Vacancy / Maint / Mgmt
- −$308
- Net cashflow
- $-150
Break-even live
Sensitivity live
| Price | -10% $-26 | -5% $-88 | +0% $-150 | +5% $-212 | +10% $-275 |
|---|---|---|---|---|---|
| Rent | -10% $-266 | -5% $-208 | +0% $-150 | +5% $-92 | +10% $-34 |
| Rate | -1.0pp $-39 | -0.5pp $-94 | base $-150 | +0.5pp $-207 | +1.0pp $-265 |
UW: 25.0% down · 7.5% · 30yr · 1.5% tax · 5.0% vac · 8.0% maint · 8.0% mgmt
Financing live
Cash to close
- Down payment
- $54,975
- Closing costs
- $6,597
- Reserves months
- —
- Total cash needed
- —
Loan-product check · same deal, 3 products live
Conventional
25% down · 7.5% · 30yr
- Down + closing
- —
- Monthly P&I
- —
- Monthly cashflow
- —
- DSCR
- —
- Eligible?
- —
Personal DTI + credit; lowest rate.
DSCR
20% down · 8.5% · 30yr
- Down + closing
- —
- Monthly P&I
- —
- Monthly cashflow
- —
- DSCR
- —
- Eligible?
- —
No personal income docs; deal must DSCR.
Hard money
10% down · 12.0% · 12mo
- Down + closing
- —
- Monthly P&I
- —
- Monthly cashflow
- —
- DSCR
- —
- Eligible?
- —
Short-term bridge; refi at stabilization.
Listing history 26 events
-
2026-06-21days on market $219,900 Active 131 DOM
-
2026-06-18days on market $219,900 Active 128 DOM
-
2026-06-17days on market $219,900 Active 127 DOM
-
2026-06-16days on market $219,900 Active 126 DOM
-
2026-06-15days on market $219,900 Active 125 DOM
-
2026-06-13days on market $219,900 Active 123 DOM
-
2026-06-09days on market $219,900 Active 119 DOM
-
2026-06-08days on market $219,900 Active 118 DOM
-
2026-06-07days on market $219,900 Active 117 DOM
-
2026-06-04days on market $219,900 Active 114 DOM
-
2026-06-03days on market $219,900 Active 113 DOM
-
2026-06-02days on market $219,900 Active 112 DOM
-
2026-06-01days on market $219,900 Active 111 DOM
-
2026-05-31days on market $219,900 Active 110 DOM
-
2026-02-10$219,900 Active
-
2011-09-05soldstatus $28,000 424-char remark
Show marketing remark (424 chars)
This is an affordable opportunity to own a home in the Paso Del Sol subdivision. Enjoy the clean country air, mountain views, and the tranquil neighborhood. The remodeling on this 1116 Sq Ft Manufactured Home has been started. Now you can finish it and make it your own! The home is located on a large .45 acre fenced lot and includes two additional storage sheds in the backyard. **This property is in Auction Status**
-
2011-07-15$39,900 424-char remark
Show marketing remark (424 chars)
This is an affordable opportunity to own a home in the Paso Del Sol subdivision. Enjoy the clean country air, mountain views, and the tranquil neighborhood. The remodeling on this 1116 Sq Ft Manufactured Home has been started. Now you can finish it and make it your own! The home is located on a large .45 acre fenced lot and includes two additional storage sheds in the backyard. **This property is in Auction Status**
-
2011-07-13historical
-
2011-05-09$39,900
-
2011-05-01historical
-
2011-04-21$49,900
-
2011-03-29historical
-
2010-08-16$58,900
-
1999-02-09soldstatus $72,000
-
1997-01-29soldstatus $72,000
-
1992-10-13soldstatus $67,000
ⓘ Source: listings_history table (triggers on properties + properties_extension) + one-shot
backfill from property_details.listing_events for pre-trigger history.
Tax reassessment forecast AZ · Resets to sale price
- Current annual tax
- $773 · $64/mo
- Projected year-2 tax
- $1,451 · $121/mo
- Expected delta
- +$679/yr (+$57/mo · 87.8%)
ⓘ Screening estimate from a state-policy table — verify with the county assessor before closing.
Climate risk First Street
- Flood 1/10 Low FEMA zone X (unshaded) · 0% chance over 30 yrs
- Wildfire 6/10 Major
- Heat 7/10 Severe 6 d/yr ≥104°F today · 14 d/yr by 30 yrs out
- Wind 1/10 Low
- Air quality 2/10 Low 0 unhealthy d/yr today · 1 by 30 yrs out
Nearby sold comps map
Loading sold comps map…
Walkable amenities ~0.75 mi
Loading nearby amenities…
Taxation est. · year 1
- Rental income
- $17,606
- − Mortgage interest
- −$12,318
- − Property taxes
- −$773
- − Insurance
- −$1,100
- − Repairs & maintenance
- −$1,408
- − Management
- −$1,408
- − Depreciation
- −$6,397
- Taxable loss
- −$5,798
- Est. tax savings @ 24.0%
- +$1,392
- After-tax cash flow
- $-410/yr
For passive investors: Depreciation is non-cash, so a rental often shows a tax loss while cash-flowing — sheltering income. Rental losses are passive: they offset passive income freely, and up to $25,000/yr can offset ordinary (W-2) income if you actively participate and your MAGI is under $100k (phasing out to $0 by $150k); unused losses carry forward. On sale, claimed depreciation is recaptured at up to 25%, and gains may owe capital-gains tax (a 1031 exchange can defer both). Figures are a year-1 estimate at your 24.0% rate — not tax advice; consult a CPA.
Schools (NCES district)
- District
- Congress Elementary District (4479)
- NCES district ID
- 0402220
- Math proficiency
- 60% ▼ -5.00%
- Reading proficiency
- 55% ▼ -5.00%
- Median HH income
- $40,613
- Composite
- 49.83/100
- National rank
- #4193
- State rank
- #91 of 501 in AZ
Livability — Congress
- Score
- 66/100
- State rank
- #75
- US rank
- #11962
Category grades
Schools grade is shown separately in the Schools card above.
Census & demographics
- Census place
- Congress, AZ
- Population (ZIP)
- 1,777
Population outlook (Yavapai County) Hauer SSP2
- Today (2025)
- 241,389 people
- By 2030
- 249,523 · +3.4%
- By 2040
- 259,966 · +7.7%
- By 2050
- 264,736 · +9.7%
- By 2075
- 269,334 · +11.6%
- By 2100
- 256,505 · +6.3%
Race, ethnicity, and origin ACS 2023
- Neighborhood character
- Predominantly White (92%)
- Race & ethnicity
- White 92% Two or more races 4% Hispanic / Latino 2%
- Common ancestry
- Slovak 4% Scottish 3% Lithuanian 2%
- Foreign-born
- 1%
- Languages at home
- 96% English-only · German/W. Germanic 2% Spanish 1%
Political lean MEDSL · Yavapai
- 2024 margin
- Solid R (+33.9) · D 32.6% · R 66.5%
- 2008→2024 swing
- -9.5pp toward R · 2008: -24.4pp · 2024: -33.9pp
- All cycles
- 2024: R+33.9 2020: R+29.3 2016: R+31.4 2012: R+30.7 2008: R+24.4
Not yet ingested
- Civics
- —
Market trends
- HPI YoY
- ▲ 3.77%
- Current HPI
- 513.0899
- Rent YoY
- —
- Metro
- —
- State GDP YoY
- ▲ 4.54%
- F500 in state
- 20
Industry mix (Fortune 500 HQ in AZ)
| Industry | F500 HQs | Revenue |
|---|---|---|
| Technology | 2 | $13B |
|
||
| Mining / Metals | 1 | $23B |
|
||
| Environmental Services | 1 | $16B |
|
||
| Metals / Steel | 1 | $14B |
|
||
| Technology Distribution | 1 | $9B |
|
||
| Homebuilding | 1 | $8B |
|
||
Price history
+228.2% since first listed12 events — show timeline
- 2026-02-10 Listed $219,900 ARMLS
- 2011-09-05 Sold (MLS) $28,000 ARMLS
- 2011-07-15 Listed $39,900 ARMLS
- 2011-07-13 Listing Removed — ARMLS
- 2011-05-09 Listed $39,900 ARMLS
- 2011-05-01 Listing Removed — ARMLS
- 2011-04-21 Listed $49,900 ARMLS
- 2011-03-29 Listing Removed — ARMLS
- 2010-08-16 Listed $58,900 ARMLS
- 1999-02-09 Sold (Public Records) $72,000 Public Records
- 1997-01-29 Sold (Public Records) $72,000 Public Records
- 1992-10-13 Sold (Public Records) $67,000 Public Records
Property tax history
+3.7%/yrLatest (2025): $773 · +9.5% YoY. Source: county tax records.
Cash-flow waterfall
monthlySold comps — $/sqft
last 12 mo · ≤1 miLoading sold comps…