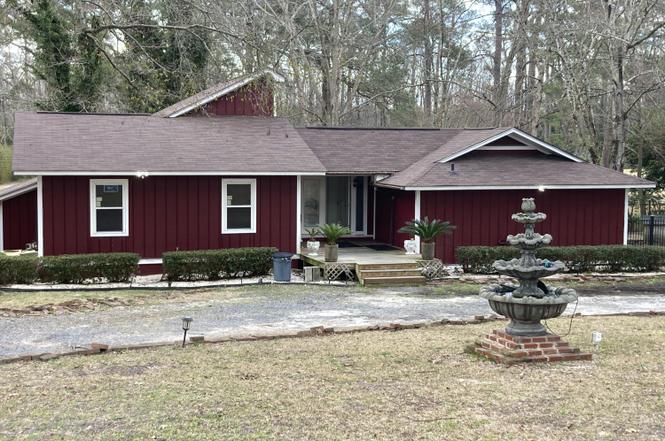
7 Dogwood Ln · Walterboro, SC
Flood risk 4/10 · Minor
- FEMA flood zone
- X (unshaded)
- Chance of flooding over 30 yrs
- 0.24%
- Est. flood insurance / yr
- $507 – $1,088
Fire risk 6/10 · Moderate
- Est. fire insurance / yr
- $783 – $1,453
Heat risk 8/10 · Major
- Hot days now (above 107°F)
- 7 days/yr
- Hot days in 30 yrs
- 17 days/yr
Wind risk 8/10 · Major
- Chance of severe wind over 30 yrs
- 80.0%
Air-quality risk 3/10 · Minor
- Unhealthy air days now
- 3 days/yr
- Unhealthy air days in 30 yrs
- 3 days/yr
Risk factors via First Street. Map © Google.
Why this score? — see what drove the D grade
The composite is a weighted blend of 9 inputs, each scored 0–100. Each bar is that input's sub-score; the figure is the points it added to the 100-point composite (weight × sub-score).
- Cash flow +15.7/30.0
- ARV discount +7.5/15.0
- DSCR +4.8/10.0
- 1% rule +3.4/10.0
- Livability +2.9/5.0
- Rent growth +2.5/5.0
- Condition / age +2.5/5.0
- Schools +1.7/10.0
- Appreciation +0.0/10.0
$260,000
🖨 Deal sheet 📄 Offer letter ✓ Due diligence
Listing remarks
This 2313 square Ft. house is located in Doqwood Hill Country Club 9 Holes Golf Course. This home has a lot to offer which features 3 bedrooms and 3 bathrooms. The property has an partial enclosed kitchen that opens to a spacious dining family area. The master bedroom is spacious and there's a beautiful view from the outdoor deck of the course and fountain pond. One who may smoke cigars will love the natural ambience from the deck! The overlooking of the Country Club Golf Course is a great peace of mind asset. This home has received great updates and approval. Unfortunately the nice refrigerator and washer/dryer does not conveys, however the gas range is negotiable! Call today to setup an
Key facts
- Outdoor deck
- $21 HOA
- Built 1984
Tags
Property features AI
Finance
- HOA & community: Annual association fee of 250; Community amenities include golf course, golf membership available, tennis courts, and trash service
Exterior
- Utilities: City of Walterboro utilities
- Home design: Single family attached residence; One story; Ground-level entry
- Construction: Asphalt roof
- Exterior features: Lawn well; Located on a golf course
Interior
- Kitchen: Pantry
- Bedrooms: 3 bedrooms
- Flooring: Ceramic tile
- Bathrooms: 3 bathrooms
- Heating & cooling: Cooling: Other
- Interior features: Family room; Entrance foyer; Living/dining combo; Pantry
- Laundry & utility: Laundry room with washer hookup; Electric dryer hookup
Neighborhood map
What this means for you Summary
Snapshot
- This is a 3-bed/3.0-bath single-family listed at $260k.
Deal economics
- At list price, monthly cash flow is $112 ($1k/yr) — positive.
- The deal already cash-flows at list — no discount required.
- To meet the 1% rule (rent ≥ 1% of price), the offer needs to be $219k (15.6% below list).
- Recommended offer: $219k (15.6% below list) — sets the bar for 1% rule.
Location & tenants
- Location reads 57/100 on livability (#269 in SC) — a working-class tenant base; expect higher turnover. Strengths: cost of living A+, health & safety A+, housing A-; Watch: crime F, amenities F, commute F.
- Colleton 01 (rural): math 13% / reading 28% proficiency, ranked #69 of 80 in SC (top 86%) — low school quality limits family demand, transient renter base, plan for 1-2y turnover; 69% free/reduced lunch — lower-income household profile, screen leases tightly.
- Zoned schools: Hendersonville Elementary (math 12% / reading 17%, grade F, #553 of 597 statewide, top 95%, 342 students, 100% FRL); Colleton County Middle (math 8% / reading 18%, grade F, #210 of 229 statewide, top 93%, 1,121 students, 100% FRL); Colleton County High (math 28% / reading 80%, grade C-, #137 of 196 statewide, top 70%, 1,497 students, 100% FRL) — zoned schools average 100% FRL vs 69% district-wide (31 pts higher); higher-poverty schools than district average — tighter screening recommended.
- Market conditions: 222 active listings in the ZIP; 50 units permitted in Colleton County in 2024 (0 in 5+ unit buildings).
Forward outlook
- Local home prices are declining (-3.0%/yr); year-one equity from $2k of loan paydown is wiped out by about $8k of value loss. Plan a longer hold.
- Colleton County population projected at -28% by 2050 — secular population decline; favor cash flow + early exit over multi-decade hold.
Negotiation context
- It's been on market 104 days — a 9% lower offer ($237k) is reasonable based on typical stale-listing flexibility.
- 6 sale attempts since 18y ago with the ask held roughly flat each time — persistent listings suggest the price (not the market) is what's stuck; bring a comps-based counter.
- Current owner paid $150k; list at $260k implies a 73% gain — meaningful room to come down on a strong offer.
Risks & watch-outs
- Climate carrying-cost: severe wind risk, 80% chance of damaging wind over 30y; major wildfire risk; extreme-heat days projected 7→17/yr by 2055 (HVAC capex compounding) — expect insurance premiums to compound above CPI over the hold.
Questions for the listing agent
- It's been on market 104 days. Have you received any prior offers? Is the seller open to a 16% concession, seller financing, or rate buy-down credit?
- What does the HOA fee cover, when was the last increase, and are there any pending special assessments or reserve-fund shortfalls?
- Why hasn't it sold? Are there any deal-killer items the seller is aware of (foundation, flood, title, zoning, code violations)?
- Is there a deadline driving the sale (1031 exchange, divorce, estate, relocation)? That informs how much negotiation room exists.
- Schools are F-rated, which usually means shorter tenancies and higher turnover. Who's the typical renter profile here, and what's been the actual vacancy rate?
- Crime grade is F in this area — have there been break-ins, vandalism, or insurance claims at this property in the last 3 years? What carrier currently insures it and at what premium?
- The area grade is low — what's the realistic commute time and amenity access for the typical tenant pool here? Any planned neighborhood developments (good or bad) we should know about?
- What's the average days-on-market for RENTAL listings here right now (not sales)? A rising rental-DOM trend means longer vacancies and softer asking-rent achievability than the comps imply.
- What's the recent tenant-quality profile in this submarket — average credit score on applications, eviction rate, late-payment / NSF rate, and stable-employment percentage? A property-management company in the area should have these aggregated.
- How much new for-sale + rental construction is in the pipeline within 1–3 miles? Heavy new supply typically softens prices + rents 12–24 months out; constrained supply supports both.
Investment metrics
- 1% rule
- 0.84% ✗
- Cap rate
- 6.81%
- Cash-on-cash
- 1.85%
- DSCR
- 1.08
- GRM
- 9.9
CMA / ARV
No comps found within radius.
Projected returns pro-forma
-3.0% appreciation · 3.0% rent growth · sell at horizon
- IRR
- -13.4%
- Equity multiple
- 0.52×
- Total profit
- $-35,070
- Equity at exit
- $38,767
- IRR
- -4.5%
- Equity multiple
- 0.70×
- Total profit
- $-21,652
- Equity at exit
- $22,480
Cash invested: $72,800 (down + closing). Projections, not guarantees.
Landlord ↔ Tenant lean methodology
- Overall (STATE)
- 90 Strongly Landlord-Friendly
- State South Carolina
- 90 Strongly Landlord-Friendly · R+6
- County
- — inherits STATE
- City
- — inherits STATE
ZIP-level market 29488
- Home prices YoY
- -33.6%
- Active inventory
- 222
- Price-to-rent
- 9.9×
Monthly cashflow live
- Estimated rent
- $2,195 medium interval (Pro) →
- Mortgage (P&I)
- −$1,363
- Tax from tax record
- −$129 /mo · $1,547/yr
- Insurance
- −$108
- HOA
- −$21
- Vacancy / Maint / Mgmt
- −$461
- Net cashflow
- $112
Break-even live
UW: 25.0% down · 7.5% · 30yr · 1.5% tax · 5.0% vac · 8.0% maint · 8.0% mgmt
Financing live
Cash to close
- Down payment
- $65,000
- Closing costs
- $7,800
- Reserves months
- —
- Total cash needed
- —
Loan-product check · same deal, 3 products live
Conventional
25% down · 7.5% · 30yr
- Down + closing
- —
- Monthly P&I
- —
- Monthly cashflow
- —
- DSCR
- —
- Eligible?
- —
Personal DTI + credit; lowest rate.
DSCR
20% down · 8.5% · 30yr
- Down + closing
- —
- Monthly P&I
- —
- Monthly cashflow
- —
- DSCR
- —
- Eligible?
- —
No personal income docs; deal must DSCR.
Hard money
10% down · 12.0% · 12mo
- Down + closing
- —
- Monthly P&I
- —
- Monthly cashflow
- —
- DSCR
- —
- Eligible?
- —
Short-term bridge; refi at stabilization.
HOA detail
- Monthly dues
- $21 · $252/yr
- Likely covers
- gas
Listing history 32 events
-
2026-06-18days on market $260,000 Active 104 DOM
-
2026-06-17days on market $260,000 Active 103 DOM
-
2026-06-16days on market $260,000 Active 102 DOM
-
2026-06-15days on market $260,000 Active 101 DOM
-
2026-06-13days on market $260,000 Active 99 DOM
-
2026-06-12days on market $260,000 Active 98 DOM
-
2026-06-09days on market $260,000 Active 95 DOM
-
2026-06-08days on market $260,000 Active 94 DOM
-
2026-06-08days on market $260,000 Active 93 DOM
-
2026-06-04days on market $260,000 Active 89 DOM
-
2026-06-02days on market $260,000 Active 88 DOM
-
2026-06-01days on market $260,000 Active 87 DOM
-
2026-05-31days on market $260,000 Active 86 DOM
-
2026-03-04$260,000 Active
-
2026-01-16historical
-
2025-12-08price $295,000
-
2025-09-03price $305,000
-
2025-07-02price $310,000
-
2025-06-20price $320,000
-
2025-05-05price $330,000
-
2025-03-18price $340,000
-
2025-02-17$350,000 Active
-
2024-08-24historical
-
2024-04-19price $399,999
-
2024-02-23$420,000 Active
-
2023-07-11historical
-
2022-07-22$425,000 Active
-
2015-07-22soldstatus $150,000
-
2012-08-13historical
-
2011-07-07$145,000
-
2009-03-26historical
-
2008-06-22$255,000
ⓘ Source: listings_history table (triggers on properties + properties_extension) + one-shot
backfill from property_details.listing_events for pre-trigger history.
Tax reassessment forecast SC · Resets to sale price
- Current annual tax
- $1,547 · $129/mo
- Projected year-2 tax
- $1,547 · $129/mo
- Expected delta
- $0/yr ($0/mo · 0.0%)
ⓘ Screening estimate from a state-policy table — verify with the county assessor before closing.
Climate risk First Street
- Flood 4/10 Moderate FEMA zone X (unshaded) · 24% chance over 30 yrs
- Wildfire 6/10 Major
- Heat 8/10 Severe 7 d/yr ≥107°F today · 17 d/yr by 30 yrs out
- Wind 8/10 Severe 80% chance of damaging wind over 30 yrs
- Air quality 3/10 Moderate 3 unhealthy d/yr today · 3 by 30 yrs out
Nearby sold comps map
Loading sold comps map…
Walkable amenities ~0.75 mi
Loading nearby amenities…
Taxation est. · year 1
- Rental income
- $26,335
- − Mortgage interest
- −$14,564
- − Property taxes
- −$1,547
- − Insurance
- −$1,300
- − Repairs & maintenance
- −$2,107
- − Management
- −$2,107
- − HOA
- −$252
- − Depreciation
- −$7,564
- Taxable loss
- −$3,105
- Est. tax savings @ 24.0%
- +$745
- After-tax cash flow
- $2,090/yr
For passive investors: Depreciation is non-cash, so a rental often shows a tax loss while cash-flowing — sheltering income. Rental losses are passive: they offset passive income freely, and up to $25,000/yr can offset ordinary (W-2) income if you actively participate and your MAGI is under $100k (phasing out to $0 by $150k); unused losses carry forward. On sale, claimed depreciation is recaptured at up to 25%, and gains may owe capital-gains tax (a 1031 exchange can defer both). Figures are a year-1 estimate at your 24.0% rate — not tax advice; consult a CPA.
Schools (NCES district)
- District
- Colleton 01
- NCES district ID
- 4501830
- Math proficiency
- 13% ▼ -10.00%
- Reading proficiency
- 28% ▬ 0.00%
- Median HH income
- $33,128
- Composite
- 16.66/100
- National rank
- #9171
- State rank
- #69 of 80 in SC
Livability — Walterboro
- Score
- 57/100
- State rank
- #269
- US rank
- #21618
Category grades
Schools grade is shown separately in the Schools card above.
Census & demographics
- Census place
- Walterboro, SC
- City population
- 22,367
- Population (ZIP)
- 22,367
Population outlook (Colleton County) Hauer SSP2
- Today (2025)
- 34,932 people
- By 2030
- 33,078 · -5.3%
- By 2040
- 29,017 · -16.9%
- By 2050
- 25,029 · -28.3%
- By 2075
- 16,894 · -51.6%
- By 2100
- 10,518 · -69.9%
Race, ethnicity, and origin ACS 2023
- Neighborhood character
- Diverse neighborhood (Simpson 0.56)
- Race & ethnicity
- White 54% Black 38% Hispanic / Latino 4% Two or more races 4%
- Common ancestry
- Italian 2% Lithuanian 1% Slovak 1%
- Foreign-born
- 2% · Canada
- Languages at home
- 97% English-only · Spanish 2%
Political lean MEDSL · Colleton
- 2024 margin
- R (+18.2) · D 40.4% · R 58.5% · Other 1.1%
- 2008→2024 swing
- -18.7pp toward R · 2008: 0.5pp · 2024: -18.2pp
- All cycles
- 2024: R+18.2 2020: R+9.5 2016: R+8.5 2012: D+0.2 2008: D+0.5
Not yet ingested
- Civics
- —
Market trends
- HPI YoY
- ▼ -119.20%
- Current HPI
- 235.1237
- Rent YoY
- —
- Metro
- —
- State GDP YoY
- ▲ 4.51%
- F500 in state
- 2
Industry mix (Fortune 500 HQ in SC)
| Industry | F500 HQs | Revenue |
|---|---|---|
| Packaging | 1 | $7B |
|
||
Price history
+2.0% since first listed19 events — show timeline
- 2026-03-04 Listed $260,000 Charleston Trident MLS
- 2026-01-16 Listing Removed — Charleston Trident MLS
- 2025-12-08 Price Changed $295,000 Charleston Trident MLS
- 2025-09-03 Price Changed $305,000 Charleston Trident MLS
- 2025-07-02 Price Changed $310,000 Charleston Trident MLS
- 2025-06-20 Price Changed $320,000 Charleston Trident MLS
- 2025-05-05 Price Changed $330,000 Charleston Trident MLS
- 2025-03-18 Price Changed $340,000 Charleston Trident MLS
- 2025-02-17 Listed $350,000 Charleston Trident MLS
- 2024-08-24 Listing Removed — Charleston Trident MLS
- 2024-04-19 Price Changed $399,999 Charleston Trident MLS
- 2024-02-23 Listed $420,000 Charleston Trident MLS
- 2023-07-11 Listing Removed — Charleston Trident MLS
- 2022-07-22 Listed $425,000 Charleston Trident MLS
- 2015-07-22 Sold (Public Records) $150,000 Public Records
- 2012-08-13 Listing Removed — Charleston Trident MLS
- 2011-07-07 Listed $145,000 Charleston Trident MLS
- 2009-03-26 Listing Removed — Charleston Trident MLS
- 2008-06-22 Listed $255,000 Charleston Trident MLS
Property tax history
+2.5%/yrLatest (2025): $1,547 · +2.5% YoY. Source: county tax records.
Cash-flow waterfall
monthlySold comps — $/sqft
last 12 mo · ≤1 miLoading sold comps…