 🏗️ New Construction
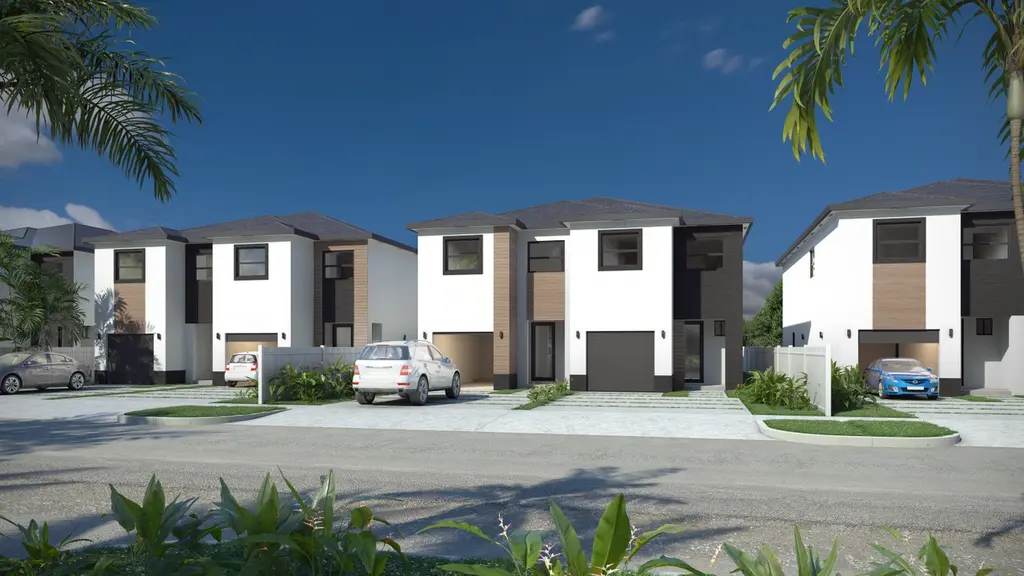
El Campito Residences Plan · Princeton, FL
Flood risk No data
- FEMA flood zone
- —
- Chance of flooding over 30 yrs
- —
- Est. flood insurance / yr
- —
Fire risk No data
- Est. fire insurance / yr
- —
Heat risk No data
- Hot days now (above threshold)
- —
- Hot days in 30 yrs
- —
Wind risk No data
- Chance of severe wind over 30 yrs
- —
Air-quality risk No data
- Unhealthy air days now
- —
- Unhealthy air days in 30 yrs
- —
Risk factors via First Street. Map © Google.
Why this score? — see what drove the C- grade
The composite is a weighted blend of 9 inputs, each scored 0–100. Each bar is that input's sub-score; the figure is the points it added to the 100-point composite (weight × sub-score).
- Cash flow +20.4/30.0
- ARV discount +7.5/15.0
- DSCR +6.5/10.0
- 1% rule +5.5/10.0
- Condition / age +5.0/5.0
- Schools +4.2/10.0
- Livability +3.5/5.0
- Rent growth +2.3/5.0
- Appreciation +0.0/10.0
$555,000
🖨 Deal sheet (PDF) 📄 Offer letter ✓ Due diligence
Listing remarks
Welcome to El Campito Residences, a modern new construction community by E & E Development designed for today's lifestyle. This exclusive community features contemporary duplex-style residences with thoughtfully designed floor plans, modern architecture, and high-end finishes throughout. Each home is built to combine comfort, functionality, and style, offering spacious living areas, open-concept kitchens, impact windows and doors, elegant porcelain flooring, and private outdoor spaces. Located in the growing Miami-Dade area, El Campito Residences offers convenient access to major highways, schools, shopping centers, dining, and entertainment while maintaining a residential neighborhood
Key facts
- High-end finishes
- Parking
- Listed 15 days
Tags
Property features AI
Finance
- Other: List price available (active listing)
- HOA & community: Association fee $50 (frequency not specified)
Exterior
- Parking: 1 parking space
- Utilities: Electric service; Central air
- Home design: New construction plan; Located in Miami, FL (SW address prefix)
- Construction: Living area approximately 2032; Built as part of the El Campito Residences plan
- Exterior features: Shake roof
Interior
- Bedrooms: 3 bedrooms
- Bathrooms: 2 full bathrooms and 1 half bathroom (2.5 total)
- Heating & cooling: Electric heating; Central air conditioning
- Interior features: Plan inventory: El Campito Residences
Neighborhood map
What this means for you Summary
Snapshot
- This is a 2 × 3-bed/2.5-bath units multifamily listed at $555k. Condition is rated excellent.
Deal economics
- At list price, monthly cash flow is $722 ($9k/yr) — positive. Per door: $361/mo.
- The deal already cash-flows at list — no discount required.
- Meets the 1% rule at list price ($6k rent vs $555k).
- Recommended offer: $547k (1.5% below list) — sets the bar for market timing.
- Cap rate 7.9% vs local median 3.1% in Princeton — top-decile yield for the area; either an underpriced asset or a hidden risk that comps aren't pricing in. Stress-test before assuming the spread holds.
Location & tenants
- Location reads 69/100 on livability (#468 in FL) — a middle-class / working-renter tenant base. Strengths: housing A+, crime B+, health & safety B+; Watch: schools D+, amenities F.
- Miami-Dade (suburban): math 45% / reading 54% proficiency, ranked #40 of 73 in FL (top 55%) — families likely to look elsewhere, expect single-tenant / working-renter base with shorter leases; 64% free/reduced lunch — lower-income household profile, screen leases tightly.
- Market conditions: Rents soft (-1.0%/yr); 589 active listings in the ZIP; 9 comparable units currently listed for rent nearby; rentals at typical pace (median 19d on market — plan ~3-4 weeks tenant-placement turnaround); 10,051 units permitted in Miami-Dade County in 2024 (7,758 in 5+ unit buildings).
- At $5,832/mo this rent would consume 95% of the median local household income ($73k/yr) (locally 3351% of renters already pay >50% of income on rent) — very limited rent-growth headroom before tenants either downsize or default.
Forward outlook
- Local home prices are declining (-3.0%/yr); year-one equity from $4k of loan paydown is wiped out by about $17k of value loss. Plan a longer hold.
- Miami-Dade County population projected at +28% by 2050 — long-run rental-demand tailwind backs the buy-and-hold thesis.
Negotiation context
- It's been on market 16 days — a 2% lower offer ($547k) is reasonable based on typical stale-listing flexibility.
Questions for the listing agent
- Can we see the unit-by-unit rent roll, current vacancy, and any below-market leases? What's the average tenancy length?
- What capital expenditures (roof, boiler, parking lot, exteriors) have been made in the last 5 years, and what's planned in the next 2?
- What does the HOA fee cover, when was the last increase, and are there any pending special assessments or reserve-fund shortfalls?
- Is there a deadline driving the sale (1031 exchange, divorce, estate, relocation)? That informs how much negotiation room exists.
- Schools are D-rated, which usually means shorter tenancies and higher turnover. Who's the typical renter profile here, and what's been the actual vacancy rate?
- What's the average days-on-market for RENTAL listings here right now (not sales)? A rising rental-DOM trend means longer vacancies and softer asking-rent achievability than the comps imply.
- What's the recent tenant-quality profile in this submarket — average credit score on applications, eviction rate, late-payment / NSF rate, and stable-employment percentage? A property-management company in the area should have these aggregated.
- How much new apartment / multifamily construction is in the pipeline within 1–3 miles? Heavy new supply (>2% of stock underway) typically softens rents 12–24 months out; light construction supports rent growth.
Investment metrics
- 1% rule
- 1.05% ✓
- Cap rate
- 7.85%
- Cash-on-cash
- 5.57%
- DSCR
- 1.25
- GRM
- 7.9
CMA / ARV
No comps found within radius.
Projected returns pro-forma
-3.0% appreciation · 0.0% rent growth · sell at horizon
- IRR
- -11.1%
- Equity multiple
- 0.61×
- Total profit
- $-60,935
- Equity at exit
- $82,752
- IRR
- -7.0%
- Equity multiple
- 0.62×
- Total profit
- $-59,434
- Equity at exit
- $47,986
Cash invested: $155,400 (down + closing). Projections, not guarantees.
Landlord ↔ Tenant lean methodology
- Overall (STATE)
- 87 Strongly Landlord-Friendly
- State Florida
- 87 Strongly Landlord-Friendly · R+3
- County
- — inherits STATE
- City
- — inherits STATE
ZIP-level market 33032
- Home prices YoY
- -29.8%
- Rents YoY
- -1.0%
- Active inventory
- 589
- Price-to-rent
- 15.9×
Monthly cashflow live
- Estimated rent
- $5,832 high interval (Pro) →
- Mortgage (P&I)
- −$2,910
- Tax est. 1.5%
- −$694 /mo · $8,325/yr
- Insurance
- −$231
- HOA
- −$50
- Vacancy / Maint / Mgmt
- −$1,225
- Net cashflow
- $722
Break-even live
Sensitivity live
| Price | -10% $1,105 | -5% $914 | +0% $722 | +5% $530 | +10% $338 |
|---|---|---|---|---|---|
| Rent | -10% $261 | -5% $491 | +0% $722 | +5% $952 | +10% $1,183 |
| Rate | -1.0pp $1,001 | -0.5pp $863 | base $722 | +0.5pp $578 | +1.0pp $432 |
2-unit breakdown (identical units grouped — click to expand)
| Units | Beds | Baths | Est. rent |
|---|---|---|---|
| 2× units | 3 | 2.5 | $5,832 |
| #1 | 3 | 2.5 | $2,916 |
| #2 | 3 | 2.5 | $2,916 |
| Total (2 units) | $5,832 | ||
UW: 25.0% down · 7.5% · 30yr · 1.5% tax · 5.0% vac · 8.0% maint · 8.0% mgmt
Financing live
Cash to close
- Down payment
- $138,750
- Closing costs
- $16,650
- Reserves months
- —
- Total cash needed
- —
Loan-product check · same deal, 3 products live
Conventional
25% down · 7.5% · 30yr
- Down + closing
- —
- Monthly P&I
- —
- Monthly cashflow
- —
- DSCR
- —
- Eligible?
- —
Personal DTI + credit; lowest rate.
DSCR
20% down · 8.5% · 30yr
- Down + closing
- —
- Monthly P&I
- —
- Monthly cashflow
- —
- DSCR
- —
- Eligible?
- —
No personal income docs; deal must DSCR.
Hard money
10% down · 12.0% · 12mo
- Down + closing
- —
- Monthly P&I
- —
- Monthly cashflow
- —
- DSCR
- —
- Eligible?
- —
Short-term bridge; refi at stabilization.
Rent comps 9 comps
| Address | Beds | Baths | Sqft | Rent | $/sqft | DOM | Units | Dist |
|---|---|---|---|---|---|---|---|---|
| 10856 SW 247th St Homestead, FL | 5.0 | 3.0 | 2501 | $4,300 | $1.72 | 23d | 1 | 0.49mi |
| 25232 SW 117th Pl Homestead, FL | 5.0 | 3.0 | 2500 | $4,999 | $2.00 | 25d | 1 | 0.96mi |
| 11903 SW 241st St Unit 11903 Princeton, FL | 5.0 | 3.0 | 2640 | $4,500 | $1.70 | 18d | 1 | 1.17mi |
| 11876 SW 248th Ter Homestead, FL | 5.0 | 4.0 | 2897 | $4,500 | $1.55 | 8d | 1 | 1.18mi |
| 11876 SW 248th Ter Homestead, FL | 5.0 | 4.0 | 2897 | $4,500 | $1.55 | 25d | 1 | 1.18mi |
| 11719 SW 241st St Homestead, FL | 5.0 | 3.0 | 2495 | $4,600 | $1.84 | 25d | 1 | 1.25mi |
| 11719 SW 241st St Homestead, FL | 5.0 | 3.0 | 2495 | $4,600 | $1.84 | 8d | 1 | 1.25mi |
| 24851 SW 121st Pl Unit 24851 Homestead, FL | 5.0 | 3.5 | 2696 | $4,000 | $1.48 | 11d | 1 | 1.37mi |
| 24242 SW 119th Pl Homestead, FL | 5.0 | 3.0 | 2640 | $4,600 | $1.74 | 19d | 1 | 1.46mi |
HOA detail
- Monthly dues
- $50 · $600/yr
Listing history 11 events
-
2026-06-18days on market $555,000 Active 16 DOM
-
2026-06-17days on market $555,000 Active 15 DOM
-
2026-06-16days on market $555,000 Active 14 DOM
-
2026-06-15days on market $555,000 Active 13 DOM
-
2026-06-13days on market $555,000 Active 11 DOM
-
2026-06-09days on market $555,000 Active 7 DOM
-
2026-06-08days on market $555,000 Active 6 DOM
-
2026-06-08days on market $555,000 Active 5 DOM
-
2026-06-04days on market $555,000 Active 2 DOM
-
2026-06-02remarks 695-char remark
-
2026-06-02$555,000 Active 1 DOM
ⓘ Source: listings_history table (triggers on properties + properties_extension) + one-shot
backfill from property_details.listing_events for pre-trigger history.
Nearby sold comps map
Loading sold comps map…
Walkable amenities ~0.75 mi
Loading nearby amenities…
Taxation est. · year 1
- Rental income
- $69,984
- − Mortgage interest
- −$31,089
- − Property taxes
- −$8,325
- − Insurance
- −$2,775
- − Repairs & maintenance
- −$5,599
- − Management
- −$5,599
- − HOA
- −$600
- − Depreciation
- −$16,145
- Taxable loss
- −$148
- Est. tax savings @ 24.0%
- +$35
- After-tax cash flow
- $8,697/yr
For passive investors: Depreciation is non-cash, so a rental often shows a tax loss while cash-flowing — sheltering income. Rental losses are passive: they offset passive income freely, and up to $25,000/yr can offset ordinary (W-2) income if you actively participate and your MAGI is under $100k (phasing out to $0 by $150k); unused losses carry forward. On sale, claimed depreciation is recaptured at up to 25%, and gains may owe capital-gains tax (a 1031 exchange can defer both). Figures are a year-1 estimate at your 24.0% rate — not tax advice; consult a CPA.
Condition & rehab AI · 4 photos
This modern new construction home in El Campito Residences is move-in ready with excellent condition and high-end finishes. It offers spacious living areas, open-concept kitchens, and private outdoor spaces, making it ideal for both resale and rental.
Value-add opportunities
- Both Landscaping improvements — Enhances curb appeal and adds value.
- Both Smart home integration — Improves convenience and adds modern appeal.
- Both Smart lighting system — Enhances energy efficiency and adds modern appeal.
Renovation cost estimate screening
Value-add ROI direction
- Both Landscaping improvements — Enhances curb appeal and adds value. ↑
- Both Smart home integration — Improves convenience and adds modern appeal. ↑
- Both Smart lighting system — Enhances energy efficiency and adds modern appeal. ↑
ⓘ Cost ranges are severity-bucket heuristics (US national rule-of-thumb). Get contractor quotes + a written scope before underwriting a rehab budget.
Schools (NCES district)
- District
- Miami-Dade
- NCES district ID
- 1200390
- Math proficiency
- 45% ▼ -16.00%
- Reading proficiency
- 54% ▼ -5.00%
- Median HH income
- $43,928
- Composite
- 41.76/100
- National rank
- #3397
- State rank
- #40 of 73 in FL
Livability — Princeton
- Score
- 69/100
- State rank
- #468
- US rank
- #8462
Category grades
Schools grade is shown separately in the Schools card above.
Census & demographics
- County
- Miami-Dade County · 2,697,751 people
- City population
- 62,021
- Metro
- Miami-Fort Lauderdale-Pompano Beach, FL
- Population (ZIP)
- 65,132
- Household income
- $73,429
- Rent vs Own
- Severe rent burden
- 3351.0
Population outlook (Miami-Dade County) Hauer SSP2
- Today (2025)
- 3,126,439 people
- By 2030
- 3,325,765 · +6.4%
- By 2040
- 3,697,561 · +18.3%
- By 2050
- 4,012,134 · +28.3%
- By 2075
- 4,605,612 · +47.3%
- By 2100
- 4,866,598 · +55.7%
Race, ethnicity, and origin ACS 2023
- Neighborhood character
- Predominantly Hispanic (68%)
- Race & ethnicity
- Hispanic / Latino 68% Two or more races 35% Black 20% White 10%
- Hispanic origin (detail)
- Mexican 3% Puerto Rican 5% Cuban 31% Dominican 5%
- Common ancestry
- Hispanic 3%
- Foreign-born
- 45% · Canada, Jamaica, Dominican Republic
- Languages at home
- 33% English-only · Spanish 64% French/Haitian/Cajun 2%
Political lean MEDSL · Miami-Dade
- 2024 margin
- R (+11.4) · D 43.9% · R 55.4%
- 2008→2024 swing
- -27.6pp toward R · 2008: 16.1pp · 2024: -11.4pp
- All cycles
- 2024: R+11.4 2020: D+7.3 2016: D+29.6 2012: D+23.7 2008: D+16.1
Not yet ingested
- Civics
- —
Market trends
- HPI YoY
- ▼ -176.52%
- Current HPI
- 415.9508
- Rent YoY
- ▼ -0.99%
- Metro
- Miami-Fort Lauderdale-Pompano Beach, FL
- State GDP YoY
- ▲ 3.28%
- F500 in state
- 36
Industry mix (Fortune 500 HQ in FL)
| Industry | F500 HQs | Revenue |
|---|---|---|
| Industrial Technology | 2 | $29B |
|
||
| Insurance | 2 | $17B |
|
||
| Retail | 1 | $60B |
|
||
| Technology Distribution | 1 | $58B |
|
||
| Homebuilding | 1 | $35B |
|
||
| Technology Manufacturing | 1 | $35B |
|
||
Cash-flow waterfall
monthlySold comps — $/sqft
last 12 mo · ≤1 miLoading sold comps…