3908 NW 34th Ave · Cape Coral, FL
Flood risk 8/10 · Major
- FEMA flood zone
- X (shaded)
- Chance of flooding over 30 yrs
- 0.96%
- Est. flood insurance / yr
- $507 – $1,088
Fire risk 3/10 · Minor
- Est. fire insurance / yr
- $947 – $1,759
Heat risk 10/10 · Severe
- Hot days now (above 107°F)
- 7 days/yr
- Hot days in 30 yrs
- 31 days/yr
Wind risk 10/10 · Severe
- Chance of severe wind over 30 yrs
- 99.0%
Air-quality risk 2/10 · Minimal
- Unhealthy air days now
- 1 days/yr
- Unhealthy air days in 30 yrs
- 1 days/yr
Risk factors via First Street. Map © Google.
Why this score? — see what drove the D- grade
The composite is a weighted blend of 9 inputs, each scored 0–100. Each bar is that input's sub-score; the figure is the points it added to the 100-point composite (weight × sub-score).
- Cash flow +12.3/30.0
- ARV discount +7.5/15.0
- Schools +4.1/10.0
- Livability +3.9/5.0
- DSCR +3.6/10.0
- Condition / age +2.5/5.0
- 1% rule +2.2/10.0
- Rent growth +1.1/5.0
- Appreciation +0.0/10.0
$341,350
🖨 Deal sheet 📄 Offer letter ✓ Due diligence
Listing remarks MLS
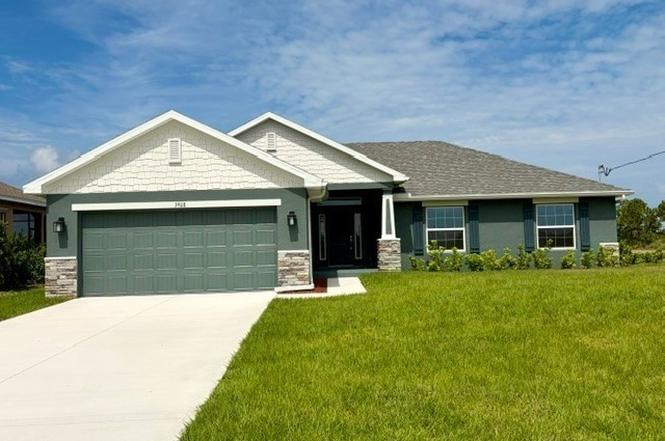
Take a look at this Western Rear Exposure Lot waiting for your dream home to be built on it! Just off Burnt Store Road with easy access to Burnt Store Marina, Punta Gorda, and Cape Coral. This North West location tucked back on a quiet cul-de-sac street offers a sense of peace and tranquility. Lot is cleared with no trees or bushes to remove. Please do your due diligence on the direct neighbors, one to the South and the other to the West.
Key facts
- Quiet cul-de-sac
- Tile flooring
- Spacious lanai
Tags
Property features AI
Finance
- Other: Lot is irregular, on a cul-de-sac/dead-end with dimensions approximately 95 x 125 x 87 x 96 and western exposure; Zoning: R1-D
- Financial info: Pets allowed
- HOA & community: No association fee
Exterior
- Parking: Attached 2-car garage; 2 covered parking spaces
- Utilities: Cable available; Sewer: assessment unpaid; Water: assessment unpaid; Irrigation available for an extra cost
- Home design: Single-story home; Faces east; Currently under construction
- Construction: Block, concrete and stucco construction; Shingle roof
- Exterior features: No exterior features listed
Interior
- Kitchen: Dishwasher; Disposal; Microwave
- Bedrooms: No specific room types listed
- Flooring: Tile
- Bathrooms: 2 full bathrooms
- Heating & cooling: Central heating (electric); Central air conditioning (electric)
- Interior features: Vaulted ceilings; Split bedroom floorplan; Separate/formal dining room; French doors/atrium doors; Separate shower (shower only); Double-hung windows with shutters
- Laundry & utility: Washer hookup; Dryer hookup
Neighborhood map
What this means for you Summary
Snapshot
- This is a 4-bed/2.0-bath land listed at $341k.
Deal economics
- At list price, monthly cash flow is $-130 ($-2k/yr) — negative.
- To cash-flow at today's rent, offer at most $318k (6.7% below list).
- To meet the 1% rule (rent ≥ 1% of price), the offer needs to be $247k (27.7% below list).
- Recommended offer: $247k (27.7% below list) — sets the bar for 1% rule.
- Cap rate 6.1% vs local median 3.1% in Cape Coral — top-decile yield for the area; either an underpriced asset or a hidden risk that comps aren't pricing in. Stress-test before assuming the spread holds.
Location & tenants
- Location reads 77/100 on livability (#208 in FL, #3,098 nationally) — a middle-class / working-renter tenant base. Strengths: housing A+, health & safety A+, amenities B+; Watch: commute F.
- Lee (suburban): math 47% / reading 50% proficiency, ranked #42 of 73 in FL (top 58%) — families likely to look elsewhere, expect single-tenant / working-renter base with shorter leases.
- Market conditions: Rents falling (-5.5%/yr); 2652 active listings in the ZIP; 14 comparable units currently listed for rent nearby; rentals at typical pace (median 24d on market — plan ~3-4 weeks tenant-placement turnaround); solid renter incomes; 15,411 units permitted in Lee County in 2024 (4,686 in 5+ unit buildings).
- This rent runs 33% of the median local income ($91k/yr) — at the standard rent-burdened threshold; future hikes will face affordability resistance.
Forward outlook
- Local home prices are declining (-3.0%/yr); year-one equity from $2k of loan paydown is wiped out by about $10k of value loss. Plan a longer hold.
- Lee County population projected at +44% by 2050 — long-run rental-demand tailwind backs the buy-and-hold thesis.
Negotiation context
- It's been on market 122 days — a 12% lower offer ($300k) is reasonable based on typical stale-listing flexibility.
- 2 sale attempts since 3y ago; this cycle's ask has dropped $40k (10%) from the opening price — seller is motivated, your offer sets the floor, not the list.
- Current owner paid $39k; list at $341k implies a 775% gain — meaningful room to come down on a strong offer.
Risks & watch-outs
- Watch-outs: flood insurance adds $66/mo.
- Climate carrying-cost: severe flood risk; severe wind risk, 99% chance of damaging wind over 30y; extreme-heat days projected 7→31/yr by 2055 (HVAC capex compounding) — expect insurance premiums to compound above CPI over the hold.
Questions for the listing agent
- What do current leases actually rent for vs. the listed asking? Can we see a recent rent roll and the last 12 months of T-12 income?
- It's been on market 122 days. Have you received any prior offers? Is the seller open to a 28% concession, seller financing, or rate buy-down credit?
- What's the actual annual flood-insurance premium (NFIP or private), and is the property in a SFHA with mandatory coverage?
- Why hasn't it sold? Are there any deal-killer items the seller is aware of (foundation, flood, title, zoning, code violations)?
- Is there a deadline driving the sale (1031 exchange, divorce, estate, relocation)? That informs how much negotiation room exists.
- Schools are B-rated — typically a magnet for longer-tenancy family renters. What's the average tenant stay here, and is there a school-zone premium baked into asking?
- The area grade is low — what's the realistic commute time and amenity access for the typical tenant pool here? Any planned neighborhood developments (good or bad) we should know about?
- What's the average days-on-market for RENTAL listings here right now (not sales)? A rising rental-DOM trend means longer vacancies and softer asking-rent achievability than the comps imply.
- What's the recent tenant-quality profile in this submarket — average credit score on applications, eviction rate, late-payment / NSF rate, and stable-employment percentage? A property-management company in the area should have these aggregated.
- How much new for-sale + rental construction is in the pipeline within 1–3 miles? Heavy new supply typically softens prices + rents 12–24 months out; constrained supply supports both.
Investment metrics
- 1% rule
- 0.72% ✗
- Cap rate
- 6.07%
- Cash-on-cash
- -0.79%
- DSCR
- 0.96
- GRM
- 11.5
CMA / ARV
No comps found within radius.
Projected returns pro-forma
-3.0% appreciation · 0.0% rent growth · sell at horizon
- IRR
- -22.0%
- Equity multiple
- 0.26×
- Total profit
- $-70,932
- Equity at exit
- $50,896
- IRR
- -24.2%
- Equity multiple
- -0.06×
- Total profit
- $-100,897
- Equity at exit
- $29,514
Cash invested: $95,578 (down + closing). Projections, not guarantees.
Landlord ↔ Tenant lean methodology
- Overall (STATE)
- 87 Strongly Landlord-Friendly
- State Florida
- 87 Strongly Landlord-Friendly · R+3
- County
- — inherits STATE
- City
- — inherits STATE
ZIP-level market 33993
- Home prices YoY
- -14.1%
- Rents YoY
- -5.5%
- Active inventory
- 2652
- Price-to-rent
- 11.5×
Monthly cashflow live
- Estimated rent
- $2,469 high interval (Pro) →
- Mortgage (P&I)
- −$1,790
- Tax from tax record
- −$81 /mo · $976/yr
- Insurance
- −$142
- Flood insurance flood zone
- −$66 /mo · $798/yr
- HOA
- −$0
- Vacancy / Maint / Mgmt
- −$519
- Net cashflow
- $-130
Break-even live
UW: 25.0% down · 7.5% · 30yr · 1.5% tax · 5.0% vac · 8.0% maint · 8.0% mgmt
Financing live
Cash to close
- Down payment
- $85,338
- Closing costs
- $10,240
- Reserves months
- —
- Total cash needed
- —
Loan-product check · same deal, 3 products live
Conventional
25% down · 7.5% · 30yr
- Down + closing
- —
- Monthly P&I
- —
- Monthly cashflow
- —
- DSCR
- —
- Eligible?
- —
Personal DTI + credit; lowest rate.
DSCR
20% down · 8.5% · 30yr
- Down + closing
- —
- Monthly P&I
- —
- Monthly cashflow
- —
- DSCR
- —
- Eligible?
- —
No personal income docs; deal must DSCR.
Hard money
10% down · 12.0% · 12mo
- Down + closing
- —
- Monthly P&I
- —
- Monthly cashflow
- —
- DSCR
- —
- Eligible?
- —
Short-term bridge; refi at stabilization.
Rent comps 14 comps
| Address | Beds | Baths | Sqft | Rent | $/sqft | DOM | Units | Dist |
|---|---|---|---|---|---|---|---|---|
| 3617 NW 38th Ter Cape Coral, FL | 4.0 | 3.0 | 1903 | $2,200 | $1.16 | 23d | 1 | 0.35mi |
| 3812 NW 38th St Cape Coral, FL | 3.0 | 2.0 | 1920 | $2,600 | $1.35 | 23d | 1 | 0.56mi |
| 3911 NW 40th Ln Cape Coral, FL | 3.0 | 2.0 | 1363 | $3,500 | $2.57 | 23d | 1 | 0.56mi |
| 4157 NW 39th Ave Cape Coral, FL | 3.0 | 2.0 | 1515 | $2,500 | $1.65 | 3d | 1 | 0.67mi |
| 4157 NW 39th Ave Cape Coral, FL | 3.0 | 2.0 | 1515 | $2,500 | $1.65 | 23d | 1 | 0.67mi |
| 3929 NW 42nd Ln Cape Coral, FL | 3.0 | 2.0 | 1333 | $1,995 | $1.50 | 23d | 1 | 0.83mi |
| 4115 NW 36th Ln Cape Coral, FL | 4.0 | 2.0 | 1787 | $2,000 | $1.12 | 23d | 1 | 0.93mi |
| 3535 NW 42nd Ave Cape Coral, FL | 4.0 | 2.0 | 1787 | $2,145 | $1.20 | 23d | 1 | 1.05mi |
| 3518 NW 44th Pl Cape Coral, FL | 4.0 | 3.0 | 2306 | $2,750 | $1.19 | 23d | 1 | 1.37mi |
| 4333 NW 34th Ln Cape Coral, FL | 4.0 | 3.0 | 1904 | $2,200 | $1.16 | 23d | 1 | 1.40mi |
| 3241 NW 41st Pl Cape Coral, FL | 3.0 | 2.0 | 1688 | $1,795 | $1.06 | 23d | 1 | 1.42mi |
| 4333 NW 34th St Cape Coral, FL | 4.0 | 3.0 | 1904 | $2,200 | $1.16 | 23d | 1 | 1.47mi |
| 4402 NW 34th Ter Cape Coral, FL | 4.0 | 3.0 | 1904 | $2,200 | $1.16 | 23d | 1 | 1.48mi |
| 4202 NW 32nd Ln Cape Coral, FL | 3.0 | 2.0 | 1688 | $1,795 | $1.06 | 23d | 1 | 1.48mi |
Listing history 18 events
-
2026-06-17days on market $341,350 Active 122 DOM
-
2026-06-16pricedays on market $341,350 Active 121 DOM
-
2026-06-15days on market $340,350 Active 120 DOM
-
2026-06-13pricedays on market $340,350 Active 118 DOM
-
2026-06-10days on market $371,350 Active 115 DOM
-
2026-06-09days on market $371,350 Active 114 DOM
-
2026-06-07days on market $371,350 Active 112 DOM
-
2026-06-02days on market $371,350 Active 107 DOM
-
2026-06-01days on market $371,350 Active 106 DOM
-
2026-06-01days on market $371,350 Active 105 DOM
-
2026-05-08price $371,350
-
2026-02-15$381,350 Active
-
2024-01-11soldstatus $39,000 Closed 442-char remark
Show marketing remark (442 chars)
Take a look at this Western Rear Exposure Lot waiting for your dream home to be built on it! Just off Burnt Store Road with easy access to Burnt Store Marina, Punta Gorda, and Cape Coral. This North West location tucked back on a quiet cul-de-sac street offers a sense of peace and tranquility. Lot is cleared with no trees or bushes to remove. Please do your due diligence on the direct neighbors, one to the South and the other to the West.
-
2024-01-11soldstatus $39,000
Show marketing remark (442 chars)
Take a look at this Western Rear Exposure Lot waiting for your dream home to be built on it! Just off Burnt Store Road with easy access to Burnt Store Marina, Punta Gorda, and Cape Coral. This North West location tucked back on a quiet cul-de-sac street offers a sense of peace and tranquility. Lot is cleared with no trees or bushes to remove. Please do your due diligence on the direct neighbors, one to the South and the other to the West.
-
2023-11-13status Pending 442-char remark
Show marketing remark (442 chars)
Take a look at this Western Rear Exposure Lot waiting for your dream home to be built on it! Just off Burnt Store Road with easy access to Burnt Store Marina, Punta Gorda, and Cape Coral. This North West location tucked back on a quiet cul-de-sac street offers a sense of peace and tranquility. Lot is cleared with no trees or bushes to remove. Please do your due diligence on the direct neighbors, one to the South and the other to the West.
-
2023-09-18price $39,900 442-char remark
Show marketing remark (442 chars)
Take a look at this Western Rear Exposure Lot waiting for your dream home to be built on it! Just off Burnt Store Road with easy access to Burnt Store Marina, Punta Gorda, and Cape Coral. This North West location tucked back on a quiet cul-de-sac street offers a sense of peace and tranquility. Lot is cleared with no trees or bushes to remove. Please do your due diligence on the direct neighbors, one to the South and the other to the West.
-
2023-06-27$42,900 Active 442-char remark
Show marketing remark (442 chars)
Take a look at this Western Rear Exposure Lot waiting for your dream home to be built on it! Just off Burnt Store Road with easy access to Burnt Store Marina, Punta Gorda, and Cape Coral. This North West location tucked back on a quiet cul-de-sac street offers a sense of peace and tranquility. Lot is cleared with no trees or bushes to remove. Please do your due diligence on the direct neighbors, one to the South and the other to the West.
-
2004-09-20soldstatus $25,000
ⓘ Source: listings_history table (triggers on properties + properties_extension) + one-shot
backfill from property_details.listing_events for pre-trigger history.
Tax reassessment forecast FL · Resets to sale price
- Current annual tax
- $976 · $81/mo
- Projected year-2 tax
- $2,833 · $236/mo
- Expected delta
- +$1,857/yr (+$155/mo · 190.2%)
ⓘ Screening estimate from a state-policy table — verify with the county assessor before closing.
Climate risk First Street
- Flood 8/10 Severe FEMA zone X (shaded) · 96% chance over 30 yrs
- Wildfire 3/10 Moderate
- Heat 10/10 Extreme 7 d/yr ≥107°F today · 31 d/yr by 30 yrs out
- Wind 10/10 Extreme 99% chance of damaging wind over 30 yrs
- Air quality 2/10 Low 1 unhealthy d/yr today · 1 by 30 yrs out
Nearby sold comps map
Loading sold comps map…
Walkable amenities ~0.75 mi
Loading nearby amenities…
Taxation est. · year 1
- Rental income
- $29,630
- − Mortgage interest
- −$19,121
- − Property taxes
- −$976
- − Insurance
- −$2,504
- − Repairs & maintenance
- −$2,370
- − Management
- −$2,370
- − Depreciation
- −$9,930
- Taxable loss
- −$7,643
- Est. tax savings @ 24.0%
- +$1,834
- After-tax cash flow
- $280/yr
For passive investors: Depreciation is non-cash, so a rental often shows a tax loss while cash-flowing — sheltering income. Rental losses are passive: they offset passive income freely, and up to $25,000/yr can offset ordinary (W-2) income if you actively participate and your MAGI is under $100k (phasing out to $0 by $150k); unused losses carry forward. On sale, claimed depreciation is recaptured at up to 25%, and gains may owe capital-gains tax (a 1031 exchange can defer both). Figures are a year-1 estimate at your 24.0% rate — not tax advice; consult a CPA.
Schools (NCES district)
- District
- Lee
- NCES district ID
- 1201080
- Math proficiency
- 47% ▼ -11.00%
- Reading proficiency
- 50% ▼ -4.00%
- Median HH income
- $49,518
- Composite
- 41.49/100
- National rank
- #3458
- State rank
- #42 of 73 in FL
Livability — Cape Coral
- Score
- 77/100
- State rank
- #208
- US rank
- #3098
Category grades
Schools grade is shown separately in the Schools card above.
Census & demographics
- Census place
- Cape Coral, FL
- County
- Lee County · 788,662 people
- City population
- 217,388
- Metro
- Cape Coral-Fort Myers, FL
- Population (ZIP)
- 35,580
- Household income
- $90,577
- Rent vs Own
- Severe rent burden
- 286.0
Population outlook (Lee County) Hauer SSP2
- Today (2025)
- 871,946 people
- By 2030
- 955,468 · +9.6%
- By 2040
- 1,113,587 · +27.7%
- By 2050
- 1,256,891 · +44.1%
- By 2075
- 1,560,270 · +78.9%
- By 2100
- 1,726,848 · +98.0%
Race, ethnicity, and origin ACS 2023
- Neighborhood character
- Diverse neighborhood (Simpson 0.58)
- Race & ethnicity
- White 57% Hispanic / Latino 30% Two or more races 21% Black 7% Asian 2%
- Hispanic origin (detail)
- Mexican 2% Puerto Rican 6% Cuban 17% Dominican 1%
- Common ancestry
- Romanian 2% Hispanic 2% Lithuanian 2%
- Foreign-born
- 21% · Canada, Jamaica, China
- Languages at home
- 73% English-only · Spanish 24% French/Haitian/Cajun 1% Russian/Polish/Slavic 1%
Political lean MEDSL · Lee
- 2024 margin
- Strong R (+28.4) · D 35.5% · R 63.9%
- 2008→2024 swing
- -18.0pp toward R · 2008: -10.4pp · 2024: -28.4pp
- All cycles
- 2024: R+28.4 2020: R+19.2 2016: R+20.4 2012: R+16.6 2008: R+10.4
Not yet ingested
- Civics
- —
Market trends
- HPI YoY
- ▼ -55.34%
- Current HPI
- 337.0575
- Rent YoY
- ▼ -5.51%
- Metro
- Cape Coral-Fort Myers, FL
- State GDP YoY
- ▲ 3.28%
- F500 in state
- 36
Industry mix (Fortune 500 HQ in FL)
| Industry | F500 HQs | Revenue |
|---|---|---|
| Industrial Technology | 2 | $29B |
|
||
| Insurance | 2 | $17B |
|
||
| Retail | 1 | $60B |
|
||
| Technology Distribution | 1 | $58B |
|
||
| Homebuilding | 1 | $35B |
|
||
| Technology Manufacturing | 1 | $35B |
|
||
Price history
+1385.4% since first listed8 events — show timeline
- 2026-05-08 Price Changed $371,350 FORTMLS
- 2026-02-15 Listed $381,350 FORTMLS
- 2024-01-11 Sold (Public Records) $39,000 Public Records
- 2024-01-11 Sold (MLS) $39,000 FORTMLS
- 2023-11-13 Pending — FORTMLS
- 2023-09-18 Price Changed $39,900 FORTMLS
- 2023-06-27 Listed $42,900 FORTMLS
- 2004-09-20 Sold (Public Records) $25,000 Public Records
Property tax history
+12.5%/yrLatest (2025): $976 · +34.7% YoY. Source: county tax records.
Cash-flow waterfall
monthlySold comps — $/sqft
last 12 mo · ≤1 miLoading sold comps…