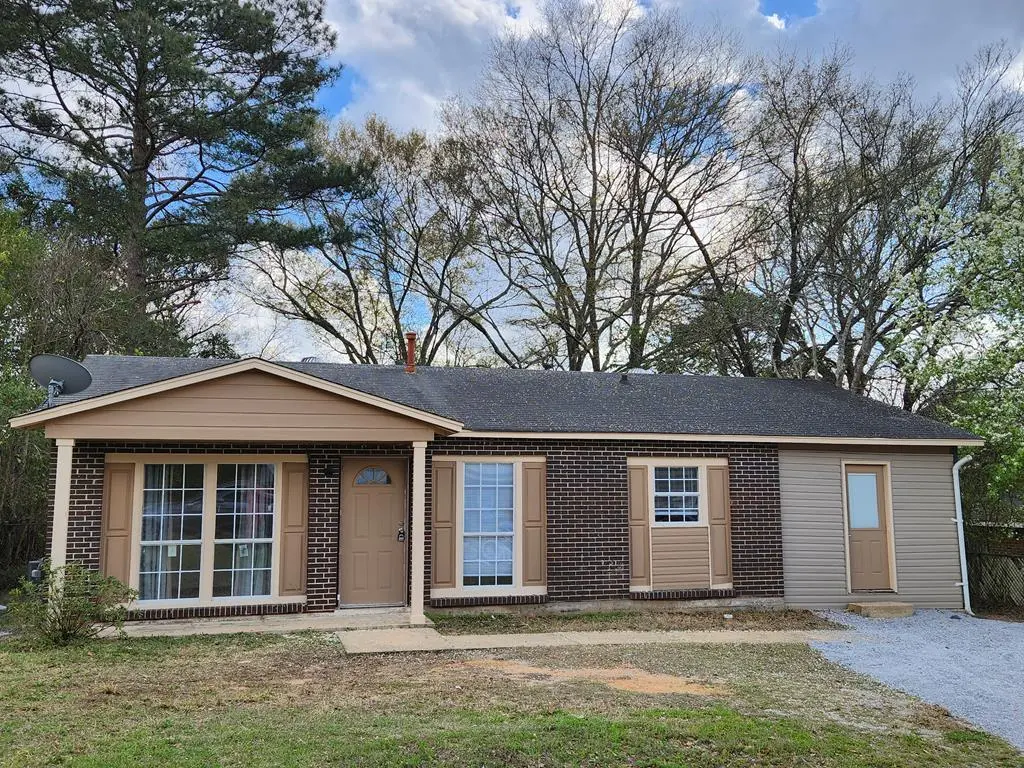
1616 Yarbrough St · Montgomery, AL
Flood risk 1/10 · Minimal
- FEMA flood zone
- X (unshaded)
- Chance of flooding over 30 yrs
- 0.0%
- Est. flood insurance / yr
- $507 – $1,088
Fire risk 3/10 · Minor
- Est. fire insurance / yr
- $916 – $1,700
Heat risk 7/10 · Major
- Hot days now (above 107°F)
- 7 days/yr
- Hot days in 30 yrs
- 20 days/yr
Wind risk 8/10 · Major
- Chance of severe wind over 30 yrs
- 80.0%
Air-quality risk 3/10 · Minor
- Unhealthy air days now
- 4 days/yr
- Unhealthy air days in 30 yrs
- 4 days/yr
Risk factors via First Street. Map © Google.
Why this score? — see what drove the C grade
The composite is a weighted blend of 9 inputs, each scored 0–100. Each bar is that input's sub-score; the figure is the points it added to the 100-point composite (weight × sub-score).
- Cash flow +26.4/30.0
- DSCR +9.0/10.0
- ARV discount +7.5/15.0
- 1% rule +6.0/10.0
- Livability +3.2/5.0
- Rent growth +2.5/5.0
- Condition / age +2.5/5.0
- Schools +1.7/10.0
- Appreciation +0.0/10.0
$99,900
🖨 Deal sheet (PDF) 📄 Offer letter ✓ Due diligence
Listing remarks
Welcome home to this beautifully renovated 4-bedroom, 1-bath home just minutes from downtown Montgomery. Features include new HVAC, an open concept layout and modern updates throughout. Luxury vinyl plank flooring flows through the home along with fresh interior paint and abundant natural light. The spacious primary bedroom offers a large closet, and the kitchen features brand new stainless steel appliances that open to the main living area. Perfect for everyday living and the large backyard makes is great for entertaining. Fresh exterior paint adds great curb appeal. Don't miss your opportunity to see everything this great home has to offer.
Key facts
- Modern updates
- New hvac
- Fresh interior paint
Tags
Property features AI
Exterior
- Parking: Other parking
- Security: Smoke detector(s)
- Utilities: Public water; Public sewer
- Home design: Single family residence; One story
- Construction: Brick and vinyl siding exterior
- Exterior features: Patio/porch (other); On waterfront
Interior
- Kitchen: Oven; Self-cleaning oven; Refrigerator
- Flooring: Vinyl
- Bathrooms: 1 full bathroom
- Interior features: Ceiling fans; Walk-in closets; Double pane windows; Window treatments; No fireplace
- Laundry & utility: Washer; Dryer
Neighborhood map
What this means for you Summary
Snapshot
- This is a 4-bed/1.0-bath single-family listed at $100k.
Deal economics
- At list price, monthly cash flow is $262 ($3k/yr) — positive.
- The deal already cash-flows at list — no discount required.
- Meets the 1% rule at list price ($1k rent vs $100k).
- Cap rate 9.4% vs local median 6.0% in Montgomery — top-decile yield for the area; either an underpriced asset or a hidden risk that comps aren't pricing in. Stress-test before assuming the spread holds.
Location & tenants
- Location reads 65/100 on livability (#138 in AL) — a middle-class / working-renter tenant base. Strengths: cost of living A+, housing A+; Watch: employment D, crime F, amenities D-.
- Montgomery County (urban): math 9% / reading 31% proficiency, ranked #106 of 129 in AL (top 82%) — low school quality limits family demand, transient renter base, plan for 1-2y turnover; 70% free/reduced lunch — lower-income household profile, screen leases tightly.
- Zoned schools: Highland Gardens Elementary School (math 2% / reading 17%, grade F, #568 of 627 statewide, top 94%, 471 students, 94% FRL); Capitol Heights Middle School (math 0% / reading 15%, grade F, #241 of 257 statewide, top 95%, 655 students, 97% FRL); Lee High School (math 2% / reading 8%, grade F, #276 of 305 statewide, top 95%, 1,374 students, 86% FRL) — zoned schools average 92% FRL vs 70% district-wide (22 pts higher); higher-poverty schools than district average — tighter screening recommended.
- Zoned-school proficiency averages 8% at this address vs 20% district-wide (-12 pts) — the specific schools serving this property underperform the Montgomery County average; the district grade overstates school quality for this exact location.
- Market conditions: 63 active listings in the ZIP; 31 comparable units currently listed for rent nearby; rentals lingering (median 45d on market — plan ~5-8 weeks vacancy on turnover, expect pricing pressure); 58% of comp listings sitting > 30 days — soft ceiling on asking rent; 460 units permitted in Montgomery County in 2024 (37 in 5+ unit buildings).
Forward outlook
- Local home prices are declining (-3.0%/yr); year-one equity from $691 of loan paydown is wiped out by about $3k of value loss. Plan a longer hold.
- Montgomery County population projected to shrink 8% by 2050 — rents likely to lag national; underwrite the cash flow, not the appreciation.
- At projected returns (-3.0% appreciation + 3.0% rent growth), your $28k cash investment doubles in ~10 years — after that, you're playing with house money.
Negotiation context
- Only 8 days on market — expect competitive offers; lowballing is unlikely to land.
- 15 sale attempts since 28y ago with the ask held roughly flat each time — persistent listings suggest the price (not the market) is what's stuck; bring a comps-based counter.
- Current owner paid $45k; list at $100k implies a 122% gain — meaningful room to come down on a strong offer.
Risks & watch-outs
- Climate carrying-cost: severe wind risk, 80% chance of damaging wind over 30y; extreme-heat days projected 7→20/yr by 2055 (HVAC capex compounding) — expect insurance premiums to compound above CPI over the hold.
Questions for the listing agent
- Built in 1965 — when were the roof, HVAC, electrical panel, plumbing, and water heater last replaced?
- Is there a deadline driving the sale (1031 exchange, divorce, estate, relocation)? That informs how much negotiation room exists.
- Crime grade is F in this area — have there been break-ins, vandalism, or insurance claims at this property in the last 3 years? What carrier currently insures it and at what premium?
- What's the average days-on-market for RENTAL listings here right now (not sales)? A rising rental-DOM trend means longer vacancies and softer asking-rent achievability than the comps imply.
- What's the recent tenant-quality profile in this submarket — average credit score on applications, eviction rate, late-payment / NSF rate, and stable-employment percentage? A property-management company in the area should have these aggregated.
- How much new for-sale + rental construction is in the pipeline within 1–3 miles? Heavy new supply typically softens prices + rents 12–24 months out; constrained supply supports both.
Investment metrics
- 1% rule
- 1.10% ✓
- Cap rate
- 9.44%
- Cash-on-cash
- 11.26%
- DSCR
- 1.50
- GRM
- 7.5
CMA / ARV
- ARV (median comp)
- $61,101
- List price
- $99,900
- Delta
- 63.50%
- Verdict
- OVERPRICED
- Comps
- 20 within 1.0 mi
Show comp detail 12 sales within ~0.75 mi
| Address | Dist | Beds/Ba | Sqft | Sold | Price | $/sf | Match |
|---|---|---|---|---|---|---|---|
| 1641 N Yarbrough Ct | 0.09mi | 3/1.0 (-1) | 1,215 (-2%) | 8mo | $75,000 | $62 | 81 |
| 3127 Texas St | 0.43mi | 3/1.0 (-1) | 1,260 (+1%) | 8mo | $70,000 | $56 | 66 |
| 3025 Baffin Dr | 0.28mi | 3/1.0 (-1) | 1,146 (-8%) | 6mo | $50,000 | $44 | 65 |
| 1833 Midway St | 0.54mi | 3/1.0 (-1) | 1,175 (-5%) | 1mo | $64,900 | $55 | 60 |
| 1805 Texas Ct | 0.44mi | 4/1.0 | 1,353 (+9%) | 5mo | $62,500 | $46 | 60 |
| 132 Amanda Ln | 0.29mi | 3/2.0 (-1) | 1,118 (-10%) | 2mo | $45,000 | $40 | 60 |
| 3216 Texas St | 0.44mi | 3/1.0 (-1) | 1,353 (+9%) | 1mo | $40,000 | $30 | 59 |
| 3452 Harris St | 0.57mi | 3/1.0 (-1) | 1,400 (+13%) | 1mo | $35,000 | $25 | 46 |
| 45 Garden St | 0.61mi | 3/1.0 (-1) | 1,365 (+10%) | 6mo | $87,000 | $64 | 45 |
| 3129 Cabot St | 0.66mi | 3/2.0 (-1) | 1,099 (-12%) | 1mo | $17,501 | $16 | 40 |
| 55 Michigan Ave | 0.74mi | 3/1.0 (-1) | 1,120 (-10%) | 6mo | $20,000 | $18 | 39 |
| 59 Michigan Ave | 0.75mi | 3/2.0 (-1) | 1,120 (-10%) | 6mo | $25,000 | $22 | 34 |
Match score weights: distance 35% · size 25% · config 20% · recency 20%. Top-matched comps best support the ARV.
Projected returns pro-forma
-3.0% appreciation · 3.0% rent growth · sell at horizon
- IRR
- 0.5%
- Equity multiple
- 1.02×
- Total profit
- $490
- Equity at exit
- $14,895
- IRR
- 10.1%
- Equity multiple
- 1.78×
- Total profit
- $21,810
- Equity at exit
- $8,638
Cash invested: $27,972 (down + closing). Projections, not guarantees.
Landlord ↔ Tenant lean methodology
- Overall (STATE)
- 90 Strongly Landlord-Friendly
- State Alabama
- 90 Strongly Landlord-Friendly · R+15
- County
- — inherits STATE
- City
- — inherits STATE
ZIP-level market 36110
- Home prices YoY
- -34.8%
- Active inventory
- 63
- Price-to-rent
- 7.5×
Monthly cashflow live
- Estimated rent
- $1,104 high interval (Pro) →
- Mortgage (P&I)
- −$524
- Tax from tax record
- −$44 /mo · $528/yr
- Insurance
- −$42
- HOA
- −$0
- Vacancy / Maint / Mgmt
- −$232
- Net cashflow
- $262
Break-even live
Sensitivity live
| Price | -10% $319 | -5% $291 | +0% $262 | +5% $234 | +10% $206 |
|---|---|---|---|---|---|
| Rent | -10% $175 | -5% $219 | +0% $262 | +5% $306 | +10% $350 |
| Rate | -1.0pp $313 | -0.5pp $288 | base $262 | +0.5pp $236 | +1.0pp $210 |
UW: 25.0% down · 7.5% · 30yr · 1.5% tax · 5.0% vac · 8.0% maint · 8.0% mgmt
Financing live
Cash to close
- Down payment
- $24,975
- Closing costs
- $2,997
- Reserves months
- —
- Total cash needed
- —
Loan-product check · same deal, 3 products live
Conventional
25% down · 7.5% · 30yr
- Down + closing
- —
- Monthly P&I
- —
- Monthly cashflow
- —
- DSCR
- —
- Eligible?
- —
Personal DTI + credit; lowest rate.
DSCR
20% down · 8.5% · 30yr
- Down + closing
- —
- Monthly P&I
- —
- Monthly cashflow
- —
- DSCR
- —
- Eligible?
- —
No personal income docs; deal must DSCR.
Hard money
10% down · 12.0% · 12mo
- Down + closing
- —
- Monthly P&I
- —
- Monthly cashflow
- —
- DSCR
- —
- Eligible?
- —
Short-term bridge; refi at stabilization.
Rent comps 31 comps
| Address | Beds | Baths | Sqft | Rent | $/sqft | DOM | Units | Dist |
|---|---|---|---|---|---|---|---|---|
| 1653 N Yarbrough Ct Montgomery, AL | 3.0 | 1.0 | 1130 | $950 | $0.84 | 22d | 1 | 0.07mi |
| 3114 Cotton St Montgomery, AL | 3.0 | 1.0 | 888 | $1,100 | $1.24 | 45d | 1 | 0.23mi |
| 3042 George B Edmondson Dr Montgomery, AL | 3.0 | 1.0 | 900 | $860 | $0.96 | 45d | 1 | 0.25mi |
| 3613 Erwin Dr Montgomery, AL | 3.0 | 2.0 | 1092 | $1,250 | $1.14 | 45d | 1 | 0.37mi |
| 3329 Texas St Montgomery, AL | 3.0 | 1.0 | 1000 | $1,100 | $1.10 | 45d | 1 | 0.41mi |
| 1817 Texas Ct Montgomery, AL | 3.0 | 1.0 | 925 | $1,050 | $1.14 | 22d | 1 | 0.46mi |
| 207 Destin St Montgomery, AL | 3.0 | 1.0 | 966 | $695 | $0.72 | 22d | 1 | 0.51mi |
| 216 Gardendale Dr Montgomery, AL | 3.0 | 1.0 | 900 | $850 | $0.94 | 22d | 1 | 0.54mi |
| 3452 Harris St Montgomery, AL | 3.0 | 1.0 | 1400 | $1,150 | $0.82 | 22d | 1 | 0.55mi |
| 204 W Park Ave Montgomery, AL | 3.0 | 1.0 | 1145 | $850 | $0.74 | 22d | 1 | 0.58mi |
| 3050 Willena Ave Montgomery, AL | 3.0 | 1.0 | 1466 | $985 | $0.67 | 22d | 1 | 0.58mi |
| 16 Garden St Montgomery, AL | 3.0 | 1.5 | 1008 | $775 | $0.77 | 46d | 1 | 0.62mi |
| 2107 Yarbrough Cir Montgomery, AL | 3.0 | 1.0 | 910 | $925 | $1.02 | 45d | 1 | 0.62mi |
| 2111 Yarbrough St Montgomery, AL | 3.0 | 1.0 | 962 | $795 | $0.83 | 45d | 1 | 0.64mi |
| 341 Chisholm St Montgomery, AL | 3.0 | 1.0 | 756 | $1,195 | $1.58 | 22d | 1 | 0.66mi |
| 3008 Cabot St Montgomery, AL | 4.0 | 2.0 | 1300 | $1,150 | $0.88 | 45d | 1 | 0.72mi |
| 2056 Midway St Montgomery, AL | 3.0 | 1.0 | 1110 | $985 | $0.89 | 45d | 1 | 0.74mi |
| 142 W Michigan Ave Montgomery, AL | 3.0 | 1.0 | 840 | $995 | $1.18 | 15d | 1 | 0.75mi |
| 2019 Amos St Montgomery, AL | 3.0 | 1.5 | 1134 | $985 | $0.87 | 45d | 1 | 0.78mi |
| 2076 Midway St Montgomery, AL | 3.0 | 1.0 | 1068 | $1,000 | $0.94 | 45d | 1 | 0.78mi |
| 3 Rotary St Montgomery, AL | 3.0 | 1.0 | 1131 | $925 | $0.82 | 22d | 1 | 0.83mi |
| 2503 Skyline Ave Montgomery, AL | 3.0 | 1.0 | 1015 | $1,150 | $1.13 | 45d | 1 | 0.85mi |
| 429 Edward St Montgomery, AL | 3.0 | 1.0 | 828 | $1,080 | $1.30 | 15d | 1 | 0.86mi |
| 2001 Speigle St Montgomery, AL | 3.0 | 1.0 | 1260 | $1,035 | $0.82 | 45d | 1 | 0.86mi |
| 412 Edward St Montgomery, AL | 3.0 | 1.0 | 828 | $800 | $0.97 | 45d | 1 | 0.88mi |
| 4029 Chelsea Dr Montgomery, AL | 3.0 | 1.0 | 1000 | $1,200 | $1.20 | 45d | 1 | 0.92mi |
| 2006 Harmon St Unit 3 Montgomery, AL | 3.0 | 1.0 | 800 | $500 | $0.62 | 45d | 1 | 1.04mi |
| 105 Dyas Ct Montgomery, AL | 3.0 | 1.0 | 1025 | $1,095 | $1.07 | 45d | 1 | 1.15mi |
| 408 Briarbrook Dr #204 Montgomery, AL | 3.0 | 2.0 | 1025 | $1,000 | $0.98 | 45d | 1 | 1.20mi |
| 408 Briarbrook Dr Montgomery, AL | 3.0 | 2.0 | 1025 | $960 | $0.94 | 22d | 1 | 1.20mi |
| 3024 Tyler Rd Montgomery, AL | 3.0 | 1.0 | 892 | $725 | $0.81 | 22d | 1 | 1.43mi |
Listing history 25 events
-
2026-05-12status Pending 650-char remark
-
2026-05-04$99,900 Active 650-char remark
-
2026-04-03price $115,000
-
2026-03-09$125,000 Active
-
2026-01-12soldstatus $45,000 Closed
-
2026-01-05soldstatus $45,000
-
2025-11-10historical Contingent
-
2025-10-06status Active
-
2025-05-22historical $750
-
2025-04-01$56,000 Active
-
2025-02-02$750
-
2025-02-02historical $695
-
2024-07-19$695
-
2024-05-30historical $695
-
2024-02-20$695
-
2023-01-23$59,000 Active
-
2022-08-11$62,900 Active
-
2020-07-13$53,000
-
2014-06-17soldstatus $46,500
-
2013-08-27soldstatus $47,900
-
2013-04-22$19,900
-
2012-04-13$58,000
-
2002-08-01$49,900
-
1999-04-15$39,900
-
1998-08-10$47,500
ⓘ Source: listings_history table (triggers on properties + properties_extension) + one-shot
backfill from property_details.listing_events for pre-trigger history.
Tax reassessment forecast AL · Resets to sale price
- Current annual tax
- $528 · $44/mo
- Projected year-2 tax
- $528 · $44/mo
- Expected delta
- $0/yr ($0/mo · 0.0%)
ⓘ Screening estimate from a state-policy table — verify with the county assessor before closing.
Climate risk First Street
- Flood 1/10 Low FEMA zone X (unshaded) · 0% chance over 30 yrs
- Wildfire 3/10 Moderate
- Heat 7/10 Severe 7 d/yr ≥107°F today · 20 d/yr by 30 yrs out
- Wind 8/10 Severe 80% chance of damaging wind over 30 yrs
- Air quality 3/10 Moderate 4 unhealthy d/yr today · 4 by 30 yrs out
Nearby sold comps map
Loading sold comps map…
Walkable amenities ~0.75 mi
Loading nearby amenities…
Taxation est. · year 1
- Rental income
- $13,243
- − Mortgage interest
- −$5,596
- − Property taxes
- −$528
- − Insurance
- −$500
- − Repairs & maintenance
- −$1,059
- − Management
- −$1,059
- − Depreciation
- −$2,906
- Taxable income
- $1,595
- Est. tax owed @ 24.0%
- −$383
- After-tax cash flow
- $2,766/yr
For passive investors: Depreciation is non-cash, so a rental often shows a tax loss while cash-flowing — sheltering income. Rental losses are passive: they offset passive income freely, and up to $25,000/yr can offset ordinary (W-2) income if you actively participate and your MAGI is under $100k (phasing out to $0 by $150k); unused losses carry forward. On sale, claimed depreciation is recaptured at up to 25%, and gains may owe capital-gains tax (a 1031 exchange can defer both). Figures are a year-1 estimate at your 24.0% rate — not tax advice; consult a CPA.
Schools (NCES district)
- District
- Montgomery County
- NCES district ID
- 0102430
- Math proficiency
- 9% ▼ -21.00%
- Reading proficiency
- 31% ▼ -1.00%
- Median HH income
- $43,902
- Composite
- 17.24/100
- National rank
- #9093
- State rank
- #106 of 129 in AL
Livability — Montgomery
- Score
- 65/100
- State rank
- #138
- US rank
- #13416
Category grades
Schools grade is shown separately in the Schools card above.
Census & demographics
- Census place
- Montgomery, AL
- County
- Montgomery County · 190,016 people
- City population
- 175,913
- Metro
- Montgomery, AL
- Population (ZIP)
- 12,102
- Household income
- $47,315
- Rent vs Own
- Severe rent burden
- 753.0
Population outlook (Montgomery County) Hauer SSP2
- Today (2025)
- 224,008 people
- By 2030
- 221,460 · -1.1%
- By 2040
- 214,179 · -4.4%
- By 2050
- 204,912 · -8.5%
- By 2075
- 177,821 · -20.6%
- By 2100
- 145,134 · -35.2%
Race, ethnicity, and origin ACS 2023
- Neighborhood character
- Predominantly Black (83%)
- Race & ethnicity
- Black 83% White 11% Two or more races 3% Asian 2% Hispanic / Latino 1%
- Common ancestry
- Hispanic 1%
- Foreign-born
- 2% · China, Canada
- Languages at home
- 96% English-only · Spanish 2% Other Asian/Pacific 1%
Political lean MEDSL · Montgomery
- 2024 margin
- Solid D (+30.7) · D 64.8% · R 34.1% · Other 1.1%
- 2008→2024 swing
- +11.5pp toward D · 2008: 19.2pp · 2024: 30.7pp
- All cycles
- 2024: D+30.7 2020: D+31.5 2016: D+26.2 2012: D+24.3 2008: D+19.2
Not yet ingested
- Civics
- —
Market trends
- HPI YoY
- ▼ -35.37%
- Current HPI
- 66.3114
- Rent YoY
- —
- Metro
- Montgomery, AL
- State GDP YoY
- ▲ 2.94%
- F500 in state
- 4
Industry mix (Fortune 500 HQ in AL)
| Industry | F500 HQs | Revenue |
|---|---|---|
| Financial Services | 1 | $8B |
|
||
| Healthcare | 1 | $5B |
|
||
Price history
+110.3% since first listed25 events — show timeline
- 2026-05-12 Pending — SAMLS
- 2026-05-04 Listed $99,900 SAMLS
- 2026-04-03 Price Changed $115,000 SAMLS
- 2026-03-09 Listed $125,000 SAMLS
- 2026-01-12 Sold (MLS) $45,000 MAAR
- 2026-01-05 Sold (Public Records) $45,000 Public Records
- 2025-11-10 Contingent — MAAR
- 2025-10-06 Relisted — MAAR
- 2025-05-22 Rental Removed $750 PROPERTYWARE
- 2025-04-01 Listed $56,000 MAAR
- 2025-02-02 Listed for Rent $750 PROPERTYWARE
- 2025-02-02 Rental Removed $695 MAAR
- 2024-07-19 Listed for Rent $695 MAAR
- 2024-05-30 Rental Removed $695 MAAR
- 2024-02-20 Listed for Rent $695 MAAR
- 2023-01-23 Listed $59,000 MAAR
- 2022-08-11 Listed $62,900 MAAR
- 2020-07-13 Listed $53,000 MAAR
- 2014-06-17 Sold (Public Records) $46,500 Public Records
- 2013-08-27 Sold (Public Records) $47,900 Public Records
- 2013-04-22 Listed $19,900 MAAR
- 2012-04-13 Listed $58,000 MAAR
- 2002-08-01 Listed $49,900 MAAR
- 1999-04-15 Listed $39,900 MAAR
- 1998-08-10 Listed $47,500 MAAR
Property tax history
+2.8%/yrLatest (2025): $528 · +1.5% YoY. Source: county tax records.
Cash-flow waterfall
monthlySold comps — $/sqft
last 12 mo · ≤1 miLoading sold comps…