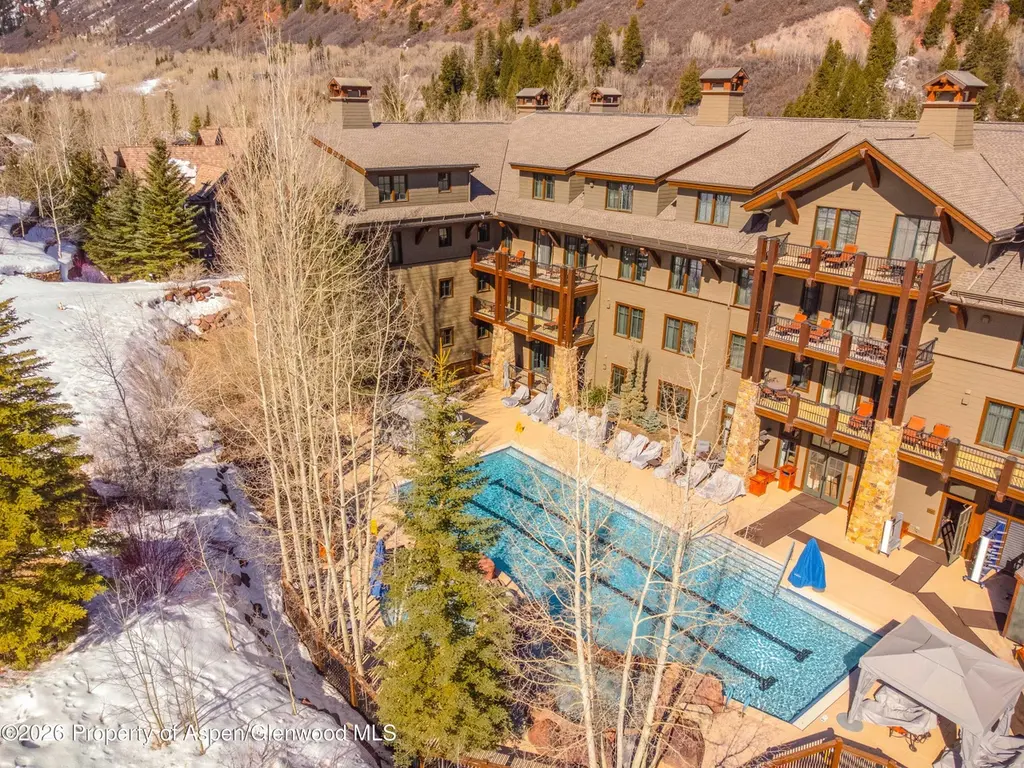
0075 Prospector Rd Unit 8401-11 · Aspen, CO
Flood risk 1/10 · Minimal
- FEMA flood zone
- X (unshaded)
- Chance of flooding over 30 yrs
- 0.0%
- Est. flood insurance / yr
- $473 – $860
Fire risk 4/10 · Minor
- Est. fire insurance / yr
- $939 – $1,743
Heat risk 1/10 · Minimal
- Hot days now (above 78°F)
- 8 days/yr
- Hot days in 30 yrs
- 20 days/yr
Wind risk 1/10 · Minimal
- Chance of severe wind over 30 yrs
- —
Air-quality risk 3/10 · Minor
- Unhealthy air days now
- 2 days/yr
- Unhealthy air days in 30 yrs
- 3 days/yr
Risk factors via First Street. Map © Google.
Why this score? — see what drove the C grade
The composite is a weighted blend of 9 inputs, each scored 0–100. Each bar is that input's sub-score; the figure is the points it added to the 100-point composite (weight × sub-score).
- Cash flow +15.0/30.0
- Appreciation +10.0/10.0
- ARV discount +7.5/15.0
- 1% rule +5.0/10.0
- DSCR +5.0/10.0
- Rent growth +5.0/5.0
- Schools +4.1/10.0
- Livability +3.3/5.0
- Condition / age +2.5/5.0
$75,000
🖨 Deal sheet 📄 Offer letter ✓ Due diligence
Listing remarks MLS
Rare topfloor slopeside 2 bedroom with deck over the pool in Elkhorn Lodge 2 summer weeks 1 winter week 1 float week calendar in Docs
Key facts
- Top floor slopeside
- Deck over the pool
- $1,969 HOA
Tags
Neighborhood map
What this means for you Summary
Snapshot
- This is a 2-bed/2.5-bath timeshare listed at $75k.
Deal economics
- At list price, monthly cash flow is $4k ($46k/yr) — positive.
- The deal already cash-flows at list — no discount required.
- Meets the 1% rule at list price ($8k rent vs $75k).
- Recommended offer: $70k (6.0% below list) — sets the bar for market timing.
Location & tenants
- Location reads 66/100 on livability (#142 in CO) — a middle-class / working-renter tenant base. Strengths: commute A+, employment A+, schools B+; Watch: amenities F, cost of living F, health & safety F.
- Aspen School District No. 1 In The County Of Pitkin And Sta (rural): math 36% / reading 56% proficiency, ranked #18 of 86 in CO (top 21%) — families likely to look elsewhere, expect single-tenant / working-renter base with shorter leases; only 4% free/reduced lunch — higher-income household profile.
- Market conditions: Rents rising fast (+22.1%/yr); 324 active listings in the ZIP; solid renter incomes; 145 units permitted in Pitkin County in 2024 (89 in 5+ unit buildings).
- At $7,993/mo this rent would consume 116% of the median local household income ($83k/yr) (locally 566% of renters already pay >50% of income on rent) — very limited rent-growth headroom before tenants either downsize or default.
Forward outlook
- In year one you build about $8k of equity ($519 loan paydown + $8k appreciation (10.0% local appreciation)).
- Pitkin County population projected at +20% by 2050 — long-run rental-demand tailwind backs the buy-and-hold thesis.
- At projected returns (10.0% appreciation + 8.0% rent growth), your $21k cash investment doubles in ~1 year — after that, you're playing with house money.
- By year 5, paydown + projected appreciation supports a ~$37k cash-out refi (75% LTV) — recoverable capital for the next deal without selling this one.
Negotiation context
- It's been on market 76 days — a 6% lower offer ($70k) is reasonable based on typical stale-listing flexibility.
Risks & watch-outs
- Watch-outs: HOA is 25% of rent.
Questions for the listing agent
- It's been on market 76 days. Have you received any prior offers? Is the seller open to a 6% concession, seller financing, or rate buy-down credit?
- What does the HOA fee cover, when was the last increase, and are there any pending special assessments or reserve-fund shortfalls?
- Why hasn't it sold? Are there any deal-killer items the seller is aware of (foundation, flood, title, zoning, code violations)?
- Is there a deadline driving the sale (1031 exchange, divorce, estate, relocation)? That informs how much negotiation room exists.
- Schools are B-rated — typically a magnet for longer-tenancy family renters. What's the average tenant stay here, and is there a school-zone premium baked into asking?
- What's the average days-on-market for RENTAL listings here right now (not sales)? A rising rental-DOM trend means longer vacancies and softer asking-rent achievability than the comps imply.
- What's the recent tenant-quality profile in this submarket — average credit score on applications, eviction rate, late-payment / NSF rate, and stable-employment percentage? A property-management company in the area should have these aggregated.
- How much new for-sale + rental construction is in the pipeline within 1–3 miles? Heavy new supply typically softens prices + rents 12–24 months out; constrained supply supports both.
Investment metrics
- 1% rule
- 10.66% ✓
- Cap rate
- 67.53%
- Cash-on-cash
- 218.69%
- DSCR
- 10.73
- GRM
- 0.8
CMA / ARV
- ARV (median comp)
- $74,962
- List price
- $75,000
- Delta
- 0.05%
- Verdict
- FAIR
- Comps
- 20 within 1.0 mi
Projected returns pro-forma
10.0% appreciation · 8.0% rent growth · sell at horizon
- IRR
- —
- Equity multiple
- 16.63×
- Total profit
- $328,167
- Equity at exit
- $67,566
- IRR
- —
- Equity multiple
- 43.00×
- Total profit
- $882,006
- Equity at exit
- $145,709
Cash invested: $21,000 (down + closing). Projections, not guarantees.
Landlord ↔ Tenant lean methodology
- Overall (STATE)
- 38 Tenant-Leaning
- State Colorado
- 38 Tenant-Leaning · D+4
- County
- — inherits STATE
- City
- — inherits STATE
ZIP-level market 81611
- Home prices YoY
- 3.6%
- Rents YoY
- 22.1%
- Active inventory
- 324
- Price-to-rent
- 0.8×
Monthly cashflow live
- Estimated rent
- $7,993 medium interval (Pro) →
- Mortgage (P&I)
- −$393
- Tax est. 1.5%
- −$94 /mo · $1,125/yr
- Insurance
- −$31
- HOA
- −$1,969
- Vacancy / Maint / Mgmt
- −$1,679
- Net cashflow
- $3,827
Break-even live
UW: 25.0% down · 7.5% · 30yr · 1.5% tax · 5.0% vac · 8.0% maint · 8.0% mgmt
Financing live
Cash to close
- Down payment
- $18,750
- Closing costs
- $2,250
- Reserves months
- —
- Total cash needed
- —
Loan-product check · same deal, 3 products live
Conventional
25% down · 7.5% · 30yr
- Down + closing
- —
- Monthly P&I
- —
- Monthly cashflow
- —
- DSCR
- —
- Eligible?
- —
Personal DTI + credit; lowest rate.
DSCR
20% down · 8.5% · 30yr
- Down + closing
- —
- Monthly P&I
- —
- Monthly cashflow
- —
- DSCR
- —
- Eligible?
- —
No personal income docs; deal must DSCR.
Hard money
10% down · 12.0% · 12mo
- Down + closing
- —
- Monthly P&I
- —
- Monthly cashflow
- —
- DSCR
- —
- Eligible?
- —
Short-term bridge; refi at stabilization.
HOA detail
- Monthly dues
- $1,969 · $23,628/yr
- Likely covers
- pool
Listing history 16 events
-
2026-06-19days on market $75,000 Active 76 DOM
-
2026-06-18days on market $75,000 Active 75 DOM
-
2026-06-17days on market $75,000 Active 74 DOM
-
2026-06-16days on market $75,000 Active 73 DOM
-
2026-06-15days on market $75,000 Active 72 DOM
-
2026-06-14days on market $75,000 Active 70 DOM
-
2026-06-12days on market $75,000 Active 69 DOM
-
2026-06-09days on market $75,000 Active 66 DOM
-
2026-06-08days on market $75,000 Active 65 DOM
-
2026-06-07days on market $75,000 Active 64 DOM
-
2026-06-05days on market $75,000 Active 61 DOM
-
2026-06-02days on market $75,000 Active 59 DOM
-
2026-06-01days on market $75,000 Active 58 DOM
-
2026-05-31days on market $75,000 Active 57 DOM
-
2026-05-30days on market $75,000 Active 56 DOM
-
2026-04-02$75,000 Active 138-char remark
Show marketing remark (138 chars)
Rare topfloor slopeside 2 bedroom with deck over the pool in Elkhorn Lodge 2 summer weeks 1 winter week 1 float week calendar in Docs
ⓘ Source: listings_history table (triggers on properties + properties_extension) + one-shot
backfill from property_details.listing_events for pre-trigger history.
Climate risk First Street
- Flood 1/10 Low FEMA zone X (unshaded) · 0% chance over 30 yrs
- Wildfire 4/10 Moderate
- Heat 1/10 Low 8 d/yr ≥78°F today · 20 d/yr by 30 yrs out
- Wind 1/10 Low
- Air quality 3/10 Moderate 2 unhealthy d/yr today · 3 by 30 yrs out
Nearby sold comps map
Loading sold comps map…
Walkable amenities ~0.75 mi
Loading nearby amenities…
Taxation est. · year 1
- Rental income
- $95,915
- − Mortgage interest
- −$4,201
- − Property taxes
- −$1,125
- − Insurance
- −$375
- − Repairs & maintenance
- −$7,673
- − Management
- −$7,673
- − HOA
- −$23,628
- − Depreciation
- −$2,182
- Taxable income
- $49,057
- Est. tax owed @ 24.0%
- −$11,774
- After-tax cash flow
- $34,151/yr
For passive investors: Depreciation is non-cash, so a rental often shows a tax loss while cash-flowing — sheltering income. Rental losses are passive: they offset passive income freely, and up to $25,000/yr can offset ordinary (W-2) income if you actively participate and your MAGI is under $100k (phasing out to $0 by $150k); unused losses carry forward. On sale, claimed depreciation is recaptured at up to 25%, and gains may owe capital-gains tax (a 1031 exchange can defer both). Figures are a year-1 estimate at your 24.0% rate — not tax advice; consult a CPA.
Schools (NCES district)
- District
- Aspen School District No. 1 In The County Of Pitkin And Sta
- NCES district ID
- 0802280
- Math proficiency
- 36% ▼ -5.00%
- Reading proficiency
- 56% ▼ -3.00%
- Median HH income
- $66,694
- Composite
- 40.98/100
- National rank
- #3595
- State rank
- #18 of 86 in CO
Livability — Aspen
- Score
- 66/100
- State rank
- #142
- US rank
- #11780
Category grades
Schools grade is shown separately in the Schools card above.
Census & demographics
- Census place
- Aspen, CO
- County
- Pitkin County · 9,068 people
- City population
- 9,068
- Metro
- Glenwood Springs, CO
- Population (ZIP)
- 9,068
- Household income
- $82,664
- Rent vs Own
- Severe rent burden
- 566.0
Population outlook (Pitkin County) Hauer SSP2
- Today (2025)
- 20,121 people
- By 2030
- 21,110 · +4.9%
- By 2040
- 22,707 · +12.9%
- By 2050
- 24,105 · +19.8%
- By 2075
- 27,933 · +38.8%
- By 2100
- 30,018 · +49.2%
Race, ethnicity, and origin ACS 2023
- Neighborhood character
- Predominantly White (81%)
- Race & ethnicity
- White 81% Hispanic / Latino 10% Two or more races 7% Asian 4%
- Hispanic origin (detail)
- Mexican 4% Salvadoran 4%
- Common ancestry
- Slovak 3% Iranian 3% Romanian 3%
- Foreign-born
- 15% · Canada, Dominican Republic, China
- Languages at home
- 82% English-only · Spanish 9% Other Indo-European 2% Chinese 2%
Political lean MEDSL · Pitkin
- 2024 margin
- Solid D (+44.2) · D 71.0% · R 26.8% · Other 2.2%
- 2008→2024 swing
- -4.6pp toward R · 2008: 48.8pp · 2024: 44.2pp
- All cycles
- 2024: D+44.2 2020: D+51.9 2016: D+45.4 2012: D+37.9 2008: D+48.8
Not yet ingested
- Civics
- —
Market trends
- HPI YoY
- ▲ 12.97%
- Current HPI
- 370.9593
- Rent YoY
- ▲ 22.07%
- Metro
- Glenwood Springs, CO
- State GDP YoY
- ▲ 1.95%
- F500 in state
- 14
Industry mix (Fortune 500 HQ in CO)
| Industry | F500 HQs | Revenue |
|---|---|---|
| Technology Distribution | 1 | $31B |
|
||
| Food / Agriculture | 1 | $18B |
|
||
| Packaging | 1 | $14B |
|
||
| Healthcare | 1 | $13B |
|
||
| Energy | 1 | $10B |
|
||
| Technology | 1 | $4B |
|
||
Price history
1 event — show timeline
- 2026-04-02 Listed $75,000 AGMLS
Cash-flow waterfall
monthlySold comps — $/sqft
last 12 mo · ≤1 miLoading sold comps…