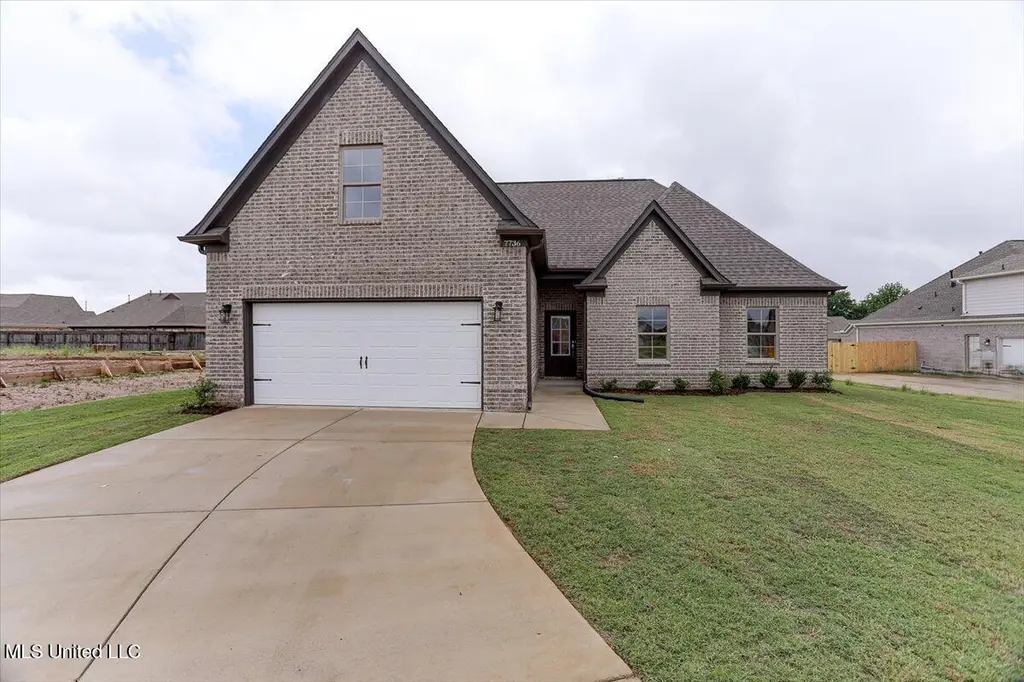
7736 Carmel Cv · Lynchburg, MS
Flood risk 1/10 · Minimal
- FEMA flood zone
- X (unshaded)
- Chance of flooding over 30 yrs
- 0.0%
- Est. flood insurance / yr
- $507 – $1,088
Fire risk 5/10 · Moderate
- Est. fire insurance / yr
- $1,241 – $2,305
Heat risk 6/10 · Moderate
- Hot days now (above 109°F)
- 7 days/yr
- Hot days in 30 yrs
- 21 days/yr
Wind risk 4/10 · Minor
- Chance of severe wind over 30 yrs
- 22.0%
Air-quality risk 2/10 · Minimal
- Unhealthy air days now
- 2 days/yr
- Unhealthy air days in 30 yrs
- 2 days/yr
Risk factors via First Street. Map © Google.
Why this score? — see what drove the D- grade
The composite is a weighted blend of 9 inputs, each scored 0–100. Each bar is that input's sub-score; the figure is the points it added to the 100-point composite (weight × sub-score).
- Appreciation +10.0/10.0
- ARV discount +7.5/15.0
- Cash flow +6.2/30.0
- Schools +4.0/10.0
- Livability +3.2/5.0
- Rent growth +2.5/5.0
- Condition / age +2.5/5.0
- 1% rule +1.6/10.0
- DSCR +0.5/10.0
$306,900
🖨 Deal sheet (PDF) 📄 Offer letter ✓ Due diligence
Listing remarks MLS
Seller is offering 3% in concessions to be used how the buyer wishes for closing costs, pre-paids, buydowns and or upgrades. Located in Ranch Meadows Subdivision, this well laid out 1,802 sq. ft. home offers 4 bedrooms and 2 bathrooms with a low-maintenance brick exterior. The interior features wood and tile flooring with carpet in the bedrooms and raised ceilings in the family room, highlighted by a fireplace and ceiling fan. The kitchen is designed for both function and style with quartz countertops, a serving bar with pendant lighting, built-in appliances, and recessed lighting. The dining area features a double windows for added natural light. The primary suite includes tile shower surrounds, a whirlpool tub, and a spacious walk-in closet. Additional bedrooms creating a split floor plan also offer walk-in closets, providing ample storage throughout the home. Upstairs is multi-purpose room that could serve as a bedroom or a game room. There is a rear covered patio overlooking the sodded yard. This property qualifies for USDA / Rural housing loans.
Key facts
- Raised ceilings
- Quartz countertops
- Ceiling fan
Tags
Neighborhood map
What this means for you Summary
Snapshot
- This is a 4-bed/2.0-bath other listed at $307k.
Deal economics
- At list price, monthly cash flow is $-558 ($-7k/yr) — negative.
- To cash-flow at today's rent, offer at most $226k (26.3% below list).
- To meet the 1% rule (rent ≥ 1% of price), the offer needs to be $201k (34.3% below list).
- Recommended offer: $201k (34.3% below list) — sets the bar for 1% rule.
Location & tenants
- Location reads 63/100 on livability (#145 in MS) — a middle-class / working-renter tenant base. Strengths: crime A+, cost of living A+, housing A+; Watch: schools F, amenities F, commute F.
- Desoto County School District (suburban): math 48% / reading 42% proficiency, ranked #20 of 130 in MS (top 15%) — families likely to look elsewhere, expect single-tenant / working-renter base with shorter leases.
- Market conditions: 51 active listings in the ZIP; 14 comparable units currently listed for rent nearby; rentals at typical pace (median 21d on market — plan ~3-4 weeks tenant-placement turnaround); 1,155 units permitted in DeSoto County in 2024 (0 in 5+ unit buildings).
- This rent runs 41% of the median local income ($60k/yr) — at the standard rent-burdened threshold; future hikes will face affordability resistance.
Forward outlook
- In year one you build about $33k of equity ($2k loan paydown + $31k appreciation (10.0% local appreciation)).
- DeSoto County population projected at +33% by 2050 — long-run rental-demand tailwind backs the buy-and-hold thesis.
- By year 2, paydown + projected appreciation supports a ~$53k cash-out refi (75% LTV) — recoverable capital for the next deal without selling this one.
Negotiation context
- It's been on market 108 days — a 9% lower offer ($279k) is reasonable based on typical stale-listing flexibility.
- 4 sale attempts since 4y ago with the ask held roughly flat each time — persistent listings suggest the price (not the market) is what's stuck; bring a comps-based counter.
Risks & watch-outs
- Climate carrying-cost: moderate wildfire risk; extreme-heat days projected 7→21/yr by 2055 (HVAC capex compounding) — expect insurance premiums to compound above CPI over the hold.
Questions for the listing agent
- What do current leases actually rent for vs. the listed asking? Can we see a recent rent roll and the last 12 months of T-12 income?
- It's been on market 108 days. Have you received any prior offers? Is the seller open to a 34% concession, seller financing, or rate buy-down credit?
- What does the HOA fee cover, when was the last increase, and are there any pending special assessments or reserve-fund shortfalls?
- Why hasn't it sold? Are there any deal-killer items the seller is aware of (foundation, flood, title, zoning, code violations)?
- Is there a deadline driving the sale (1031 exchange, divorce, estate, relocation)? That informs how much negotiation room exists.
- Schools are F-rated, which usually means shorter tenancies and higher turnover. Who's the typical renter profile here, and what's been the actual vacancy rate?
- The area grade is low — what's the realistic commute time and amenity access for the typical tenant pool here? Any planned neighborhood developments (good or bad) we should know about?
- What's the average days-on-market for RENTAL listings here right now (not sales)? A rising rental-DOM trend means longer vacancies and softer asking-rent achievability than the comps imply.
- What's the recent tenant-quality profile in this submarket — average credit score on applications, eviction rate, late-payment / NSF rate, and stable-employment percentage? A property-management company in the area should have these aggregated.
- How much new for-sale + rental construction is in the pipeline within 1–3 miles? Heavy new supply typically softens prices + rents 12–24 months out; constrained supply supports both.
Investment metrics
- 1% rule
- 0.66% ✗
- Cap rate
- 4.11%
- Cash-on-cash
- -7.79%
- DSCR
- 0.65
- GRM
- 12.7
CMA / ARV
No comps found within radius.
Projected returns pro-forma
10.0% appreciation · 3.0% rent growth · sell at horizon
- IRR
- 18.8%
- Equity multiple
- 2.53×
- Total profit
- $131,643
- Equity at exit
- $276,480
- IRR
- 17.4%
- Equity multiple
- 5.84×
- Total profit
- $415,721
- Equity at exit
- $596,239
Cash invested: $85,932 (down + closing). Projections, not guarantees.
Landlord ↔ Tenant lean methodology
- Overall (STATE)
- 90 Strongly Landlord-Friendly
- State Mississippi
- 90 Strongly Landlord-Friendly · R+11
- County
- — inherits STATE
- City
- — inherits STATE
ZIP-level market 38680
- Home prices YoY
- 4.6%
- Active inventory
- 51
- Price-to-rent
- 12.7×
Monthly cashflow live
- Estimated rent
- $2,015 high interval (Pro) →
- Mortgage (P&I)
- −$1,609
- Tax est. 1.5%
- −$384 /mo · $4,604/yr
- Insurance
- −$128
- HOA
- −$29
- Vacancy / Maint / Mgmt
- −$423
- Net cashflow
- $-558
Break-even live
Sensitivity live
| Price | -10% $-346 | -5% $-452 | +0% $-558 | +5% $-664 | +10% $-770 |
|---|---|---|---|---|---|
| Rent | -10% $-717 | -5% $-638 | +0% $-558 | +5% $-479 | +10% $-399 |
| Rate | -1.0pp $-404 | -0.5pp $-480 | base $-558 | +0.5pp $-638 | +1.0pp $-719 |
UW: 25.0% down · 7.5% · 30yr · 1.5% tax · 5.0% vac · 8.0% maint · 8.0% mgmt
Financing live
Cash to close
- Down payment
- $76,725
- Closing costs
- $9,207
- Reserves months
- —
- Total cash needed
- —
Loan-product check · same deal, 3 products live
Conventional
25% down · 7.5% · 30yr
- Down + closing
- —
- Monthly P&I
- —
- Monthly cashflow
- —
- DSCR
- —
- Eligible?
- —
Personal DTI + credit; lowest rate.
DSCR
20% down · 8.5% · 30yr
- Down + closing
- —
- Monthly P&I
- —
- Monthly cashflow
- —
- DSCR
- —
- Eligible?
- —
No personal income docs; deal must DSCR.
Hard money
10% down · 12.0% · 12mo
- Down + closing
- —
- Monthly P&I
- —
- Monthly cashflow
- —
- DSCR
- —
- Eligible?
- —
Short-term bridge; refi at stabilization.
Rent comps 14 comps
| Address | Beds | Baths | Sqft | Rent | $/sqft | DOM | Units | Dist |
|---|---|---|---|---|---|---|---|---|
| 7601 Broken Hickory Dr Walls, MS | 4.0 | 3.0 | 2176 | $1,811 | $0.83 | 44d | 1 | 0.16mi |
| 7787 Bailee Ln Walls, MS | 4.0 | 2.0 | 1700 | $2,000 | $1.18 | 44d | 1 | 0.42mi |
| 6205 Liberty Estates Dr Walls, MS | 3.0 | 2.0 | 1357 | $1,555 | $1.15 | 5d | 1 | 0.43mi |
| 6916 Fox Briar Cv Walls, MS | 3.0 | 2.0 | 1350 | $1,600 | $1.19 | 5d | 1 | 0.56mi |
| 6757 River Birch Rd Walls, MS | 3.0 | 2.0 | 1331 | $1,720 | $1.29 | 12d | 1 | 0.63mi |
| 6915 Black Thorn Dr Walls, MS | 4.0 | 2.0 | 1382 | $1,655 | $1.20 | 5d | 1 | 0.64mi |
| 7051 Lake Forest Dr N Walls, MS | 3.0 | 2.0 | 1551 | $1,595 | $1.03 | 44d | 1 | 0.71mi |
| 7782 Emeline Dr Horn Lake, MS | 4.0 | 2.5 | 1808 | $2,265 | $1.25 | 44d | 1 | 0.72mi |
| 5968 Shannon Dr Horn Lake, MS | 3.0 | 2.0 | 1374 | $1,650 | $1.20 | 21d | 1 | 0.73mi |
| 5859 Shannon Dr Horn Lake, MS | 3.0 | 2.0 | 1139 | $1,523 | $1.34 | 44d | 1 | 0.83mi |
| 5565 Chapel Hill Dr Horn Lake, MS | 3.0 | 2.0 | 1114 | $1,543 | $1.39 | 2d | 1 | 1.07mi |
| 6670 Tangleberry Cv Walls, MS | 3.0 | 2.0 | 1600 | $1,770 | $1.11 | 21d | 1 | 1.14mi |
| 7089 Willow Point Dr Horn Lake, MS | 3.0 | 2.0 | 1900 | $1,895 | $1.00 | 17d | 1 | 1.20mi |
| 5331 Greenwood Rd Horn Lake, MS | 4.0 | 2.0 | 1774 | $1,970 | $1.11 | 12d | 1 | 1.25mi |
HOA detail
- Monthly dues
- $29 · $348/yr
- Likely covers
- pool
Listing history 10 events
-
2026-04-03price $306,900 1069-char remark
Show marketing remark (1069 chars)
Seller is offering 3% in concessions to be used how the buyer wishes for closing costs, pre-paids, buydowns and or upgrades. Located in Ranch Meadows Subdivision, this well laid out 1,802 sq. ft. home offers 4 bedrooms and 2 bathrooms with a low-maintenance brick exterior. The interior features wood and tile flooring with carpet in the bedrooms and raised ceilings in the family room, highlighted by a fireplace and ceiling fan. The kitchen is designed for both function and style with quartz countertops, a serving bar with pendant lighting, built-in appliances, and recessed lighting. The dining area features a double windows for added natural light. The primary suite includes tile shower surrounds, a whirlpool tub, and a spacious walk-in closet. Additional bedrooms creating a split floor plan also offer walk-in closets, providing ample storage throughout the home. Upstairs is multi-purpose room that could serve as a bedroom or a game room. There is a rear covered patio overlooking the sodded yard. This property qualifies for USDA / Rural housing loans.
-
2026-02-01$309,900 Active 1069-char remark
Show marketing remark (1069 chars)
Seller is offering 3% in concessions to be used how the buyer wishes for closing costs, pre-paids, buydowns and or upgrades. Located in Ranch Meadows Subdivision, this well laid out 1,802 sq. ft. home offers 4 bedrooms and 2 bathrooms with a low-maintenance brick exterior. The interior features wood and tile flooring with carpet in the bedrooms and raised ceilings in the family room, highlighted by a fireplace and ceiling fan. The kitchen is designed for both function and style with quartz countertops, a serving bar with pendant lighting, built-in appliances, and recessed lighting. The dining area features a double windows for added natural light. The primary suite includes tile shower surrounds, a whirlpool tub, and a spacious walk-in closet. Additional bedrooms creating a split floor plan also offer walk-in closets, providing ample storage throughout the home. Upstairs is multi-purpose room that could serve as a bedroom or a game room. There is a rear covered patio overlooking the sodded yard. This property qualifies for USDA / Rural housing loans.
-
2026-01-30historical
-
2025-10-20status Active
-
2025-10-18historical
-
2025-04-18$317,000 Active
-
2023-06-13historical
-
2023-01-10price $310,000
-
2022-11-28price $309,900
-
2022-08-30$306,900 Active
ⓘ Source: listings_history table (triggers on properties + properties_extension) + one-shot
backfill from property_details.listing_events for pre-trigger history.
Climate risk First Street
- Flood 1/10 Low FEMA zone X (unshaded) · 0% chance over 30 yrs
- Wildfire 5/10 Major
- Heat 6/10 Major 7 d/yr ≥109°F today · 21 d/yr by 30 yrs out
- Wind 4/10 Moderate 22% chance of damaging wind over 30 yrs
- Air quality 2/10 Low 2 unhealthy d/yr today · 2 by 30 yrs out
Nearby sold comps map
Loading sold comps map…
Walkable amenities ~0.75 mi
Loading nearby amenities…
Taxation est. · year 1
- Rental income
- $24,178
- − Mortgage interest
- −$17,191
- − Property taxes
- −$4,604
- − Insurance
- −$1,534
- − Repairs & maintenance
- −$1,934
- − Management
- −$1,934
- − HOA
- −$348
- − Depreciation
- −$8,928
- Taxable loss
- −$12,295
- Est. tax savings @ 24.0%
- +$2,951
- After-tax cash flow
- $-3,747/yr
For passive investors: Depreciation is non-cash, so a rental often shows a tax loss while cash-flowing — sheltering income. Rental losses are passive: they offset passive income freely, and up to $25,000/yr can offset ordinary (W-2) income if you actively participate and your MAGI is under $100k (phasing out to $0 by $150k); unused losses carry forward. On sale, claimed depreciation is recaptured at up to 25%, and gains may owe capital-gains tax (a 1031 exchange can defer both). Figures are a year-1 estimate at your 24.0% rate — not tax advice; consult a CPA.
Schools (NCES district)
- District
- Desoto County School District
- NCES district ID
- 2801320
- Math proficiency
- 48% ▼ -13.00%
- Reading proficiency
- 42% ▼ -6.00%
- Median HH income
- $59,272
- Composite
- 39.56/100
- National rank
- #3933
- State rank
- #20 of 130 in MS
Livability — Lynchburg
- Score
- 63/100
- State rank
- #145
- US rank
- #14967
Category grades
Schools grade is shown separately in the Schools card above.
Census & demographics
- Census place
- Lynchburg, MS
- County
- DeSoto County · 176,513 people
- Metro
- Memphis, TN-MS-AR
- Population (ZIP)
- 6,839
- Household income
- $59,503
- Rent vs Own
- Severe rent burden
- 229.0
Population outlook (DeSoto County) Hauer SSP2
- Today (2025)
- 203,338 people
- By 2030
- 217,692 · +7.1%
- By 2040
- 245,320 · +20.6%
- By 2050
- 270,133 · +32.8%
- By 2075
- 323,341 · +59.0%
- By 2100
- 348,742 · +71.5%
Race, ethnicity, and origin ACS 2023
- Neighborhood character
- Diverse neighborhood (Simpson 0.60)
- Race & ethnicity
- Black 46% White 42% Hispanic / Latino 8% Two or more races 3% Native American 1% Asian 1%
- Hispanic origin (detail)
- Mexican 6%
- Common ancestry
- Romanian 1% Serbian 1% British 1%
- Foreign-born
- 4% · Canada
- Languages at home
- 93% English-only · Spanish 6%
Political lean MEDSL · DeSoto
- 2024 margin
- Strong R (+24.1) · D 36.7% · R 60.8% · Other 2.5%
- 2008→2024 swing
- +14.2pp toward D · 2008: -38.2pp · 2024: -24.1pp
- All cycles
- 2024: R+24.1 2020: R+23.9 2016: R+34.8 2012: R+33.5 2008: R+38.2
Not yet ingested
- Civics
- —
Market trends
- HPI YoY
- ▲ 10.29%
- Current HPI
- 232.28
- Rent YoY
- —
- Metro
- Memphis, TN-MS-AR
- State GDP YoY
- —
- F500 in state
- 0
Price history
+0.0% since first listed10 events — show timeline
- 2026-04-03 Price Changed $306,900 MLSU
- 2026-02-01 Listed $309,900 MLSU
- 2026-01-30 Listing Removed — MLSU
- 2025-10-20 Relisted — MLSU
- 2025-10-18 Listing Removed — MLSU
- 2025-04-18 Listed $317,000 MLSU
- 2023-06-13 Listing Removed — MLSU
- 2023-01-10 Price Changed $310,000 MLSU
- 2022-11-28 Price Changed $309,900 MLSU
- 2022-08-30 Listed $306,900 MLSU
Property tax history
-16.1%/yrLatest (2025): $290 · -16.1% YoY. Source: county tax records.
Cash-flow waterfall
monthlySold comps — $/sqft
last 12 mo · ≤1 miLoading sold comps…