 Triplex
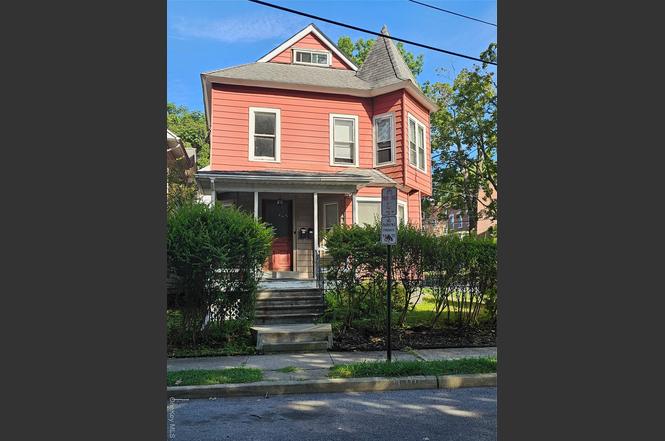
25 Carroll St #25 · Poughkeepsie, NY
Flood risk 1/10 · Minimal
- FEMA flood zone
- X (unshaded)
- Chance of flooding over 30 yrs
- 0.0%
- Est. flood insurance / yr
- $473 – $860
Fire risk 3/10 · Minor
- Est. fire insurance / yr
- $691 – $1,283
Heat risk 5/10 · Moderate
- Hot days now (above 99°F)
- 7 days/yr
- Hot days in 30 yrs
- 15 days/yr
Wind risk 4/10 · Minor
- Chance of severe wind over 30 yrs
- 11.0%
Air-quality risk 2/10 · Minimal
- Unhealthy air days now
- 1 days/yr
- Unhealthy air days in 30 yrs
- 3 days/yr
Risk factors via First Street. Map © Google.
Why this score? — see what drove the D+ grade
The composite is a weighted blend of 9 inputs, each scored 0–100. Each bar is that input's sub-score; the figure is the points it added to the 100-point composite (weight × sub-score).
- Cash flow +21.2/30.0
- DSCR +6.8/10.0
- 1% rule +5.6/10.0
- Livability +3.9/5.0
- Rent growth +3.4/5.0
- Schools +3.0/10.0
- Condition / age +2.5/5.0
- ARV discount +0.1/15.0
- Appreciation +0.0/10.0
$499,000
🖨 Deal sheet 📄 Offer letter ✓ Due diligence
Multi-family units
County records classify this as Multi-Family (2-4 Unit). Listing-text estimate: 3 units. confirmed
Listing remarks
Excellent investment property! A True Turn Key! Keep all 3 units rented or live in one and let other rents work for you. Well maintained legal 3 family on quiet manicured corner lot . 1 car garage. Income producing. Long term tenants. Super central location, minutes to trains, bus routes, Route 9 and Route 44/55, Poughkeepsie Tennis Club, parks, shopping, eateries, hospitals, historic sites colleges and more. First floor unit was a 2 bedroom, but was converted for larger room and less traffic, to a 1 bedroom, can easily go back to 2 bedroom. Gross $45,900 Net $31,955. All units rents could be a higher. Tenants pay for cooking gas, their electric and cable bills.
Key facts
- Investment property
- Legal 3 family
- Manicured corner lot
Tags
Neighborhood map
What this means for you Summary
Snapshot
- This is a 3 × 2-bed/3.0-bath units multifamily listed at $499k.
Deal economics
- At list price, monthly cash flow is $724 ($9k/yr) — positive. Per door: $241/mo.
- The deal already cash-flows at list — no discount required.
- Meets the 1% rule at list price ($5k rent vs $499k).
- Recommended offer: $439k (12.0% below list) — sets the bar for market timing.
- Cap rate 8.0% vs local median 3.4% in Poughkeepsie — top-decile yield for the area; either an underpriced asset or a hidden risk that comps aren't pricing in. Stress-test before assuming the spread holds.
Location & tenants
- Location reads 78/100 on livability (#165 in NY, #2,577 nationally) — a middle-class / working-renter tenant base. Strengths: commute A+, health & safety A+, housing A-; Watch: employment D+, crime F.
- Poughkeepsie City School District (suburban): math 29% / reading 42% proficiency, ranked #559 of 590 in NY (top 95%) — families likely to look elsewhere, expect single-tenant / working-renter base with shorter leases; 73% free/reduced lunch — lower-income household profile, screen leases tightly.
- Zoned schools: Gov George Clinton School (math 5% / reading 44%, grade F, #1,825 of 2,108 statewide, top 88%, 222 students, 77% FRL); Poughkeepsie Middle School (math 8% / reading 37%, grade F, #650 of 729 statewide, top 90%, 877 students, 82% FRL); Poughkeepsie High School (math 59% / reading 67%, grade B-, #819 of 1,100 statewide, top 74%, 1,165 students, 74% FRL) — zoned schools at 77% FRL track the district average.
- Market conditions: Rents rising (+3.7%/yr); 189 active listings in the ZIP; 620 units permitted in Dutchess County in 2024 (242 in 5+ unit buildings).
- At $5,281/mo this rent would consume 100% of the median local household income ($64k/yr) (locally 2891% of renters already pay >50% of income on rent) — very limited rent-growth headroom before tenants either downsize or default.
Forward outlook
- Local home prices are declining (-3.0%/yr); year-one equity from $3k of loan paydown is wiped out by about $15k of value loss. Plan a longer hold.
- Dutchess County population projected at -11% by 2050 — secular population decline; favor cash flow + early exit over multi-decade hold.
Negotiation context
- It's been on market 127 days — a 12% lower offer ($439k) is reasonable based on typical stale-listing flexibility.
Risks & watch-outs
- Watch-outs: built in 1880 — expect roof / HVAC / electrical / plumbing capex.
- Climate carrying-cost: extreme-heat days projected 7→15/yr by 2055 (HVAC capex compounding) — expect insurance premiums to compound above CPI over the hold.
Questions for the listing agent
- It's been on market 127 days. Have you received any prior offers? Is the seller open to a 12% concession, seller financing, or rate buy-down credit?
- Can we see the unit-by-unit rent roll, current vacancy, and any below-market leases? What's the average tenancy length?
- What capital expenditures (roof, boiler, parking lot, exteriors) have been made in the last 5 years, and what's planned in the next 2?
- Built in 1880 — when were the roof, HVAC, electrical panel, plumbing, and water heater last replaced?
- Why hasn't it sold? Are there any deal-killer items the seller is aware of (foundation, flood, title, zoning, code violations)?
- Is there a deadline driving the sale (1031 exchange, divorce, estate, relocation)? That informs how much negotiation room exists.
- Crime grade is F in this area — have there been break-ins, vandalism, or insurance claims at this property in the last 3 years? What carrier currently insures it and at what premium?
- The area grade is low — what's the realistic commute time and amenity access for the typical tenant pool here? Any planned neighborhood developments (good or bad) we should know about?
- What's the average days-on-market for RENTAL listings here right now (not sales)? A rising rental-DOM trend means longer vacancies and softer asking-rent achievability than the comps imply.
- What's the recent tenant-quality profile in this submarket — average credit score on applications, eviction rate, late-payment / NSF rate, and stable-employment percentage? A property-management company in the area should have these aggregated.
- How much new apartment / multifamily construction is in the pipeline within 1–3 miles? Heavy new supply (>2% of stock underway) typically softens rents 12–24 months out; light construction supports rent growth.
Investment metrics
- 1% rule
- 1.06% ✓
- Cap rate
- 8.03%
- Cash-on-cash
- 6.21%
- DSCR
- 1.28
- GRM
- 7.9
CMA / ARV
- ARV (on-the-fly)
- $428,400
- Comps found
- 6
Show comp detail 6 sales within ~0.75 mi
| Address | Dist | Beds/Ba | Sqft | Sold | Price | $/sf | Match |
|---|---|---|---|---|---|---|---|
| 138 Montgomery St | 0.18mi | 5/2.0 (-1) | 2,000 (-5%) | 15mo | $725,000 | $363 | 51 |
| 30 S White St | 0.50mi | 5/2.0 (-1) | 2,100 (0%) | 8mo | $380,000 | $181 | 50 |
| 236 Mansion St | 0.69mi | 6/2.0 | 2,100 (0%) | 7mo | $444,500 | $212 | 42 |
| 7 Fox Ter | 0.49mi | 6/2.0 | 2,000 (-5%) | 10mo | $350,000 | $175 | 41 |
| 13 Grand St | 0.44mi | 5/3.0 (-1) | 2,400 (+14%) | 6mo | $489,250 | $204 | 31 |
| 24 North White St | 0.64mi | 6/2.0 | 2,400 (+14%) | 16mo | $215,000 | $90 | 13 |
Match score weights: distance 35% · size 25% · config 20% · recency 20%. Top-matched comps best support the ARV.
Projected returns pro-forma
-3.0% appreciation · 3.67% rent growth · sell at horizon
- IRR
- -6.0%
- Equity multiple
- 0.78×
- Total profit
- $-31,115
- Equity at exit
- $74,403
- IRR
- 4.5%
- Equity multiple
- 1.34×
- Total profit
- $47,473
- Equity at exit
- $43,144
Cash invested: $139,720 (down + closing). Projections, not guarantees.
Landlord ↔ Tenant lean methodology
- Overall (STATE)
- 15 Strongly Tenant-Friendly
- State New York
- 15 Strongly Tenant-Friendly · D+10
- County
- — inherits STATE
- City
- — inherits STATE
ZIP-level market 12601
- Rents YoY
- 3.7%
- Active inventory
- 189
- Price-to-rent
- 23.6×
Monthly cashflow live
- Estimated rent
- $5,281 high interval (Pro) →
- Mortgage (P&I)
- −$2,617
- Tax est. 1.5%
- −$624 /mo · $7,485/yr
- Insurance
- −$208
- HOA
- −$0
- Vacancy / Maint / Mgmt
- −$1,109
- Net cashflow
- $724
Break-even live
3-unit breakdown (identical units grouped — click to expand)
| Units | Beds | Baths | Est. rent |
|---|---|---|---|
| 3× units | 2 | 3 | $5,280 |
| #1 | 2 | 3 | $1,760 |
| #2 | 2 | 3 | $1,760 |
| #3 | 2 | 3 | $1,760 |
| Total (3 units) | $5,281 | ||
UW: 25.0% down · 7.5% · 30yr · 1.5% tax · 5.0% vac · 8.0% maint · 8.0% mgmt
Financing live
Cash to close
- Down payment
- $124,750
- Closing costs
- $14,970
- Reserves months
- —
- Total cash needed
- —
Loan-product check · same deal, 3 products live
Conventional
25% down · 7.5% · 30yr
- Down + closing
- —
- Monthly P&I
- —
- Monthly cashflow
- —
- DSCR
- —
- Eligible?
- —
Personal DTI + credit; lowest rate.
DSCR
20% down · 8.5% · 30yr
- Down + closing
- —
- Monthly P&I
- —
- Monthly cashflow
- —
- DSCR
- —
- Eligible?
- —
No personal income docs; deal must DSCR.
Hard money
10% down · 12.0% · 12mo
- Down + closing
- —
- Monthly P&I
- —
- Monthly cashflow
- —
- DSCR
- —
- Eligible?
- —
Short-term bridge; refi at stabilization.
Listing history 6 events
-
2026-01-07status Pending
-
2025-10-29price $499,000
-
2025-10-13price $510,000
-
2025-10-10price $511,000
-
2025-09-18price $520,000
-
2025-08-31$529,000 Active
ⓘ Source: listings_history table (triggers on properties + properties_extension) + one-shot
backfill from property_details.listing_events for pre-trigger history.
Climate risk First Street
- Flood 1/10 Low FEMA zone X (unshaded) · 0% chance over 30 yrs
- Wildfire 3/10 Moderate
- Heat 5/10 Major 7 d/yr ≥99°F today · 15 d/yr by 30 yrs out
- Wind 4/10 Moderate 11% chance of damaging wind over 30 yrs
- Air quality 2/10 Low 1 unhealthy d/yr today · 3 by 30 yrs out
Nearby sold comps map
Loading sold comps map…
Walkable amenities ~0.75 mi
Loading nearby amenities…
Taxation est. · year 1
- Rental income
- $63,372
- − Mortgage interest
- −$27,952
- − Property taxes
- −$7,485
- − Insurance
- −$2,495
- − Repairs & maintenance
- −$5,070
- − Management
- −$5,070
- − Depreciation
- −$14,516
- Taxable income
- $784
- Est. tax owed @ 24.0%
- −$188
- After-tax cash flow
- $8,494/yr
For passive investors: Depreciation is non-cash, so a rental often shows a tax loss while cash-flowing — sheltering income. Rental losses are passive: they offset passive income freely, and up to $25,000/yr can offset ordinary (W-2) income if you actively participate and your MAGI is under $100k (phasing out to $0 by $150k); unused losses carry forward. On sale, claimed depreciation is recaptured at up to 25%, and gains may owe capital-gains tax (a 1031 exchange can defer both). Figures are a year-1 estimate at your 24.0% rate — not tax advice; consult a CPA.
Schools (NCES district)
- District
- Poughkeepsie City School District
- NCES district ID
- 3623760
- Math proficiency
- 29% ▲ 5.00%
- Reading proficiency
- 42% ▲ 12.00%
- Median HH income
- $39,159
- Composite
- 29.68/100
- National rank
- #6459
- State rank
- #559 of 590 in NY
Livability — Poughkeepsie
- Score
- 78/100
- State rank
- #165
- US rank
- #2577
Category grades
Schools grade is shown separately in the Schools card above.
Census & demographics
- Census place
- Poughkeepsie, NY
- County
- Dutchess County · 188,048 people
- City population
- 86,468
- Metro
- Poughkeepsie-Newburgh-Middletown, NY
- Population (ZIP)
- 44,164
- Household income
- $63,652
- Rent vs Own
- Severe rent burden
- 2891.0
Population outlook (Dutchess County) Hauer SSP2
- Today (2025)
- 291,768 people
- By 2030
- 287,131 · -1.6%
- By 2040
- 274,881 · -5.8%
- By 2050
- 259,971 · -10.9%
- By 2075
- 235,366 · -19.3%
- By 2100
- 208,786 · -28.4%
Race, ethnicity, and origin ACS 2023
- Neighborhood character
- Highly diverse neighborhood (Simpson 0.70)
- Race & ethnicity
- White 44% Black 24% Hispanic / Latino 22% Two or more races 17% Asian 3%
- Hispanic origin (detail)
- Mexican 8% Puerto Rican 5% Dominican 1%
- Common ancestry
- Romanian 3% Iranian 1% Lithuanian 1%
- Foreign-born
- 19% · Canada, China
- Languages at home
- 79% English-only · Spanish 15% Other Indo-European 1% Chinese 1%
Political lean MEDSL · Dutchess
- 2024 margin
- Lean D (+5.4) · D 52.7% · R 47.3%
- 2008→2024 swing
- -3.2pp toward R · 2008: 8.6pp · 2024: 5.4pp
- All cycles
- 2024: D+5.4 2020: D+9.6 2016: R+1.1 2012: D+6.6 2008: D+8.6
Not yet ingested
- Civics
- —
Market trends
- HPI YoY
- ▼ -210.62%
- Current HPI
- 293.9789
- Rent YoY
- ▲ 3.67%
- Metro
- Poughkeepsie-Newburgh-Middletown, NY
- State GDP YoY
- ▲ 2.60%
- F500 in state
- 92
Industry mix (Fortune 500 HQ in NY)
| Industry | F500 HQs | Revenue |
|---|---|---|
| Financial Services | 10 | $950B |
|
||
| Consumer Goods | 9 | $162B |
|
||
| Insurance | 4 | $225B |
|
||
| Telecommunications | 2 | $144B |
|
||
| Pharmaceuticals | 2 | $112B |
|
||
| Media / Entertainment | 2 | $69B |
|
||
Price history
-5.7% since first listed6 events — show timeline
- 2026-01-07 Pending — OneKey® MLS as Distributed by MLS Grid
- 2025-10-29 Price Changed $499,000 OneKey® MLS as Distributed by MLS Grid
- 2025-10-13 Price Changed $510,000 OneKey® MLS as Distributed by MLS Grid
- 2025-10-10 Price Changed $511,000 OneKey® MLS as Distributed by MLS Grid
- 2025-09-18 Price Changed $520,000 OneKey® MLS as Distributed by MLS Grid
- 2025-08-31 Listed $529,000 OneKey® MLS as Distributed by MLS Grid
Cash-flow waterfall
monthlySold comps — $/sqft
last 12 mo · ≤1 miLoading sold comps…