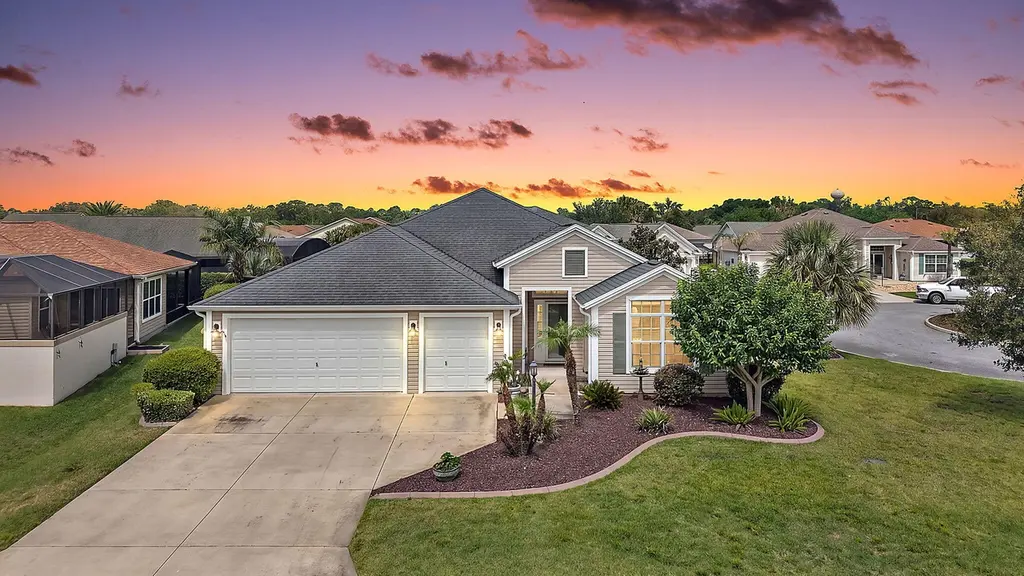
3746 New Moon Ave · The Villages, FL
Flood risk 1/10 · Minimal
- FEMA flood zone
- X (unshaded)
- Chance of flooding over 30 yrs
- 0.0%
- Est. flood insurance / yr
- $507 – $1,088
Fire risk 4/10 · Minor
- Est. fire insurance / yr
- $947 – $1,759
Heat risk 9/10 · Severe
- Hot days now (above 108°F)
- 7 days/yr
- Hot days in 30 yrs
- 23 days/yr
Wind risk 9/10 · Severe
- Chance of severe wind over 30 yrs
- 99.0%
Air-quality risk 2/10 · Minimal
- Unhealthy air days now
- 1 days/yr
- Unhealthy air days in 30 yrs
- 2 days/yr
Risk factors via First Street. Map © Google.
Why this score? — see what drove the D grade
The composite is a weighted blend of 9 inputs, each scored 0–100. Each bar is that input's sub-score; the figure is the points it added to the 100-point composite (weight × sub-score).
- ARV discount +12.5/15.0
- Appreciation +10.0/10.0
- Cash flow +6.4/30.0
- Schools +5.2/10.0
- Livability +3.5/5.0
- Rent growth +2.5/5.0
- Condition / age +2.5/5.0
- 1% rule +1.3/10.0
- DSCR +0.7/10.0
$478,788
🖨 Deal sheet 📄 Offer letter ✓ Due diligence
Listing remarks
This beautifully maintained Sunflower (Mockingbird F) model, located in the Village of Lake Deaton, offers the perfect blend of style, comfort, and effortless Florida living. Featuring 3 bedrooms, 2 bathrooms, and a 2-car plus golf cart garage, this move-in ready home is designed for both everyday enjoyment and entertaining. Built in 2013, the home showcases quality finishes, tasteful upgrades, and pride of ownership throughout. Inside, you'll find an inviting open layout enhanced by warm finishes. The spacious primary suite provides a relaxing retreat with plush upgraded carpeting, dual closets, and a well-appointed ensuite featuring dual vanities, a Roman shower, and a private water close
Key facts
- Sunflower model
- Dual closets
- Open layout
Tags
Property features AI
Finance
- Other: Pets allowed (call for details)
- HOA & community: Senior community
Exterior
- Parking: Attached 2-car garage; Driveway; Two covered parking spaces
- Utilities: Public water; Public sewer; Cable available
- Home design: Single-family residence; One story; Resale property; Faces east
- Construction: Built with stucco and vinyl siding; Shingle roof; Concrete perimeter foundation and slab
- Exterior features: Covered patio; Screened patio; Patio; Corner lot; Not waterfront
Interior
- Kitchen: Dishwasher; Electric range; Microwave; Refrigerator; Garbage disposal; Owned water purifier
- Bedrooms: Three bedrooms on the main level
- Flooring: Carpet; Tile; Vinyl
- Bathrooms: Two full bathrooms on the main level
- Heating & cooling: Central heating; Central air conditioning; Ceiling fans
- Interior features: Walk-in closets; Split bedroom layout
- Laundry & utility: Laundry room on the main level; Washer hookup; Electric dryer hookup; Laundry sink; Laundry located inside the home
Neighborhood map
What this means for you Summary
Snapshot
- This is a 3-bed/2.0-bath single-family listed at $479k.
Deal economics
- At list price, monthly cash flow is $-825 ($-10k/yr) — negative.
- To cash-flow at today's rent, offer at most $333k (30.4% below list).
- To meet the 1% rule (rent ≥ 1% of price), the offer needs to be $302k (36.9% below list).
- Recommended offer: $302k (36.9% below list) — sets the bar for 1% rule.
Location & tenants
- Location reads 70/100 on livability (#431 in FL) — a middle-class / working-renter tenant base. Strengths: schools A+, crime A+, housing A; Watch: amenities F, commute F, health & safety F.
- Sumter (rural): math 61% / reading 61% proficiency, ranked #11 of 73 in FL (top 15%) — acceptable for families but not a draw, mixed tenant base, ~2y average lease.
- Market conditions: 265 active listings in the ZIP; 6 comparable units currently listed for rent nearby; rentals at typical pace (median 21d on market — plan ~3-4 weeks tenant-placement turnaround); solid renter incomes; 3,961 units permitted in Sumter County in 2024 (248 in 5+ unit buildings).
- This rent runs 37% of the median local income ($97k/yr) — at the standard rent-burdened threshold; future hikes will face affordability resistance.
Forward outlook
- In year one you build about $51k of equity ($3k loan paydown + $48k appreciation (10.0% local appreciation)).
- Sumter County population projected at +45% by 2050 — long-run rental-demand tailwind backs the buy-and-hold thesis.
- By year 2, paydown + projected appreciation supports a ~$82k cash-out refi (75% LTV) — recoverable capital for the next deal without selling this one.
Negotiation context
- It's been on market 29 days — a 2% lower offer ($472k) is reasonable based on typical stale-listing flexibility.
Risks & watch-outs
- Climate carrying-cost: severe wind risk, 99% chance of damaging wind over 30y; extreme-heat days projected 7→23/yr by 2055 (HVAC capex compounding) — expect insurance premiums to compound above CPI over the hold.
Questions for the listing agent
- What do current leases actually rent for vs. the listed asking? Can we see a recent rent roll and the last 12 months of T-12 income?
- Is there a deadline driving the sale (1031 exchange, divorce, estate, relocation)? That informs how much negotiation room exists.
- Schools are A-rated — typically a magnet for longer-tenancy family renters. What's the average tenant stay here, and is there a school-zone premium baked into asking?
- The area grade is low — what's the realistic commute time and amenity access for the typical tenant pool here? Any planned neighborhood developments (good or bad) we should know about?
- What's the average days-on-market for RENTAL listings here right now (not sales)? A rising rental-DOM trend means longer vacancies and softer asking-rent achievability than the comps imply.
- What's the recent tenant-quality profile in this submarket — average credit score on applications, eviction rate, late-payment / NSF rate, and stable-employment percentage? A property-management company in the area should have these aggregated.
- How much new for-sale + rental construction is in the pipeline within 1–3 miles? Heavy new supply typically softens prices + rents 12–24 months out; constrained supply supports both.
Investment metrics
- 1% rule
- 0.63% ✗
- Cap rate
- 4.22%
- Cash-on-cash
- -7.39%
- DSCR
- 0.67
- GRM
- 13.2
CMA / ARV
- ARV (on-the-fly)
- $539,115
- Comps found
- 12
Show comp detail 12 sales within ~0.75 mi
| Address | Dist | Beds/Ba | Sqft | Sold | Price | $/sf | Match |
|---|---|---|---|---|---|---|---|
| 3567 Infinity Run | 0.13mi | 3/2.0 | 2,035 (+7%) | 3mo | $485,500 | $239 | 80 |
| 3587 Alzarine Ter | 0.29mi | 3/2.0 | 1,969 (+3%) | 2mo | $879,000 | $446 | 79 |
| 3566 Cosmos Way | 0.33mi | 3/2.0 | 1,956 (+3%) | 7mo | $555,000 | $284 | 75 |
| 3976 Ironwood Ln | 0.46mi | 3/2.0 | 1,935 (+2%) | 3mo | $710,000 | $367 | 74 |
| 1965 Gatehouse Ter | 0.32mi | 3/2.0 | 2,035 (+7%) | 4mo | $580,000 | $285 | 70 |
| 1932 Quailey Ct | 0.56mi | 3/2.0 | 1,923 (+1%) | 4mo | $465,000 | $242 | 69 |
| 3972 Neighborly Way | 0.50mi | 3/2.0 | 1,963 (+3%) | 5mo | $467,500 | $238 | 67 |
| 3776 E Torch Lake Dr | 0.65mi | 3/2.0 | 1,851 (-3%) | 0mo | $750,000 | $405 | 65 |
| 3334 Norcoose Rd | 0.69mi | 3/2.0 | 1,920 (+1%) | 3mo | $395,000 | $206 | 64 |
| 3338 Queensway Ter | 0.70mi | 3/2.0 | 2,013 (+6%) | 1mo | $470,000 | $233 | 57 |
| 3497 Oldham Ln | 0.57mi | 3/2.0 | 1,695 (-11%) | 6mo | $479,900 | $283 | 50 |
| 3324 Queensway Ter | 0.71mi | 3/2.5 | 2,168 (+14%) | 1mo | $467,000 | $215 | 41 |
Match score weights: distance 35% · size 25% · config 20% · recency 20%. Top-matched comps best support the ARV.
Projected returns pro-forma
10.0% appreciation · 3.0% rent growth · sell at horizon
- IRR
- 19.1%
- Equity multiple
- 2.55×
- Total profit
- $208,191
- Equity at exit
- $431,330
- IRR
- 17.6%
- Equity multiple
- 5.88×
- Total profit
- $654,386
- Equity at exit
- $930,180
Cash invested: $134,061 (down + closing). Projections, not guarantees.
Landlord ↔ Tenant lean methodology
- Overall (STATE)
- 87 Strongly Landlord-Friendly
- State Florida
- 87 Strongly Landlord-Friendly · R+3
- County
- — inherits STATE
- City
- — inherits STATE
ZIP-level market 32163
- Home prices YoY
- 9.8%
- Active inventory
- 265
- Price-to-rent
- 13.2×
Monthly cashflow live
- Estimated rent
- $3,019 high interval (Pro) →
- Mortgage (P&I)
- −$2,511
- Tax from tax record
- −$500 /mo · $5,997/yr
- Insurance
- −$199
- HOA
- −$0
- Vacancy / Maint / Mgmt
- −$634
- Net cashflow
- $-825
Break-even live
UW: 25.0% down · 7.5% · 30yr · 1.5% tax · 5.0% vac · 8.0% maint · 8.0% mgmt
Financing live
Cash to close
- Down payment
- $119,697
- Closing costs
- $14,364
- Reserves months
- —
- Total cash needed
- —
Loan-product check · same deal, 3 products live
Conventional
25% down · 7.5% · 30yr
- Down + closing
- —
- Monthly P&I
- —
- Monthly cashflow
- —
- DSCR
- —
- Eligible?
- —
Personal DTI + credit; lowest rate.
DSCR
20% down · 8.5% · 30yr
- Down + closing
- —
- Monthly P&I
- —
- Monthly cashflow
- —
- DSCR
- —
- Eligible?
- —
No personal income docs; deal must DSCR.
Hard money
10% down · 12.0% · 12mo
- Down + closing
- —
- Monthly P&I
- —
- Monthly cashflow
- —
- DSCR
- —
- Eligible?
- —
Short-term bridge; refi at stabilization.
Rent comps 6 comps
| Address | Beds | Baths | Sqft | Rent | $/sqft | DOM | Units | Dist |
|---|---|---|---|---|---|---|---|---|
| 3394 Ridgewood Path The Villages, FL | 3.0 | 2.0 | 1559 | $4,000 | $2.57 | 21d | 1 | 1.09mi |
| 3064 Gulfport Ct The Villages, FL | 2.0 | 2.0 | 1602 | $2,800 | $1.75 | 21d | 1 | 1.29mi |
| 3025 Bartow Ln The Villages, FL | 3.0 | 2.0 | 1415 | $3,500 | $2.47 | 21d | 1 | 1.34mi |
| 2910 Monument Way The Villages, FL | 2.0 | 2.0 | 1494 | $2,600 | $1.74 | 21d | 1 | 1.46mi |
| 3480 Kewadin Ave The Villages, FL | 2.0 | 2.0 | 1758 | $2,500 | $1.42 | 21d | 1 | 1.49mi |
| 7011 Homestead Lp Wildwood, FL | 1.0–3.0 | 1.0–2.0 | 998 | $1,759 | $1.76 | 21d | 22 | 1.49mi |
Listing history 16 events
-
2026-06-19days on market $478,788 Active 29 DOM
-
2026-06-18days on market $478,788 Active 28 DOM
-
2026-06-17days on market $478,788 Active 27 DOM
-
2026-06-16days on market $478,788 Active 26 DOM
-
2026-06-15days on market $478,788 Active 25 DOM
-
2026-06-14days on market $478,788 Active 23 DOM
-
2026-06-13days on market $478,788 Active 22 DOM
-
2026-06-10days on market $478,788 Active 20 DOM
-
2026-06-09days on market $478,788 Active 19 DOM
-
2026-06-08days on market $478,788 Active 18 DOM
-
2026-06-07days on market $478,788 Active 17 DOM
-
2026-06-02days on market $478,788 Active 12 DOM
-
2026-06-01days on market $478,788 Active 11 DOM
-
2026-05-31days on market $478,788 Active 10 DOM
-
2026-05-30days on market $478,788 Active 9 DOM
-
2026-05-21$478,788 Active
ⓘ Source: listings_history table (triggers on properties + properties_extension) + one-shot
backfill from property_details.listing_events for pre-trigger history.
Tax reassessment forecast FL · Resets to sale price
- Current annual tax
- $5,997 · $500/mo
- Projected year-2 tax
- $5,997 · $500/mo
- Expected delta
- $0/yr ($0/mo · 0.0%)
ⓘ Screening estimate from a state-policy table — verify with the county assessor before closing.
Climate risk First Street
- Flood 1/10 Low FEMA zone X (unshaded) · 0% chance over 30 yrs
- Wildfire 4/10 Moderate
- Heat 9/10 Extreme 7 d/yr ≥108°F today · 23 d/yr by 30 yrs out
- Wind 9/10 Extreme 99% chance of damaging wind over 30 yrs
- Air quality 2/10 Low 1 unhealthy d/yr today · 2 by 30 yrs out
Nearby sold comps map
Loading sold comps map…
Walkable amenities ~0.75 mi
Loading nearby amenities…
Taxation est. · year 1
- Rental income
- $36,227
- − Mortgage interest
- −$26,820
- − Property taxes
- −$5,997
- − Insurance
- −$2,394
- − Repairs & maintenance
- −$2,898
- − Management
- −$2,898
- − Depreciation
- −$13,928
- Taxable loss
- −$18,709
- Est. tax savings @ 24.0%
- +$4,490
- After-tax cash flow
- $-5,412/yr
For passive investors: Depreciation is non-cash, so a rental often shows a tax loss while cash-flowing — sheltering income. Rental losses are passive: they offset passive income freely, and up to $25,000/yr can offset ordinary (W-2) income if you actively participate and your MAGI is under $100k (phasing out to $0 by $150k); unused losses carry forward. On sale, claimed depreciation is recaptured at up to 25%, and gains may owe capital-gains tax (a 1031 exchange can defer both). Figures are a year-1 estimate at your 24.0% rate — not tax advice; consult a CPA.
Schools (NCES district)
- District
- Sumter
- NCES district ID
- 1201800
- Math proficiency
- 61% ▼ -4.00%
- Reading proficiency
- 61% ▼ -2.00%
- Median HH income
- $48,240
- Composite
- 51.74/100
- National rank
- #1682
- State rank
- #11 of 73 in FL
Livability — The Villages
- Score
- 70/100
- State rank
- #431
- US rank
- #7363
Category grades
Schools grade is shown separately in the Schools card above.
Census & demographics
- Census place
- The Villages, FL
- County
- Sumter County · 110,591 people
- City population
- 83,973
- Metro
- The Villages, FL
- Population (ZIP)
- 28,549
- Household income
- $96,775
- Rent vs Own
- Severe rent burden
- 307.0
Population outlook (Sumter County) Hauer SSP2
- Today (2025)
- 161,172 people
- By 2030
- 180,083 · +11.7%
- By 2040
- 209,892 · +30.2%
- By 2050
- 234,186 · +45.3%
- By 2075
- 284,602 · +76.6%
- By 2100
- 317,039 · +96.7%
Race, ethnicity, and origin ACS 2023
- Neighborhood character
- Predominantly White (95%)
- Race & ethnicity
- White 95% Two or more races 2% Hispanic / Latino 2% Asian 1%
- Common ancestry
- Romanian 6% Lithuanian 3% Iranian 3%
- Foreign-born
- 6% · Canada, Vietnam
- Languages at home
- 96% English-only · Spanish 2% Vietnamese 1% Other Indo-European 0%
Political lean MEDSL · Sumter
- 2024 margin
- Solid R (+37.6) · D 30.9% · R 68.6%
- 2008→2024 swing
- -10.6pp toward R · 2008: -27.0pp · 2024: -37.6pp
- All cycles
- 2024: R+37.6 2020: R+36.1 2016: R+39.2 2012: R+34.9 2008: R+27.0
Not yet ingested
- Civics
- —
Market trends
- HPI YoY
- ▲ 20.47%
- Current HPI
- 229.0075
- Rent YoY
- —
- Metro
- The Villages, FL
- State GDP YoY
- ▲ 3.28%
- F500 in state
- 36
Industry mix (Fortune 500 HQ in FL)
| Industry | F500 HQs | Revenue |
|---|---|---|
| Industrial Technology | 2 | $29B |
|
||
| Insurance | 2 | $17B |
|
||
| Retail | 1 | $60B |
|
||
| Technology Distribution | 1 | $58B |
|
||
| Homebuilding | 1 | $35B |
|
||
| Technology Manufacturing | 1 | $35B |
|
||
Price history
1 event — show timeline
- 2026-05-21 Listed $478,788 Beaches MLS
Property tax history
+7.9%/yrLatest (2025): $5,997 · +0.1% YoY. Source: county tax records.
Cash-flow waterfall
monthlySold comps — $/sqft
last 12 mo · ≤1 miLoading sold comps…