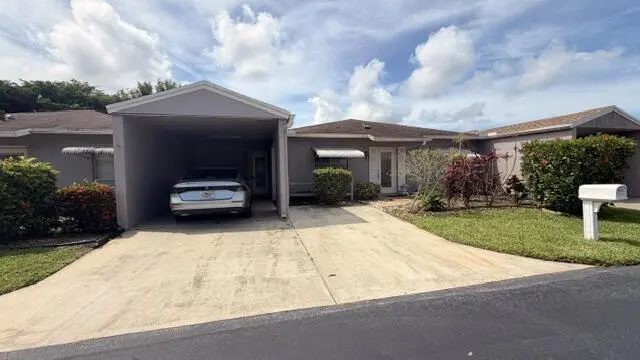
14760 Wildflower Ln · Delray Beach, FL
Flood risk 1/10 · Minimal
- FEMA flood zone
- X (unshaded)
- Chance of flooding over 30 yrs
- 0.0%
- Est. flood insurance / yr
- $507 – $1,088
Fire risk 1/10 · Minimal
- Est. fire insurance / yr
- $947 – $1,759
Heat risk 9/10 · Severe
- Hot days now (above 107°F)
- 5 days/yr
- Hot days in 30 yrs
- 18 days/yr
Wind risk 10/10 · Severe
- Chance of severe wind over 30 yrs
- 99.0%
Air-quality risk 2/10 · Minimal
- Unhealthy air days now
- 1 days/yr
- Unhealthy air days in 30 yrs
- 2 days/yr
Risk factors via First Street. Map © Google.
Why this score? — see what drove the C grade
The composite is a weighted blend of 9 inputs, each scored 0–100. Each bar is that input's sub-score; the figure is the points it added to the 100-point composite (weight × sub-score).
- Cash flow +15.8/30.0
- ARV discount +15.0/15.0
- Appreciation +5.3/10.0
- DSCR +4.9/10.0
- Schools +4.3/10.0
- 1% rule +4.0/10.0
- Livability +3.9/5.0
- Rent growth +2.6/5.0
- Condition / age +2.5/5.0
$318,000
🖨 Deal sheet 📄 Offer letter ✓ Due diligence
Listing remarks
55+ FRIENDLY COMMUNITY WITH LOTS OF ACTIVITIES, BINGO, CARDS, BILLIARDS, BOCCE, PUTTING GREEN, TENNIS, PICKLEBALL, FITNESS, CABLE/HBO, OUTSIDE PEST CONTROL, EXTERIOR PAINTING, LAWN CARE, HSI INCLUDED VERY LOW MAINTENANCE OF $897 PER QTR. COMMUNITY HAS OVER A MILLION IN RESERVE. CLOSE TO PUBLIX, WALGREENS, MOVIES, DUNKIN DONUTS, APPLEBEES, HOME DEPOT, WORSHIP AND MUCH MORE. 1MILE TO TURNPIKE, 3 MILES TO 95, 5 MILES TO OCEAN.
Key facts
- 5 miles to ocean
- 3 miles to 95
- 1 mile to turnpike
Tags
Property features AI
Finance
- Other: Parcel number available
- Financial info: Not a land-lease property
- HOA & community: Community of 363 units; Oriole Village Center HOA; Senior community; Pets allowed (restrictions possible)
Exterior
- Parking: 2 total parking spaces; Attached carport (1 covered carport space); Driveway; Concrete; 1 open parking space
- Security: Smoke detectors; Security patrol
- Utilities: Public water; Public sewer; Cable available; Electricity available; Underground utilities; Water available; Sewer available
- Home design: Villa; One story; Resale; Builder model: WILDFLOWER; Faces north
- Construction: CBS construction; Shingle roof; Built on foundation per assessor
- Exterior features: Screened patio; Patio; Fencing (other); Private road frontage; Asphalt road surface; Private maintained road; Not waterfront
Interior
- Kitchen: Electric range; Microwave; Dishwasher; Garbage disposal; Refrigerator; Electric water heater
- Bedrooms: 2 bedrooms on the main level
- Flooring: Carpet; Tile
- Bathrooms: 2 full bathrooms (main level)
- Heating & cooling: Central electric heating; Central air conditioning; Ceiling fans; Electric cooling
- Interior features: Entrance foyer; Walk-in closets; Split bedroom layout; Dome kitchen
- Laundry & utility: Laundry closet located in the kitchen
Neighborhood map
What this means for you Summary
Snapshot
- This is a 2-bed/2.0-bath single-family listed at $318k.
Deal economics
- At list price, monthly cash flow is $145 ($2k/yr) — positive.
- The deal already cash-flows at list — no discount required.
- To meet the 1% rule (rent ≥ 1% of price), the offer needs to be $287k (9.8% below list).
- Recommended offer: $287k (9.8% below list) — sets the bar for 1% rule.
- Cap rate 6.8% vs local median 4.3% in Delray Beach — top-decile yield for the area; either an underpriced asset or a hidden risk that comps aren't pricing in. Stress-test before assuming the spread holds.
Location & tenants
- Location reads 77/100 on livability (#202 in FL, #3,160 nationally) — a middle-class / working-renter tenant base. Strengths: housing A+, health & safety A+, commute A-; Watch: cost of living C-, crime D-, amenities F.
- Palm Beach (suburban): math 46% / reading 53% proficiency, ranked #34 of 73 in FL (top 47%) — families likely to look elsewhere, expect single-tenant / working-renter base with shorter leases.
- Zoned schools: Hagen Road Elementary School (math 55% / reading 63%, grade B-, #722 of 2,144 statewide, top 34%, 773 students, 46% FRL); Spanish River Community High School (math 64% / reading 74%, grade B, #63 of 667 statewide, top 10%, 2,578 students, 25% FRL) — zoned schools average 35% FRL vs 52% district-wide (17 pts lower); this property's tenant base skews higher-income than the district average.
- Zoned-school proficiency averages 64% at this address vs 50% district-wide (+14 pts) — the actual schools serving this property are materially stronger than the Palm Beach average implies; a family-tenant draw the district grade alone would hide.
- Market conditions: Rents flat; 577 active listings in the ZIP; 40 comparable units currently listed for rent nearby; rentals at typical pace (median 25d on market — plan ~3-4 weeks tenant-placement turnaround); solid renter incomes; 3,974 units permitted in Palm Beach County in 2024 (1,012 in 5+ unit buildings).
- This rent runs 43% of the median local income ($80k/yr) — at the standard rent-burdened threshold; future hikes will face affordability resistance.
Forward outlook
- In year one you build about $4k of equity ($2k loan paydown + $2k appreciation (0.7% local appreciation)).
- Palm Beach County population projected at +30% by 2050 — long-run rental-demand tailwind backs the buy-and-hold thesis.
- By year 7, paydown + projected appreciation supports a ~$31k cash-out refi (75% LTV) — recoverable capital for the next deal without selling this one.
Negotiation context
- It's been on market 20 days — a 2% lower offer ($313k) is reasonable based on typical stale-listing flexibility.
Risks & watch-outs
- Climate carrying-cost: severe wind risk, 99% chance of damaging wind over 30y; extreme-heat days projected 5→18/yr by 2055 (HVAC capex compounding) — expect insurance premiums to compound above CPI over the hold.
Questions for the listing agent
- Built in 1978 — when were the roof, HVAC, electrical panel, plumbing, and water heater last replaced?
- Is there a deadline driving the sale (1031 exchange, divorce, estate, relocation)? That informs how much negotiation room exists.
- Schools are B-rated — typically a magnet for longer-tenancy family renters. What's the average tenant stay here, and is there a school-zone premium baked into asking?
- Crime grade is D in this area — have there been break-ins, vandalism, or insurance claims at this property in the last 3 years? What carrier currently insures it and at what premium?
- What's the average days-on-market for RENTAL listings here right now (not sales)? A rising rental-DOM trend means longer vacancies and softer asking-rent achievability than the comps imply.
- What's the recent tenant-quality profile in this submarket — average credit score on applications, eviction rate, late-payment / NSF rate, and stable-employment percentage? A property-management company in the area should have these aggregated.
- How much new for-sale + rental construction is in the pipeline within 1–3 miles? Heavy new supply typically softens prices + rents 12–24 months out; constrained supply supports both.
Investment metrics
- 1% rule
- 0.90% ✗
- Cap rate
- 6.84%
- Cash-on-cash
- 1.95%
- DSCR
- 1.09
- GRM
- 9.2
CMA / ARV
- ARV (on-the-fly)
- $383,537
- Comps found
- 1
Show comp detail 1 sale within ~0.75 mi
| Address | Dist | Beds/Ba | Sqft | Sold | Price | $/sf | Match |
|---|---|---|---|---|---|---|---|
| 6839 Moonlit Dr | 0.35mi | 2/2.0 | 1,148 (-12%) | 6mo | $336,450 | $293 | 58 |
Match score weights: distance 35% · size 25% · config 20% · recency 20%. Top-matched comps best support the ARV.
Projected returns pro-forma
0.69% appreciation · 0.51% rent growth · sell at horizon
- IRR
- 0.8%
- Equity multiple
- 1.04×
- Total profit
- $3,295
- Equity at exit
- $103,409
- IRR
- 4.2%
- Equity multiple
- 1.46×
- Total profit
- $41,162
- Equity at exit
- $133,522
Cash invested: $89,040 (down + closing). Projections, not guarantees.
Landlord ↔ Tenant lean methodology
- Overall (STATE)
- 87 Strongly Landlord-Friendly
- State Florida
- 87 Strongly Landlord-Friendly · R+3
- County
- — inherits STATE
- City
- — inherits STATE
ZIP-level market 33446
- Home prices YoY
- 0.3%
- Rents YoY
- 0.5%
- Active inventory
- 577
- Price-to-rent
- 9.2×
Monthly cashflow live
- Estimated rent
- $2,870 high interval (Pro) →
- Mortgage (P&I)
- −$1,668
- Tax from tax record
- −$322 /mo · $3,867/yr
- Insurance
- −$132
- HOA
- −$0
- Vacancy / Maint / Mgmt
- −$603
- Net cashflow
- $145
Break-even live
UW: 25.0% down · 7.5% · 30yr · 1.5% tax · 5.0% vac · 8.0% maint · 8.0% mgmt
Financing live
Cash to close
- Down payment
- $79,500
- Closing costs
- $9,540
- Reserves months
- —
- Total cash needed
- —
Loan-product check · same deal, 3 products live
Conventional
25% down · 7.5% · 30yr
- Down + closing
- —
- Monthly P&I
- —
- Monthly cashflow
- —
- DSCR
- —
- Eligible?
- —
Personal DTI + credit; lowest rate.
DSCR
20% down · 8.5% · 30yr
- Down + closing
- —
- Monthly P&I
- —
- Monthly cashflow
- —
- DSCR
- —
- Eligible?
- —
No personal income docs; deal must DSCR.
Hard money
10% down · 12.0% · 12mo
- Down + closing
- —
- Monthly P&I
- —
- Monthly cashflow
- —
- DSCR
- —
- Eligible?
- —
Short-term bridge; refi at stabilization.
Rent comps 40 comps
| Address | Beds | Baths | Sqft | Rent | $/sqft | DOM | Units | Dist |
|---|---|---|---|---|---|---|---|---|
| 14832 Wildflower Ln Delray Beach, FL | 2.0 | 2.0 | 1073 | $2,500 | $2.33 | 17d | 1 | 0.09mi |
| 14735 Wildflower Ln Delray Beach, FL | 2.0 | 2.0 | 1073 | $2,350 | $2.19 | 2d | 1 | 0.09mi |
| 14747 Wildflower Ln Delray Beach, FL | 2.0 | 2.0 | 1229 | $2,475 | $2.01 | 24d | 1 | 0.14mi |
| 6550 Country Wood Way Delray Beach, FL | 3.0 | 2.0 | 1408 | $4,000 | $2.84 | 5d | 1 | 0.17mi |
| 6550 Country Wood Way Delray Beach, FL | 3.0 | 2.0 | 1408 | $4,000 | $2.84 | 24d | 1 | 0.17mi |
| 14671 Bonaire Blvd #505 Delray Beach, FL | 1.0 | 2.0 | 925 | $1,600 | $1.73 | 24d | 1 | 0.18mi |
| 32 Abbey Ln #207 Delray Beach, FL | 2.0 | 2.0 | 925 | $2,500 | $2.70 | 24d | 1 | 0.20mi |
| 6557 Country Wood Way Delray Beach, FL | 3.0 | 2.0 | 1346 | $4,700 | $3.49 | 24d | 1 | 0.20mi |
| 6549 Sleepy Willow Way #6549 Delray Beach, FL | 3.0 | 2.0 | 1729 | $6,000 | $3.47 | 24d | 1 | 0.22mi |
| 31 Abbey Ln #207 Delray Beach, FL | 2.0 | 2.0 | 925 | $1,300 | $1.41 | 24d | 1 | 0.23mi |
| 6396 Country Wood Way Delray Beach, FL | 2.0 | 2.0 | 1364 | $3,000 | $2.20 | 24d | 1 | 0.23mi |
| 3 Abbey Ln #102 Delray Beach, FL | 2.0 | 2.0 | 925 | $2,500 | $2.70 | 24d | 1 | 0.24mi |
| 6372 Sleepy Willow Way Delray Beach, FL | 2.0 | 2.0 | 1344 | $3,975 | $2.96 | 24d | 1 | 0.28mi |
| 6372 Sleepy Willow Way Delray Beach, FL | 2.0 | 2.0 | 1344 | $3,975 | $2.96 | 15d | 1 | 0.28mi |
| 19 Abbey Ln #206 Delray Beach, FL | 2.0 | 2.0 | 925 | $1,750 | $1.89 | 24d | 1 | 0.30mi |
| 6813 Moonlit Dr Delray Beach, FL | 2.0 | 2.0 | 1148 | $2,150 | $1.87 | 24d | 1 | 0.30mi |
| 23 Abbey Ln #208 Delray Beach, FL | 2.0 | 2.0 | 925 | $1,500 | $1.62 | 3d | 1 | 0.30mi |
| 21 Abbey Ln #107 Delray Beach, FL | 2.0 | 2.0 | 925 | $1,800 | $1.95 | 15d | 1 | 0.31mi |
| 14475 Strathmore Ln Delray Beach, FL | 2.0 | 2.0 | 1230 | $2,422 | $1.97 | 24d | 2 | 0.31mi |
| 20 Abbey Ln #102 Delray Beach, FL | 2.0 | 2.0 | 925 | $2,600 | $2.81 | 24d | 1 | 0.33mi |
| 189 Seville Ter Unit 189 Delray Beach, FL | 2.0 | 2.0 | 880 | $1,900 | $2.16 | 24d | 1 | 0.34mi |
| 14624 Three Ponds Trl Delray Beach, FL | 3.0 | 2.0 | 1411 | $3,250 | $2.30 | 17d | 1 | 0.35mi |
| 14608 Country Side Ln Delray Beach, FL | 2.0 | 2.0 | 1303 | $2,950 | $2.26 | 24d | 1 | 0.36mi |
| 10 Willowbrook Ln #105 Delray Beach, FL | 2.0 | 2.0 | 1005 | $2,100 | $2.09 | 11d | 1 | 0.36mi |
| 28 Seville B Delray Beach, FL | 2.0 | 2.0 | 883 | $1,950 | $2.21 | 11d | 1 | 0.37mi |
| 14556 Wiley Range Rd Delray Beach, FL | 2.0 | 2.0 | 1319 | $3,000 | $2.27 | 24d | 1 | 0.39mi |
| 14 Willowbrook Ln #101 Delray Beach, FL | 2.0 | 2.0 | 1005 | $1,700 | $1.69 | 5d | 1 | 0.40mi |
| 14534 Highland Center Way Delray Beach, FL | 2.0 | 2.0 | 1319 | $3,400 | $2.58 | 8d | 1 | 0.43mi |
| 14800 Cumberland Dr Delray Beach, FL | 2.0 | 2.0 | 1321 | $4,048 | $3.06 | 5d | 4 | 0.45mi |
| 6866 Huntington Ln #305 Delray Beach, FL | 2.0 | 2.0 | 1230 | $4,500 | $3.66 | 24d | 1 | 0.46mi |
| 92 Seville Blvd Delray Beach, FL | 2.0 | 2.0 | 880 | $1,895 | $2.15 | 24d | 1 | 0.49mi |
| 7076 Huntington Ln #608 Delray Beach, FL | 2.0 | 2.0 | 1230 | $2,600 | $2.11 | 24d | 1 | 0.50mi |
| 6234 Pointe Regal Cir Delray Beach, FL | 2.0 | 2.0 | 1217 | $3,899 | $3.20 | 24d | 1 | 0.50mi |
| 14747 Cumberland Dr #301 Delray Beach, FL | 2.0 | 2.0 | 1044 | $1,900 | $1.82 | 24d | 1 | 0.51mi |
| 6795 Huntington Ln #406 Delray Beach, FL | 2.0 | 2.0 | 990 | $2,500 | $2.53 | 21d | 1 | 0.52mi |
| 14828 Golden Jax Ln Unit 8103 Delray Beach, FL | 2.0 | 2.0 | 1321 | $3,949 | $2.99 | 5d | 1 | 0.52mi |
| 14828 Golden Jax Ln Unit 8-105 Radiance Delray Beach, FL | 2.0 | 2.0 | 1321 | $3,948 | $2.99 | 15d | 1 | 0.52mi |
| 14828 Golden Jax Ln Unit 6-105 Radiance Delray Beach, FL | 2.0 | 2.0 | 1321 | $4,148 | $3.14 | 17d | 1 | 0.52mi |
| 14509 Sloan Ridge Dr Unit 10-104 Luminosa Delray Beach, FL | 3.0 | 2.0 | 1328 | $3,827 | $2.88 | 24d | 1 | 0.52mi |
| 14723 Cumberland Dr Unit 404 B Delray Beach, FL | 1.0 | 2.0 | 912 | $1,850 | $2.03 | 24d | 1 | 0.53mi |
Listing history 13 events
-
2026-06-18days on market $318,000 Active 20 DOM
-
2026-06-17days on market $318,000 Active 19 DOM
-
2026-06-16days on market $318,000 Active 18 DOM
-
2026-06-15days on market $318,000 Active 17 DOM
-
2026-06-13days on market $318,000 Active 15 DOM
-
2026-06-09days on market $318,000 Active 11 DOM
-
2026-06-08days on market $318,000 Active 10 DOM
-
2026-06-07days on market $318,000 Active 9 DOM
-
2026-06-04days on market $318,000 Active 6 DOM
-
2026-06-03days on market $318,000 Active 5 DOM
-
2026-06-02days on market $318,000 Active 4 DOM
-
2026-06-01days on market $318,000 Active 3 DOM
-
2026-05-31days on market $318,000 Active 2 DOM
ⓘ Source: listings_history table (triggers on properties + properties_extension) + one-shot
backfill from property_details.listing_events for pre-trigger history.
Tax reassessment forecast FL · Resets to sale price
- Current annual tax
- $3,867 · $322/mo
- Projected year-2 tax
- $3,867 · $322/mo
- Expected delta
- $0/yr ($0/mo · 0.0%)
ⓘ Screening estimate from a state-policy table — verify with the county assessor before closing.
Climate risk First Street
- Flood 1/10 Low FEMA zone X (unshaded) · 0% chance over 30 yrs
- Wildfire 1/10 Low
- Heat 9/10 Extreme 5 d/yr ≥107°F today · 18 d/yr by 30 yrs out
- Wind 10/10 Extreme 99% chance of damaging wind over 30 yrs
- Air quality 2/10 Low 1 unhealthy d/yr today · 2 by 30 yrs out
Nearby sold comps map
Loading sold comps map…
Walkable amenities ~0.75 mi
Loading nearby amenities…
Taxation est. · year 1
- Rental income
- $34,434
- − Mortgage interest
- −$17,813
- − Property taxes
- −$3,867
- − Insurance
- −$1,590
- − Repairs & maintenance
- −$2,755
- − Management
- −$2,755
- − Depreciation
- −$9,251
- Taxable loss
- −$3,596
- Est. tax savings @ 24.0%
- +$863
- After-tax cash flow
- $2,598/yr
For passive investors: Depreciation is non-cash, so a rental often shows a tax loss while cash-flowing — sheltering income. Rental losses are passive: they offset passive income freely, and up to $25,000/yr can offset ordinary (W-2) income if you actively participate and your MAGI is under $100k (phasing out to $0 by $150k); unused losses carry forward. On sale, claimed depreciation is recaptured at up to 25%, and gains may owe capital-gains tax (a 1031 exchange can defer both). Figures are a year-1 estimate at your 24.0% rate — not tax advice; consult a CPA.
Schools (NCES district)
- District
- Palm Beach
- NCES district ID
- 1201500
- Math proficiency
- 46% ▼ -16.00%
- Reading proficiency
- 53% ▼ -4.00%
- Median HH income
- $53,943
- Composite
- 42.72/100
- National rank
- #3160
- State rank
- #34 of 73 in FL
Livability — Delray Beach
- Score
- 77/100
- State rank
- #202
- US rank
- #3160
Category grades
Schools grade is shown separately in the Schools card above.
Census & demographics
- County
- Palm Beach County · 1,438,312 people
- City population
- 123,167
- Metro
- Miami-Fort Lauderdale-Pompano Beach, FL
- Population (ZIP)
- 28,431
- Household income
- $80,187
- Rent vs Own
- Severe rent burden
- 494.0
Population outlook (Palm Beach County) Hauer SSP2
- Today (2025)
- 1,637,487 people
- By 2030
- 1,743,255 · +6.5%
- By 2040
- 1,948,712 · +19.0%
- By 2050
- 2,132,979 · +30.3%
- By 2075
- 2,530,027 · +54.5%
- By 2100
- 2,706,979 · +65.3%
Race, ethnicity, and origin ACS 2023
- Neighborhood character
- Predominantly White (79%)
- Race & ethnicity
- White 79% Hispanic / Latino 13% Two or more races 9% Black 4%
- Hispanic origin (detail)
- Puerto Rican 3% Dominican 1%
- Common ancestry
- Romanian 9% Scotch-Irish 9% Italian 2%
- Foreign-born
- 20% · Canada, Jamaica, Guatemala
- Languages at home
- 80% English-only · Spanish 12% Other Indo-European 2% French/Haitian/Cajun 2%
Political lean MEDSL · Palm Beach
- 2024 margin
- Toss-up / Even · D 50.0% · R 49.2%
- 2008→2024 swing
- -22.1pp toward R · 2008: 22.9pp · 2024: 0.8pp
- All cycles
- 2024: D+0.8 2020: D+12.8 2016: D+15.3 2012: D+17.0 2008: D+22.9
Not yet ingested
- Civics
- —
Market trends
- HPI YoY
- ▲ 0.69%
- Current HPI
- 242.5138
- Rent YoY
- ▲ 0.51%
- Metro
- Miami-Fort Lauderdale-Pompano Beach, FL
- State GDP YoY
- ▲ 3.28%
- F500 in state
- 36
Industry mix (Fortune 500 HQ in FL)
| Industry | F500 HQs | Revenue |
|---|---|---|
| Industrial Technology | 2 | $29B |
|
||
| Insurance | 2 | $17B |
|
||
| Retail | 1 | $60B |
|
||
| Technology Distribution | 1 | $58B |
|
||
| Homebuilding | 1 | $35B |
|
||
| Technology Manufacturing | 1 | $35B |
|
||
Price history
1 event — show timeline
- 2026-05-29 Listed $318,000 Beaches MLS
Property tax history
+7.9%/yrLatest (2025): $3,867 · +1.9% YoY. Source: county tax records.
Cash-flow waterfall
monthlySold comps — $/sqft
last 12 mo · ≤1 miLoading sold comps…