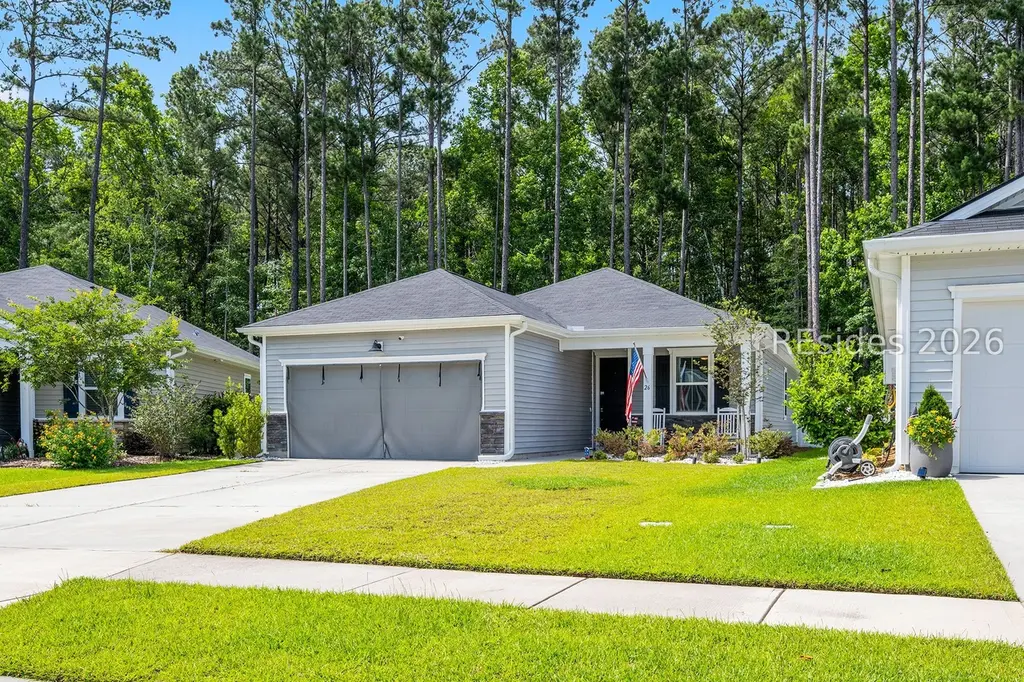
26 Wylie Ct · Bluffton, SC
Flood risk No data
- FEMA flood zone
- —
- Chance of flooding over 30 yrs
- —
- Est. flood insurance / yr
- —
Fire risk No data
- Est. fire insurance / yr
- —
Heat risk No data
- Hot days now (above threshold)
- —
- Hot days in 30 yrs
- —
Wind risk No data
- Chance of severe wind over 30 yrs
- —
Air-quality risk No data
- Unhealthy air days now
- —
- Unhealthy air days in 30 yrs
- —
Risk factors via First Street. Map © Google.
Why this score? — see what drove the D- grade
The composite is a weighted blend of 9 inputs, each scored 0–100. Each bar is that input's sub-score; the figure is the points it added to the 100-point composite (weight × sub-score).
- Cash flow +11.7/30.0
- ARV discount +4.1/15.0
- Schools +4.1/10.0
- Rent growth +3.5/5.0
- DSCR +3.4/10.0
- Livability +3.4/5.0
- Condition / age +2.5/5.0
- 1% rule +2.4/10.0
- Appreciation +0.0/10.0
$440,000
🖨 Deal sheet 📄 Offer letter ✓ Due diligence
Listing remarks MLS
This beautifully designed residence features an inviting, open-concept floor plan ideal for both relaxed family living and effortless entertaining. Large windows flood the living spaces with natural light, highlighting the thoughtful finishes and attention to detail throughout the home. Step outside to enjoy a private backyard setting, perfect for morning coffee or evening relaxation in the South Carolina climate.The property is situated in the highly desirable Lakes at New Riverside, a vibrant, master-planned community in Bluffton. Designed for an active and social lifestyle, the neighborhood boasts an impressive suite of amenities, including a spacious community clubhouse, a resort-style swimming pool, and a fitness center. Outdoor enthusiasts will appreciate the miles of scenic walking and biking trails, a five-acre park, and several pristine lakes that offer opportunities for fishing and kayaking. Positioned just minutes from the historic charm of Old Town Bluffton, pristine beaches of Hilton Head Island, and the historic streets of Savannah, Georgia, this home offers an unparalleled opportunity to experience the very best of coastal living.
Key facts
- Fitness center
- Community clubhouse
- Five-acre park
Tags
Property features AI
Finance
- HOA & community: Community amenities include clubhouse, dog park, fitness center, fire pit, picnic area, playground, pool, and gated/guard
Exterior
- Parking: Driveway; Detached or attached garage with 2 spaces (two-car garage)
- Utilities: Public water
- Home design: Faces south; Builder model: Mercer
- Construction: Vinyl siding; Composition / shingle roof
- Exterior features: Deck; Rear porch; Screened porch / enclosed porch; Patio; Porch; Fence (privacy); Sprinkler / irrigation; Paved driveway; Rain gutters; Exterior storage; Community pool
Interior
- Kitchen: Dishwasher; Disposal; Microwave; Range
- Bedrooms: Primary bedroom on main level
- Flooring: Ceramic tile; Luxury vinyl; Luxury vinyl plank
- Bathrooms: 2 full bathrooms
- Heating & cooling: Central heating (electric, heat pump); Central air conditioning (electric, heat pump)
- Interior features: Unfurnished; Ceiling fan(s); Main level primary bedroom; Multiple closets; Pull-down attic stairs; Smooth ceilings; Smart thermostat
- Laundry & utility: Washer; Dryer; Utility room; Laundry room
Neighborhood map
What this means for you Summary
Snapshot
- This is a 4-bed/2.0-bath single-family listed at $440k.
Deal economics
- At list price, monthly cash flow is $-130 ($-2k/yr) — negative.
- To cash-flow at today's rent, offer at most $417k (5.2% below list).
- To meet the 1% rule (rent ≥ 1% of price), the offer needs to be $327k (25.7% below list).
- Recommended offer: $327k (25.7% below list) — sets the bar for 1% rule.
- Cap rate 5.9% vs local median 3.2% in Bluffton — top-decile yield for the area; either an underpriced asset or a hidden risk that comps aren't pricing in. Stress-test before assuming the spread holds.
Location & tenants
- Location reads 68/100 on livability (#76 in SC) — a middle-class / working-renter tenant base. Strengths: crime A+, employment A+, housing A+; Watch: amenities F, commute F, cost of living D-.
- Beaufort 01 (town): math 42% / reading 51% proficiency, ranked #17 of 80 in SC (top 21%) — families likely to look elsewhere, expect single-tenant / working-renter base with shorter leases.
- Market conditions: Rents rising fast (+4.1%/yr); 760 active listings in the ZIP; 2 comparable units currently listed for rent nearby; solid renter incomes; 1,824 units permitted in Beaufort County in 2024 (618 in 5+ unit buildings).
- This rent runs 40% of the median local income ($99k/yr) — at the standard rent-burdened threshold; future hikes will face affordability resistance.
Forward outlook
- Local home prices are declining (-3.0%/yr); year-one equity from $3k of loan paydown is wiped out by about $13k of value loss. Plan a longer hold.
- Beaufort County population projected at +30% by 2050 — long-run rental-demand tailwind backs the buy-and-hold thesis.
Negotiation context
- It's been on market 20 days — a 2% lower offer ($433k) is reasonable based on typical stale-listing flexibility.
- 2 sale attempts with the ask held roughly flat each time — persistent listings suggest the price (not the market) is what's stuck; bring a comps-based counter.
Questions for the listing agent
- What do current leases actually rent for vs. the listed asking? Can we see a recent rent roll and the last 12 months of T-12 income?
- Is there a deadline driving the sale (1031 exchange, divorce, estate, relocation)? That informs how much negotiation room exists.
- Schools are B-rated — typically a magnet for longer-tenancy family renters. What's the average tenant stay here, and is there a school-zone premium baked into asking?
- The area grade is low — what's the realistic commute time and amenity access for the typical tenant pool here? Any planned neighborhood developments (good or bad) we should know about?
- What's the average days-on-market for RENTAL listings here right now (not sales)? A rising rental-DOM trend means longer vacancies and softer asking-rent achievability than the comps imply.
- What's the recent tenant-quality profile in this submarket — average credit score on applications, eviction rate, late-payment / NSF rate, and stable-employment percentage? A property-management company in the area should have these aggregated.
- How much new for-sale + rental construction is in the pipeline within 1–3 miles? Heavy new supply typically softens prices + rents 12–24 months out; constrained supply supports both.
Investment metrics
- 1% rule
- 0.74% ✗
- Cap rate
- 5.94%
- Cash-on-cash
- -1.26%
- DSCR
- 0.94
- GRM
- 11.2
CMA / ARV
- ARV (on-the-fly)
- $408,672
- Comps found
- 12
Show comp detail 12 sales within ~0.75 mi
| Address | Dist | Beds/Ba | Sqft | Sold | Price | $/sf | Match |
|---|---|---|---|---|---|---|---|
| 313 Hill Pond Rd | 0.35mi | 4/2.0 | 1,587 (+0%) | 3mo | $386,900 | $244 | 81 |
| 280 Hill Pond Rd | 0.38mi | 4/2.0 | 1,587 (+0%) | 3mo | $412,000 | $260 | 80 |
| 284 Hill Pond Rd | 0.38mi | 4/2.0 | 1,587 (+0%) | 3mo | $371,900 | $234 | 79 |
| 333 Hill Pond Rd | 0.37mi | 4/2.0 | 1,587 (+0%) | 4mo | $409,900 | $258 | 79 |
| 309 Hill Pond Rd | 0.36mi | 4/2.0 | 1,587 (+0%) | 6mo | $408,690 | $258 | 78 |
| 301 Hill Pond Rd | 0.38mi | 4/2.0 | 1,587 (+0%) | 5mo | $389,900 | $246 | 78 |
| 332 Hill Pond Rd | 0.37mi | 4/2.0 | 1,587 (+0%) | 7mo | $424,900 | $268 | 76 |
| 44 Parr Ct | 0.13mi | 3/2.0 (-1) | 1,437 (-9%) | 3mo | $380,000 | $264 | 71 |
| 288 Hill Pond Rd | 0.37mi | 3/2.0 (-1) | 1,428 (-10%) | 4mo | $379,900 | $266 | 58 |
| 337 Hill Pond Rd | 0.38mi | 3/2.0 (-1) | 1,428 (-10%) | 4mo | $364,900 | $256 | 57 |
| 12 Hartwell Rd | 0.37mi | 3/2.0 (-1) | 1,780 (+12%) | 1mo | $405,000 | $228 | 56 |
| 123 Scarlet Oak | 0.70mi | 3/2.5 (-1) | 1,576 (-0%) | 6mo | $359,500 | $228 | 54 |
Match score weights: distance 35% · size 25% · config 20% · recency 20%. Top-matched comps best support the ARV.
Projected returns pro-forma
-3.0% appreciation · 4.06% rent growth · sell at horizon
- IRR
- -17.4%
- Equity multiple
- 0.38×
- Total profit
- $-76,195
- Equity at exit
- $65,605
- IRR
- -7.8%
- Equity multiple
- 0.49×
- Total profit
- $-62,849
- Equity at exit
- $38,043
Cash invested: $123,200 (down + closing). Projections, not guarantees.
Landlord ↔ Tenant lean methodology
- Overall (STATE)
- 90 Strongly Landlord-Friendly
- State South Carolina
- 90 Strongly Landlord-Friendly · R+6
- County
- — inherits STATE
- City
- — inherits STATE
ZIP-level market 29910
- Home prices YoY
- -22.9%
- Rents YoY
- 4.1%
- Active inventory
- 760
- Price-to-rent
- 11.2×
Monthly cashflow live
- Estimated rent
- $3,267 medium interval (Pro) →
- Mortgage (P&I)
- −$2,307
- Tax from tax record
- −$220 /mo · $2,642/yr
- Insurance
- −$183
- HOA
- −$0
- Vacancy / Maint / Mgmt
- −$686
- Net cashflow
- $-130
Break-even live
UW: 25.0% down · 7.5% · 30yr · 1.5% tax · 5.0% vac · 8.0% maint · 8.0% mgmt
Financing live
Cash to close
- Down payment
- $110,000
- Closing costs
- $13,200
- Reserves months
- —
- Total cash needed
- —
Loan-product check · same deal, 3 products live
Conventional
25% down · 7.5% · 30yr
- Down + closing
- —
- Monthly P&I
- —
- Monthly cashflow
- —
- DSCR
- —
- Eligible?
- —
Personal DTI + credit; lowest rate.
DSCR
20% down · 8.5% · 30yr
- Down + closing
- —
- Monthly P&I
- —
- Monthly cashflow
- —
- DSCR
- —
- Eligible?
- —
No personal income docs; deal must DSCR.
Hard money
10% down · 12.0% · 12mo
- Down + closing
- —
- Monthly P&I
- —
- Monthly cashflow
- —
- DSCR
- —
- Eligible?
- —
Short-term bridge; refi at stabilization.
Rent comps 2 comps
| Address | Beds | Baths | Sqft | Rent | $/sqft | DOM | Units | Dist |
|---|---|---|---|---|---|---|---|---|
| 106 Mainland Lakes Dr Bluffton, SC | 3.0–4.0 | 2.0–2.5 | 1657 | $3,005 | $1.81 | 13d | 29 | 0.13mi |
| 41 Jocassee Rd Bluffton, SC | 4.0 | 2.0 | 1903 | $3,495 | $1.84 | 13d | 1 | 0.22mi |
Listing history 17 events
-
2026-06-18days on market $440,000 Active 20 DOM
-
2026-06-17days on market $440,000 Active 19 DOM
-
2026-06-16days on market $440,000 Active 18 DOM
-
2026-06-15days on market $440,000 Active 17 DOM
-
2026-06-14days on market $440,000 Active 15 DOM
-
2026-06-13days on market $440,000 Active 14 DOM
-
2026-06-10days on market $440,000 Active 12 DOM
-
2026-06-09days on market $440,000 Active 11 DOM
-
2026-06-08days on market $440,000 Active 10 DOM
-
2026-06-07days on market $440,000 Active 9 DOM
-
2026-06-05days on market $440,000 Active 6 DOM
-
2026-06-03days on market $440,000 Active 5 DOM
-
2026-06-02days on market $440,000 Active 4 DOM
-
2026-06-01days on market $440,000 Active 3 DOM
-
2026-05-31days on market $440,000 Active 2 DOM
-
2026-05-30remarks 691-char remark
-
2026-05-30$440,000 Active 1 DOM
ⓘ Source: listings_history table (triggers on properties + properties_extension) + one-shot
backfill from property_details.listing_events for pre-trigger history.
Tax reassessment forecast SC · Resets to sale price
- Current annual tax
- $2,642 · $220/mo
- Projected year-2 tax
- $2,642 · $220/mo
- Expected delta
- $0/yr ($0/mo · 0.0%)
ⓘ Screening estimate from a state-policy table — verify with the county assessor before closing.
Nearby sold comps map
Loading sold comps map…
Walkable amenities ~0.75 mi
Loading nearby amenities…
Taxation est. · year 1
- Rental income
- $39,208
- − Mortgage interest
- −$24,647
- − Property taxes
- −$2,642
- − Insurance
- −$2,200
- − Repairs & maintenance
- −$3,137
- − Management
- −$3,137
- − Depreciation
- −$12,800
- Taxable loss
- −$9,355
- Est. tax savings @ 24.0%
- +$2,245
- After-tax cash flow
- $688/yr
For passive investors: Depreciation is non-cash, so a rental often shows a tax loss while cash-flowing — sheltering income. Rental losses are passive: they offset passive income freely, and up to $25,000/yr can offset ordinary (W-2) income if you actively participate and your MAGI is under $100k (phasing out to $0 by $150k); unused losses carry forward. On sale, claimed depreciation is recaptured at up to 25%, and gains may owe capital-gains tax (a 1031 exchange can defer both). Figures are a year-1 estimate at your 24.0% rate — not tax advice; consult a CPA.
Schools (NCES district)
- District
- Beaufort 01
- NCES district ID
- 4501110
- Math proficiency
- 42% ▼ -8.00%
- Reading proficiency
- 51% ▲ 2.00%
- Median HH income
- $57,430
- Composite
- 40.56/100
- National rank
- #3699
- State rank
- #17 of 80 in SC
Livability — Bluffton
- Score
- 68/100
- State rank
- #76
- US rank
- #8936
Category grades
Schools grade is shown separately in the Schools card above.
Census & demographics
- Census place
- Bluffton, SC
- County
- Beaufort County · 163,770 people
- City population
- 77,022
- Metro
- Hilton Head Island-Bluffton, SC
- Population (ZIP)
- 53,019
- Household income
- $98,912
- Rent vs Own
- Severe rent burden
- 1146.0
Population outlook (Beaufort County) Hauer SSP2
- Today (2025)
- 211,915 people
- By 2030
- 227,272 · +7.2%
- By 2040
- 253,861 · +19.8%
- By 2050
- 275,126 · +29.8%
- By 2075
- 311,022 · +46.8%
- By 2100
- 321,286 · +51.6%
Race, ethnicity, and origin ACS 2023
- Neighborhood character
- Predominantly White (70%)
- Race & ethnicity
- White 70% Hispanic / Latino 18% Two or more races 8% Black 7%
- Hispanic origin (detail)
- Mexican 7% Puerto Rican 3%
- Common ancestry
- Romanian 4% Slovak 3% Lithuanian 3%
- Foreign-born
- 9% · Canada, Jamaica, Dominican Republic
- Languages at home
- 84% English-only · Spanish 13% Other Indo-European 1% French/Haitian/Cajun 1%
Political lean MEDSL · Beaufort
- 2024 margin
- R (+14.5) · D 42.1% · R 56.6% · Other 1.2%
- 2008→2024 swing
- -3.7pp toward R · 2008: -10.8pp · 2024: -14.5pp
- All cycles
- 2024: R+14.5 2020: R+10.0 2016: R+14.3 2012: R+17.5 2008: R+10.8
Not yet ingested
- Civics
- —
Market trends
- HPI YoY
- ▼ -72.80%
- Current HPI
- 245.8086
- Rent YoY
- ▲ 4.06%
- Metro
- Hilton Head Island-Bluffton, SC
- State GDP YoY
- ▲ 4.51%
- F500 in state
- 2
Industry mix (Fortune 500 HQ in SC)
| Industry | F500 HQs | Revenue |
|---|---|---|
| Packaging | 1 | $7B |
|
||
Price history
+0.0% since first listed2 events — show timeline
- 2026-05-29 Listed $440,000 RSMLS
- 2026-05-29 Listed $440,000 LRMLS
Property tax history
+53.1%/yrLatest (2025): $2,642 · -61.1% YoY. Source: county tax records.
Cash-flow waterfall
monthlySold comps — $/sqft
last 12 mo · ≤1 miLoading sold comps…