2320 Bassett St · Benton, AR
Flood risk 1/10 · Minimal
- FEMA flood zone
- X (unshaded)
- Chance of flooding over 30 yrs
- 0.0%
- Est. flood insurance / yr
- $507 – $1,088
Fire risk 5/10 · Moderate
- Est. fire insurance / yr
- $1,499 – $2,785
Heat risk 6/10 · Moderate
- Hot days now (above 110°F)
- 7 days/yr
- Hot days in 30 yrs
- 19 days/yr
Wind risk 4/10 · Minor
- Chance of severe wind over 30 yrs
- 9.0%
Air-quality risk 2/10 · Minimal
- Unhealthy air days now
- 0 days/yr
- Unhealthy air days in 30 yrs
- 1 days/yr
Risk factors via First Street. Map © Google.
Why this score? — see what drove the D- grade
The composite is a weighted blend of 9 inputs, each scored 0–100. Each bar is that input's sub-score; the figure is the points it added to the 100-point composite (weight × sub-score).
- Cash flow +10.9/30.0
- ARV discount +7.0/15.0
- Schools +4.1/10.0
- Condition / age +4.0/5.0
- Rent growth +3.6/5.0
- 1% rule +3.3/10.0
- Livability +3.3/5.0
- DSCR +3.2/10.0
- Appreciation +0.0/10.0
$221,400
🖨 Deal sheet 📄 Offer letter ✓ Due diligence
Listing remarks
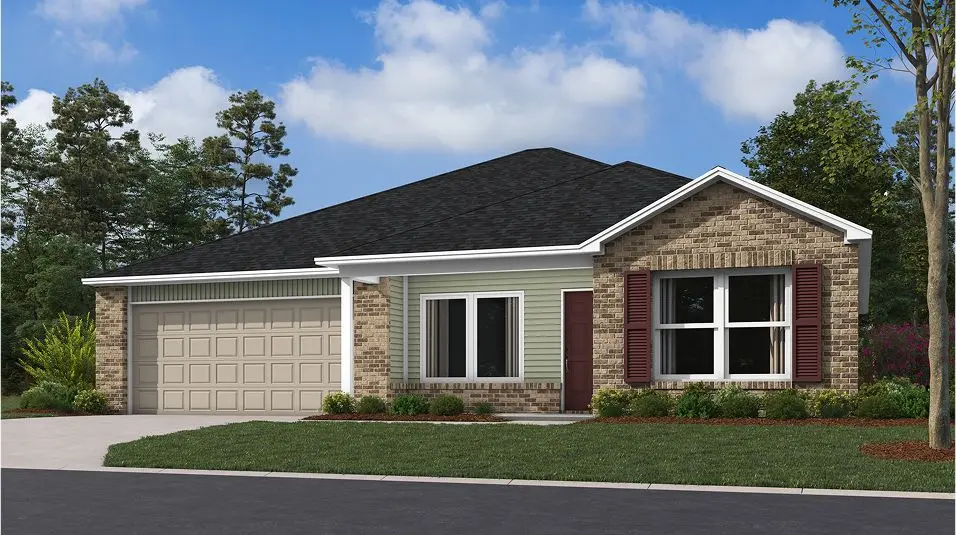
Discover the captivating Carnegie II plan, distinguished by its inviting covered entryway and beautifully landscaped front yard that exudes curb appeal. This thoughtfully designed home encompasses 4 bedrooms and 2 bathrooms, providing ample space for comfort and privacy. The spacious living room offers a welcoming environment for relaxation and gatherings. The kitchen is a chef's delight, equipped with energy-efficient appliances, abundant counterspace, and a convenient pantry for storage. The adjacent laundry room, situated just off the garage, ensures practicality for families of any size. The master suite includes a luxurious walk-in closet, enhancing the home's appeal and functionality.
Key facts
- Covered entryway
- Convenient pantry
- 6,969 sq ft lot
Tags
Property features AI
Finance
- Financial info: List price $221,400
Exterior
- Parking: 2 total parking spaces; 2-car garage
- Home design: Spec new construction, RC Carnegie II plan; Active listing
- Exterior features: Address: 2320 Bassett St, Benton, AR 72019
Interior
- Bedrooms: 4 bedrooms
- Bathrooms: 2 full bathrooms
- Interior features: Living area of 1,470
Neighborhood map
What this means for you Summary
Snapshot
- This is a 4-bed/2.0-bath single-family listed at $221k. Condition is rated good.
Deal economics
- At list price, monthly cash flow is $-98 ($-1k/yr) — negative.
- To cash-flow at today's rent, offer at most $207k (6.4% below list).
- To meet the 1% rule (rent ≥ 1% of price), the offer needs to be $183k (17.4% below list).
- Recommended offer: $183k (17.4% below list) — sets the bar for 1% rule.
- Cap rate 5.8% vs local median 4.5% in Benton — meaningfully above typical; check what's discounted (condition, days-on-market, listing class) to confirm the premium yield is real.
Location & tenants
- Location reads 66/100 on livability (#119 in AR) — a middle-class / working-renter tenant base. Strengths: cost of living A+, housing A+; Watch: crime D, amenities F, commute F.
- Benton School District (suburban): math 51% / reading 43% proficiency, ranked #25 of 238 in AR (top 10%) — families likely to look elsewhere, expect single-tenant / working-renter base with shorter leases.
- Market conditions: Rents rising fast (+4.5%/yr); 244 active listings in the ZIP; 1 comparable units currently listed for rent nearby; solid renter incomes; 446 units permitted in Saline County in 2024 (0 in 5+ unit buildings).
Forward outlook
- Local home prices are declining (-3.0%/yr); year-one equity from $2k of loan paydown is wiped out by about $7k of value loss. Plan a longer hold.
- Saline County population projected at +39% by 2050 — long-run rental-demand tailwind backs the buy-and-hold thesis.
Negotiation context
- Only 8 days on market — expect competitive offers; lowballing is unlikely to land.
Risks & watch-outs
- Climate carrying-cost: moderate wildfire risk; extreme-heat days projected 7→19/yr by 2055 (HVAC capex compounding) — expect insurance premiums to compound above CPI over the hold.
Questions for the listing agent
- What do current leases actually rent for vs. the listed asking? Can we see a recent rent roll and the last 12 months of T-12 income?
- What does the HOA fee cover, when was the last increase, and are there any pending special assessments or reserve-fund shortfalls?
- Is there a deadline driving the sale (1031 exchange, divorce, estate, relocation)? That informs how much negotiation room exists.
- Crime grade is D in this area — have there been break-ins, vandalism, or insurance claims at this property in the last 3 years? What carrier currently insures it and at what premium?
- The area grade is low — what's the realistic commute time and amenity access for the typical tenant pool here? Any planned neighborhood developments (good or bad) we should know about?
- What's the average days-on-market for RENTAL listings here right now (not sales)? A rising rental-DOM trend means longer vacancies and softer asking-rent achievability than the comps imply.
- What's the recent tenant-quality profile in this submarket — average credit score on applications, eviction rate, late-payment / NSF rate, and stable-employment percentage? A property-management company in the area should have these aggregated.
- How much new for-sale + rental construction is in the pipeline within 1–3 miles? Heavy new supply typically softens prices + rents 12–24 months out; constrained supply supports both.
Investment metrics
- 1% rule
- 0.83% ✗
- Cap rate
- 5.76%
- Cash-on-cash
- -1.89%
- DSCR
- 0.92
- GRM
- 10.1
CMA / ARV
- ARV (on-the-fly)
- $219,030
- Comps found
- 12
Show comp detail 12 sales within ~0.75 mi
| Address | Dist | Beds/Ba | Sqft | Sold | Price | $/sf | Match |
|---|---|---|---|---|---|---|---|
| 6648 Hollywood Ave | 0.13mi | 4/2.0 | 1,470 (0%) | 1mo | $215,600 | $147 | 93 |
| 6673 Hollywood Ave | 0.16mi | 4/2.0 | 1,470 (0%) | 1mo | $215,900 | $147 | 92 |
| 6657 Hollywood Ave | 0.16mi | 4/2.0 | 1,470 (0%) | 1mo | $210,000 | $143 | 92 |
| 6680 Hollywood Ave | 0.13mi | 3/2.0 (-1) | 1,523 (+4%) | 1mo | $217,850 | $143 | 82 |
| 6642 Hollywood Ave | 0.13mi | 3/2.0 (-1) | 1,523 (+4%) | 1mo | $217,000 | $142 | 82 |
| 6681 Hollywood Ave | 0.16mi | 3/2.0 (-1) | 1,422 (-3%) | 1mo | $211,900 | $149 | 82 |
| 6649 Hollywood Ave | 0.16mi | 3/2.0 (-1) | 1,422 (-3%) | 1mo | $211,500 | $149 | 81 |
| 5017 Cobblefield Cv | 0.12mi | 3/2.0 (-1) | 1,355 (-8%) | 2mo | $206,000 | $152 | 75 |
| 6656 Hollywood Ave | 0.13mi | 3/2.0 (-1) | 1,355 (-8%) | 1mo | $209,500 | $155 | 75 |
| 5009 Cobblefield Cv | 0.13mi | 4/2.0 | 1,652 (+12%) | 2mo | $218,900 | $133 | 72 |
| 950 James Madison Dr | 0.55mi | 3/2.0 (-1) | 1,314 (-11%) | 1mo | $205,000 | $156 | 50 |
| 5741 John Hancock Dr | 0.70mi | 3/2.0 (-1) | 1,267 (-14%) | 1mo | $188,800 | $149 | 38 |
Match score weights: distance 35% · size 25% · config 20% · recency 20%. Top-matched comps best support the ARV.
Projected returns pro-forma
-3.0% appreciation · 4.53% rent growth · sell at horizon
- IRR
- -17.7%
- Equity multiple
- 0.37×
- Total profit
- $-39,210
- Equity at exit
- $33,011
- IRR
- -7.1%
- Equity multiple
- 0.52×
- Total profit
- $-29,915
- Equity at exit
- $19,143
Cash invested: $61,992 (down + closing). Projections, not guarantees.
Landlord ↔ Tenant lean methodology
- Overall (STATE)
- 92 Strongly Landlord-Friendly
- State Arkansas
- 92 Strongly Landlord-Friendly · R+14
- County
- — inherits STATE
- City
- — inherits STATE
ZIP-level market 72019
- Home prices YoY
- -12.2%
- Rents YoY
- 4.5%
- Active inventory
- 244
- Price-to-rent
- 10.1×
Monthly cashflow live
- Estimated rent
- $1,829 medium interval (Pro) →
- Mortgage (P&I)
- −$1,161
- Tax est. 1.5%
- −$277 /mo · $3,321/yr
- Insurance
- −$92
- HOA
- −$13
- Vacancy / Maint / Mgmt
- −$384
- Net cashflow
- $-98
Break-even live
UW: 25.0% down · 7.5% · 30yr · 1.5% tax · 5.0% vac · 8.0% maint · 8.0% mgmt
Financing live
Cash to close
- Down payment
- $55,350
- Closing costs
- $6,642
- Reserves months
- —
- Total cash needed
- —
Loan-product check · same deal, 3 products live
Conventional
25% down · 7.5% · 30yr
- Down + closing
- —
- Monthly P&I
- —
- Monthly cashflow
- —
- DSCR
- —
- Eligible?
- —
Personal DTI + credit; lowest rate.
DSCR
20% down · 8.5% · 30yr
- Down + closing
- —
- Monthly P&I
- —
- Monthly cashflow
- —
- DSCR
- —
- Eligible?
- —
No personal income docs; deal must DSCR.
Hard money
10% down · 12.0% · 12mo
- Down + closing
- —
- Monthly P&I
- —
- Monthly cashflow
- —
- DSCR
- —
- Eligible?
- —
Short-term bridge; refi at stabilization.
Rent comps 1 comps
| Address | Beds | Baths | Sqft | Rent | $/sqft | DOM | Units | Dist |
|---|---|---|---|---|---|---|---|---|
| 3348 Wilshire Blvd Benton, AR | 3.0 | 2.0 | 1633 | $1,620 | $0.99 | 44d | 1 | 0.25mi |
HOA detail
- Monthly dues
- $13 · $156/yr
Listing history 10 events
-
2026-06-18days on market $221,400 Active 8 DOM
-
2026-06-17remarks 699-char remark
-
2026-06-17days on market $221,400 Active 7 DOM
-
2026-06-17days on market $221,400 Active 8 DOM
-
2026-06-16days on market $221,400 Active 7 DOM
-
2026-06-15days on market $221,400 Active 6 DOM
-
2026-06-14days on market $221,400 Active 4 DOM
-
2026-06-13days on market $221,400 Active 3 DOM
-
2026-06-10remarks 333-char remark
-
2026-06-10$221,400 Active 1 DOM
ⓘ Source: listings_history table (triggers on properties + properties_extension) + one-shot
backfill from property_details.listing_events for pre-trigger history.
Climate risk First Street
- Flood 1/10 Low FEMA zone X (unshaded) · 0% chance over 30 yrs
- Wildfire 5/10 Major
- Heat 6/10 Major 7 d/yr ≥110°F today · 19 d/yr by 30 yrs out
- Wind 4/10 Moderate 9% chance of damaging wind over 30 yrs
- Air quality 2/10 Low 0 unhealthy d/yr today · 1 by 30 yrs out
Nearby sold comps map
Loading sold comps map…
Walkable amenities ~0.75 mi
Loading nearby amenities…
Taxation est. · year 1
- Rental income
- $21,953
- − Mortgage interest
- −$12,402
- − Property taxes
- −$3,321
- − Insurance
- −$1,107
- − Repairs & maintenance
- −$1,756
- − Management
- −$1,756
- − HOA
- −$156
- − Depreciation
- −$6,441
- Taxable loss
- −$4,986
- Est. tax savings @ 24.0%
- +$1,197
- After-tax cash flow
- $23/yr
For passive investors: Depreciation is non-cash, so a rental often shows a tax loss while cash-flowing — sheltering income. Rental losses are passive: they offset passive income freely, and up to $25,000/yr can offset ordinary (W-2) income if you actively participate and your MAGI is under $100k (phasing out to $0 by $150k); unused losses carry forward. On sale, claimed depreciation is recaptured at up to 25%, and gains may owe capital-gains tax (a 1031 exchange can defer both). Figures are a year-1 estimate at your 24.0% rate — not tax advice; consult a CPA.
Condition & rehab AI · 13 photos
This home is in good condition with a good condition score of 80. It has a cosmetic rehab level and is move-in ready with minor updates that would significantly increase its resale and rental value.
Value-add opportunities
- Both Painting exterior brick and updating landscaping — Enhances curb appeal and resale value
- Resale Updating kitchen backsplash — Modernizes kitchen and adds value
- Resale Upgrading bathroom fixtures — Improves bathroom aesthetics and functionality
Renovation cost estimate screening
Value-add ROI direction
- Both Painting exterior brick and updating landscaping — Enhances curb appeal and resale value ↑
- Resale Updating kitchen backsplash — Modernizes kitchen and adds value ↑
- Resale Upgrading bathroom fixtures — Improves bathroom aesthetics and functionality ↑
ⓘ Cost ranges are severity-bucket heuristics (US national rule-of-thumb). Get contractor quotes + a written scope before underwriting a rehab budget.
Schools (NCES district)
- District
- Benton School District
- NCES district ID
- 0502960
- Math proficiency
- 51% ▼ -10.00%
- Reading proficiency
- 43% ▼ -10.00%
- Median HH income
- $51,870
- Composite
- 40.52/100
- National rank
- #3707
- State rank
- #25 of 238 in AR
Livability — Benton
- Score
- 66/100
- State rank
- #119
- US rank
- #11460
Category grades
Schools grade is shown separately in the Schools card above.
Census & demographics
- County
- Saline County · 77,216 people
- City population
- 58,767
- Metro
- Little Rock-North Little Rock-Conway, AR
- Population (ZIP)
- 30,055
- Household income
- $87,869
- Rent vs Own
- Severe rent burden
- 331.0
Population outlook (Saline County) Hauer SSP2
- Today (2025)
- 140,141 people
- By 2030
- 151,233 · +7.9%
- By 2040
- 173,100 · +23.5%
- By 2050
- 194,368 · +38.7%
- By 2075
- 245,295 · +75.0%
- By 2100
- 279,117 · +99.2%
Race, ethnicity, and origin ACS 2023
- Neighborhood character
- Predominantly White (83%)
- Race & ethnicity
- White 83% Hispanic / Latino 8% Two or more races 5% Black 3% Asian 2%
- Hispanic origin (detail)
- Mexican 6%
- Common ancestry
- Italian 3% Slovak 2% Lithuanian 2%
- Foreign-born
- 3% · Canada, China, Vietnam
- Languages at home
- 92% English-only · Spanish 6% Vietnamese 1%
Political lean MEDSL · Saline
- 2024 margin
- Solid R (+40.1) · D 28.8% · R 69.0% · Other 2.2%
- 2008→2024 swing
- +0.8pp no change · 2008: -41.0pp · 2024: -40.1pp
- All cycles
- 2024: R+40.1 2020: R+41.2 2016: R+43.5 2012: R+42.7 2008: R+41.0
Not yet ingested
- Civics
- —
Market trends
- HPI YoY
- ▼ -29.95%
- Current HPI
- 215.1912
- Rent YoY
- ▲ 4.53%
- Metro
- Little Rock-North Little Rock-Conway, AR
- State GDP YoY
- ▲ 3.80%
- F500 in state
- 10
Industry mix (Fortune 500 HQ in AR)
| Industry | F500 HQs | Revenue |
|---|---|---|
| Retail | 1 | $681B |
|
||
| Food / Agriculture | 1 | $53B |
|
||
| Retail / Energy | 1 | $22B |
|
||
| Transportation / Logistics | 1 | $12B |
|
||
| Energy | 1 | $4B |
|
||
Cash-flow waterfall
monthlySold comps — $/sqft
last 12 mo · ≤1 miLoading sold comps…