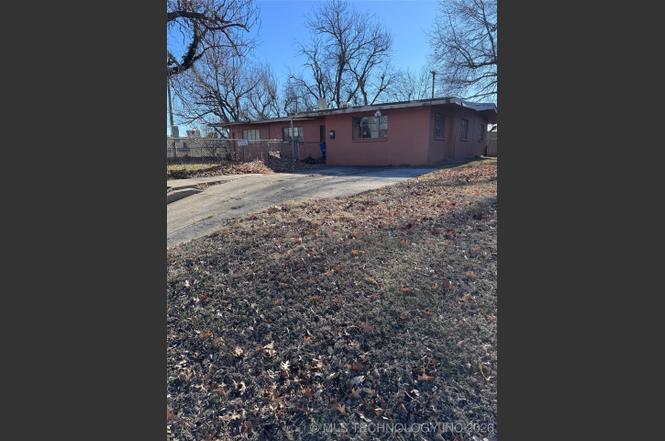
3812 E 28th St · Tulsa, OK
Flood risk 1/10 · Minimal
- FEMA flood zone
- X (unshaded)
- Chance of flooding over 30 yrs
- 0.0%
- Est. flood insurance / yr
- $473 – $860
Fire risk 1/10 · Minimal
- Est. fire insurance / yr
- $2,463 – $4,575
Heat risk 6/10 · Moderate
- Hot days now (above 110°F)
- 7 days/yr
- Hot days in 30 yrs
- 18 days/yr
Wind risk 2/10 · Minimal
- Chance of severe wind over 30 yrs
- 4.0%
Air-quality risk 2/10 · Minimal
- Unhealthy air days now
- 1 days/yr
- Unhealthy air days in 30 yrs
- 1 days/yr
Risk factors via First Street. Map © Google.
Why this score? — see what drove the B- grade
The composite is a weighted blend of 9 inputs, each scored 0–100. Each bar is that input's sub-score; the figure is the points it added to the 100-point composite (weight × sub-score).
- Cash flow +30.0/30.0
- DSCR +10.0/10.0
- 1% rule +8.3/10.0
- ARV discount +7.5/15.0
- Rent growth +4.1/5.0
- Livability +3.8/5.0
- Condition / age +2.5/5.0
- Schools +0.8/10.0
- Appreciation +0.0/10.0
$140,000
🖨 Deal sheet 📄 Offer letter ✓ Due diligence
Listing remarks
Solid block construction 4 bedroom, 1.5 bath home located in a prime Midtown Tulsa area with quick access to Highway 51 and US-64. Situated on a corner lot, this property offers strong upside potential. Functional layout includes an enclosed front foyer leading into an open living, dining, and kitchen area, plus a separate east-side den/add-on. Large windows bring in natural light throughout. Roof is approximately 10 years old. Main HVAC system (2000) is not operational. Secondary HVAC unit serving the den/add-on is reported to be functioning. Backyard includes a large storage shed; small shed excluded from sale. Property is being sold AS-IS, with seller making no repairs or improvements. B
Key facts
- Storage shed
- Corner lot
- Oversized windows
Tags
Property features AI
Exterior
- Parking: Concrete driveway
- Security: No safety shelter
- Utilities: Public water; Public sewer; Electricity available; Natural gas available; Cable available; Phone available
- Home design: Single-story; Faces north; Slab foundation; Block construction
- Construction: Block construction; Slab foundation; Built according to public records
- Exterior features: Concrete driveway; Corner lot; Chain link fence (full); Shed(s)
Interior
- Kitchen: Laminate counters; Electric range connection
- Bedrooms: Bonus room (additional room)
- Flooring: Carpet; Tile
- Bathrooms: 1 full bathroom; 1 half bathroom
- Heating & cooling: Central heating (gas, multiple units); Central air conditioning (two units)
- Interior features: Accessible entrance; Ceiling fan(s); Laminate counters; Aluminum-framed windows; Electric range connection
- Laundry & utility: Washer hookup; Electric dryer hookup; Gas water heater
Neighborhood map
What this means for you Summary
Snapshot
- This is a 4-bed/2.0-bath single-family listed at $140k.
Deal economics
- At list price, monthly cash flow is $554 ($7k/yr) — positive.
- The deal already cash-flows at list — no discount required.
- Meets the 1% rule at list price ($2k rent vs $140k).
- Recommended offer: $123k (12.0% below list) — sets the bar for market timing.
- Cap rate 11.0% vs local median 3.9% in Tulsa — top-decile yield for the area; either an underpriced asset or a hidden risk that comps aren't pricing in. Stress-test before assuming the spread holds.
Location & tenants
- Location reads 75/100 on livability (#13 in OK, #4,058 nationally) — a middle-class / working-renter tenant base. Strengths: amenities A+, commute A+, cost of living A+; Watch: schools F, crime F, employment D-.
- Tulsa (urban): math 7% / reading 12% proficiency, ranked #250 of 270 in OK (top 93%) — low school quality limits family demand, transient renter base, plan for 1-2y turnover; 76% free/reduced lunch — lower-income household profile, screen leases tightly.
- Market conditions: Rents rising fast (+6.2%/yr); 142 active listings in the ZIP; 8 comparable units currently listed for rent nearby; rentals leasing fast (median 12d on market — plan ~1-2 weeks tenant-placement turnaround); solid renter incomes; 2,818 units permitted in Tulsa County in 2024 (518 in 5+ unit buildings).
Forward outlook
- Local home prices are declining (-3.0%/yr); year-one equity from $968 of loan paydown is wiped out by about $4k of value loss. Plan a longer hold.
- Tulsa County population projected at +30% by 2050 — long-run rental-demand tailwind backs the buy-and-hold thesis.
- At projected returns (-3.0% appreciation + 6.2% rent growth), your $39k cash investment doubles in ~6 years — after that, you're playing with house money.
Negotiation context
- It's been on market 142 days — a 12% lower offer ($123k) is reasonable based on typical stale-listing flexibility.
- 4 sale attempts; this cycle's ask has dropped $10k (7%) from the opening price — seller is motivated, your offer sets the floor, not the list.
- Current owner paid $85k; list at $140k implies a 65% gain — meaningful room to come down on a strong offer.
Risks & watch-outs
- Watch-outs: built in 1950 — expect roof / HVAC / electrical / plumbing capex.
- Climate carrying-cost: extreme-heat days projected 7→18/yr by 2055 (HVAC capex compounding) — expect insurance premiums to compound above CPI over the hold.
Questions for the listing agent
- It's been on market 142 days. Have you received any prior offers? Is the seller open to a 12% concession, seller financing, or rate buy-down credit?
- Built in 1950 — when were the roof, HVAC, electrical panel, plumbing, and water heater last replaced?
- Why hasn't it sold? Are there any deal-killer items the seller is aware of (foundation, flood, title, zoning, code violations)?
- Is there a deadline driving the sale (1031 exchange, divorce, estate, relocation)? That informs how much negotiation room exists.
- Schools are F-rated, which usually means shorter tenancies and higher turnover. Who's the typical renter profile here, and what's been the actual vacancy rate?
- Crime grade is F in this area — have there been break-ins, vandalism, or insurance claims at this property in the last 3 years? What carrier currently insures it and at what premium?
- What's the average days-on-market for RENTAL listings here right now (not sales)? A rising rental-DOM trend means longer vacancies and softer asking-rent achievability than the comps imply.
- What's the recent tenant-quality profile in this submarket — average credit score on applications, eviction rate, late-payment / NSF rate, and stable-employment percentage? A property-management company in the area should have these aggregated.
- How much new for-sale + rental construction is in the pipeline within 1–3 miles? Heavy new supply typically softens prices + rents 12–24 months out; constrained supply supports both.
Investment metrics
- 1% rule
- 1.33% ✓
- Cap rate
- 11.04%
- Cash-on-cash
- 16.94%
- DSCR
- 1.75
- GRM
- 6.3
CMA / ARV
- ARV (on-the-fly)
- $300,246
- Comps found
- 12
Show comp detail 12 sales within ~0.75 mi
| Address | Dist | Beds/Ba | Sqft | Sold | Price | $/sf | Match |
|---|---|---|---|---|---|---|---|
| 4222 E 26th St | 0.33mi | 3/2.0 (-1) | 1,817 (-1%) | 2mo | $399,800 | $220 | 75 |
| 3722 E 27th Pl | 0.09mi | 3/2.5 (-1) | 1,590 (-14%) | 3mo | $197,500 | $124 | 64 |
| 4921 E 26th St | 0.73mi | 4/2.0 | 1,817 (-1%) | 2mo | $346,100 | $190 | 62 |
| 4916 E 27th Pl | 0.68mi | 4/2.0 | 1,741 (-6%) | 3mo | $231,500 | $133 | 57 |
| 2204 S Oswego Pl | 0.66mi | 3/2.5 (-1) | 1,774 (-4%) | 1mo | $225,000 | $127 | 55 |
| 4103 E 23rd St | 0.58mi | 3/2.0 (-1) | 1,699 (-8%) | 0mo | $277,500 | $163 | 55 |
| 4125 E 22nd St | 0.71mi | 4/2.0 | 1,722 (-6%) | 7mo | $276,000 | $160 | 50 |
| 3518 S New Haven Ave | 0.65mi | 3/3.0 (-1) | 1,772 (-4%) | 9mo | $275,000 | $155 | 47 |
| 2333 S Florence Ave | 0.65mi | 3/2.0 (-1) | 1,712 (-7%) | 8mo | $346,000 | $202 | 46 |
| 2163 S Sandusky Ave | 0.70mi | 3/1.5 (-1) | 1,682 (-9%) | 3mo | $275,000 | $163 | 43 |
| 2607 S Florence Dr | 0.47mi | 3/2.0 (-1) | 1,584 (-14%) | 10mo | $307,000 | $194 | 42 |
| 3536 S Marion Ave | 0.70mi | 3/2.5 (-1) | 2,012 (+9%) | 4mo | $300,000 | $149 | 41 |
Match score weights: distance 35% · size 25% · config 20% · recency 20%. Top-matched comps best support the ARV.
Projected returns pro-forma
-3.0% appreciation · 6.24% rent growth · sell at horizon
- IRR
- 11.7%
- Equity multiple
- 1.48×
- Total profit
- $18,825
- Equity at exit
- $20,874
- IRR
- 23.0%
- Equity multiple
- 3.28×
- Total profit
- $89,233
- Equity at exit
- $12,105
Cash invested: $39,200 (down + closing). Projections, not guarantees.
Landlord ↔ Tenant lean methodology
- Overall (STATE)
- 83 Strongly Landlord-Friendly
- State Oklahoma
- 83 Strongly Landlord-Friendly · R+20
- County
- — inherits STATE
- City
- — inherits STATE
ZIP-level market 74114
- Rents YoY
- 6.2%
- Active inventory
- 142
- Price-to-rent
- 6.3×
Monthly cashflow live
- Estimated rent
- $1,860 high interval (Pro) →
- Mortgage (P&I)
- −$734
- Tax from tax record
- −$123 /mo · $1,480/yr
- Insurance
- −$58
- HOA
- −$0
- Vacancy / Maint / Mgmt
- −$391
- Net cashflow
- $554
Break-even live
UW: 25.0% down · 7.5% · 30yr · 1.5% tax · 5.0% vac · 8.0% maint · 8.0% mgmt
Financing live
Cash to close
- Down payment
- $35,000
- Closing costs
- $4,200
- Reserves months
- —
- Total cash needed
- —
Loan-product check · same deal, 3 products live
Conventional
25% down · 7.5% · 30yr
- Down + closing
- —
- Monthly P&I
- —
- Monthly cashflow
- —
- DSCR
- —
- Eligible?
- —
Personal DTI + credit; lowest rate.
DSCR
20% down · 8.5% · 30yr
- Down + closing
- —
- Monthly P&I
- —
- Monthly cashflow
- —
- DSCR
- —
- Eligible?
- —
No personal income docs; deal must DSCR.
Hard money
10% down · 12.0% · 12mo
- Down + closing
- —
- Monthly P&I
- —
- Monthly cashflow
- —
- DSCR
- —
- Eligible?
- —
Short-term bridge; refi at stabilization.
Rent comps 8 comps
| Address | Beds | Baths | Sqft | Rent | $/sqft | DOM | Units | Dist |
|---|---|---|---|---|---|---|---|---|
| 3147 S Louisville Ave Tulsa, OK | 3.0 | 1.0 | 1350 | $1,395 | $1.03 | 24d | 1 | 0.34mi |
| 3322 E 23rd St Tulsa, OK | 3.0 | 1.0 | 1552 | $1,700 | $1.10 | 3d | 1 | 0.62mi |
| 3519 S Sandusky Ave Tulsa, OK | 3.0 | 2.0 | 1547 | $1,750 | $1.13 | 12d | 1 | 0.69mi |
| 3519 S Sandusky Ave Tulsa, OK | 3.0 | 2.0 | 1547 | $1,750 | $1.13 | 24d | 1 | 0.69mi |
| 3701 S Richmond Ave Tulsa, OK | 4.0 | 2.0 | 1252 | $2,195 | $1.75 | 12d | 1 | 0.90mi |
| 3915 E 38th St Tulsa, OK | 3.0 | 2.0 | 1336 | $1,200 | $0.90 | 10d | 1 | 0.95mi |
| 2923 S Irvington Ave Tulsa, OK | 4.0 | 2.5 | 1786 | $1,750 | $0.98 | 2d | 1 | 1.36mi |
| 2533 E 19th St Tulsa, OK | 3.0 | 2.0 | 1748 | $2,250 | $1.29 | 21d | 1 | 1.47mi |
Listing history 26 events
-
2026-06-18days on market $140,000 Active 142 DOM
-
2026-06-17days on market $140,000 Active 141 DOM
-
2026-06-16days on market $140,000 Active 140 DOM
-
2026-06-15days on market $140,000 Active 139 DOM
-
2026-06-13days on market $140,000 Active 137 DOM
-
2026-06-10days on market $140,000 Active 134 DOM
-
2026-06-09days on market $140,000 Active 133 DOM
-
2026-06-08days on market $140,000 Active 132 DOM
-
2026-06-07days on market $140,000 Active 131 DOM
-
2026-06-05days on market $140,000 Active 128 DOM
-
2026-06-03days on market $140,000 Active 127 DOM
-
2026-06-02days on market $140,000 Active 126 DOM
-
2026-06-01days on market $140,000 Active 125 DOM
-
2026-05-31days on market $140,000 Active 124 DOM
-
2026-04-26status Active
-
2026-04-20status Pending
-
2026-04-02price $140,000
-
2026-02-14status Active
-
2026-02-13status Pending
-
2026-01-20$149,900 Active
-
2025-10-28status Pending
-
2025-10-28historical
-
2025-10-15price $130,000
-
2025-07-09price $175,000
-
2025-06-20$188,000 Active
-
2003-06-19soldstatus $85,000
ⓘ Source: listings_history table (triggers on properties + properties_extension) + one-shot
backfill from property_details.listing_events for pre-trigger history.
Tax reassessment forecast OK · Resets to sale price
- Current annual tax
- $1,480 · $123/mo
- Projected year-2 tax
- $1,480 · $123/mo
- Expected delta
- $0/yr ($0/mo · 0.0%)
ⓘ Screening estimate from a state-policy table — verify with the county assessor before closing.
Climate risk First Street
- Flood 1/10 Low FEMA zone X (unshaded) · 0% chance over 30 yrs
- Wildfire 1/10 Low
- Heat 6/10 Major 7 d/yr ≥110°F today · 18 d/yr by 30 yrs out
- Wind 2/10 Low 4% chance of damaging wind over 30 yrs
- Air quality 2/10 Low 1 unhealthy d/yr today · 1 by 30 yrs out
Nearby sold comps map
Loading sold comps map…
Walkable amenities ~0.75 mi
Loading nearby amenities…
Taxation est. · year 1
- Rental income
- $22,320
- − Mortgage interest
- −$7,842
- − Property taxes
- −$1,480
- − Insurance
- −$700
- − Repairs & maintenance
- −$1,786
- − Management
- −$1,786
- − Depreciation
- −$4,073
- Taxable income
- $4,654
- Est. tax owed @ 24.0%
- −$1,117
- After-tax cash flow
- $5,526/yr
For passive investors: Depreciation is non-cash, so a rental often shows a tax loss while cash-flowing — sheltering income. Rental losses are passive: they offset passive income freely, and up to $25,000/yr can offset ordinary (W-2) income if you actively participate and your MAGI is under $100k (phasing out to $0 by $150k); unused losses carry forward. On sale, claimed depreciation is recaptured at up to 25%, and gains may owe capital-gains tax (a 1031 exchange can defer both). Figures are a year-1 estimate at your 24.0% rate — not tax advice; consult a CPA.
Schools (NCES district)
- District
- Tulsa
- NCES district ID
- 4030240
- Math proficiency
- 7% ▼ -9.00%
- Reading proficiency
- 12% ▼ -7.00%
- Median HH income
- $37,895
- Composite
- 8.04/100
- National rank
- #9919
- State rank
- #250 of 270 in OK
Livability — Tulsa
- Score
- 75/100
- State rank
- #13
- US rank
- #4058
Category grades
Schools grade is shown separately in the Schools card above.
Census & demographics
- Census place
- Tulsa, OK
- County
- Tulsa County · 640,811 people
- City population
- 389,418
- Metro
- Tulsa, OK
- Population (ZIP)
- 15,944
- Household income
- $98,222
- Rent vs Own
- Severe rent burden
- 200.0
Population outlook (Tulsa County) Hauer SSP2
- Today (2025)
- 723,846 people
- By 2030
- 766,033 · +5.8%
- By 2040
- 851,386 · +17.6%
- By 2050
- 938,389 · +29.6%
- By 2075
- 1,166,011 · +61.1%
- By 2100
- 1,350,277 · +86.5%
Race, ethnicity, and origin ACS 2023
- Neighborhood character
- Predominantly White (81%)
- Race & ethnicity
- White 81% Two or more races 11% Hispanic / Latino 6% Native American 4% Black 2% Asian 1%
- Hispanic origin (detail)
- Mexican 2%
- Common ancestry
- Slovak 4% Lithuanian 4% Italian 3%
- Foreign-born
- 5% · Canada
- Languages at home
- 93% English-only · Spanish 4% Other Asian/Pacific 1% French/Haitian/Cajun 1%
Political lean MEDSL · Tulsa
- 2024 margin
- R (+15.2) · D 41.3% · R 56.5% · Other 2.2%
- 2008→2024 swing
- +9.2pp toward D · 2008: -24.5pp · 2024: -15.2pp
- All cycles
- 2024: R+15.2 2020: R+15.6 2016: R+22.9 2012: R+27.4 2008: R+24.5
Not yet ingested
- Civics
- —
Market trends
- HPI YoY
- ▼ -386.32%
- Current HPI
- 237.8036
- Rent YoY
- ▲ 6.24%
- Metro
- Tulsa, OK
- State GDP YoY
- ▲ 1.55%
- F500 in state
- 6
Industry mix (Fortune 500 HQ in OK)
| Industry | F500 HQs | Revenue |
|---|---|---|
| Energy | 3 | $48B |
|
||
Price history
+64.7% since first listed12 events — show timeline
- 2026-04-26 Relisted — MLS Technology, Inc.
- 2026-04-20 Pending — MLS Technology, Inc.
- 2026-04-02 Price Changed $140,000 MLS Technology, Inc.
- 2026-02-14 Relisted — MLS Technology, Inc.
- 2026-02-13 Pending — MLS Technology, Inc.
- 2026-01-20 Listed $149,900 MLS Technology, Inc.
- 2025-10-28 Pending — MLS Technology, Inc.
- 2025-10-28 Listing Removed — MLS Technology, Inc.
- 2025-10-15 Price Changed $130,000 MLS Technology, Inc.
- 2025-07-09 Price Changed $175,000 MLS Technology, Inc.
- 2025-06-20 Listed $188,000 MLS Technology, Inc.
- 2003-06-19 Sold (Public Records) $85,000 Public Records
Property tax history
+2.7%/yrLatest (2025): $1,480 · +8.7% YoY. Source: county tax records.
Cash-flow waterfall
monthlySold comps — $/sqft
last 12 mo · ≤1 miLoading sold comps…