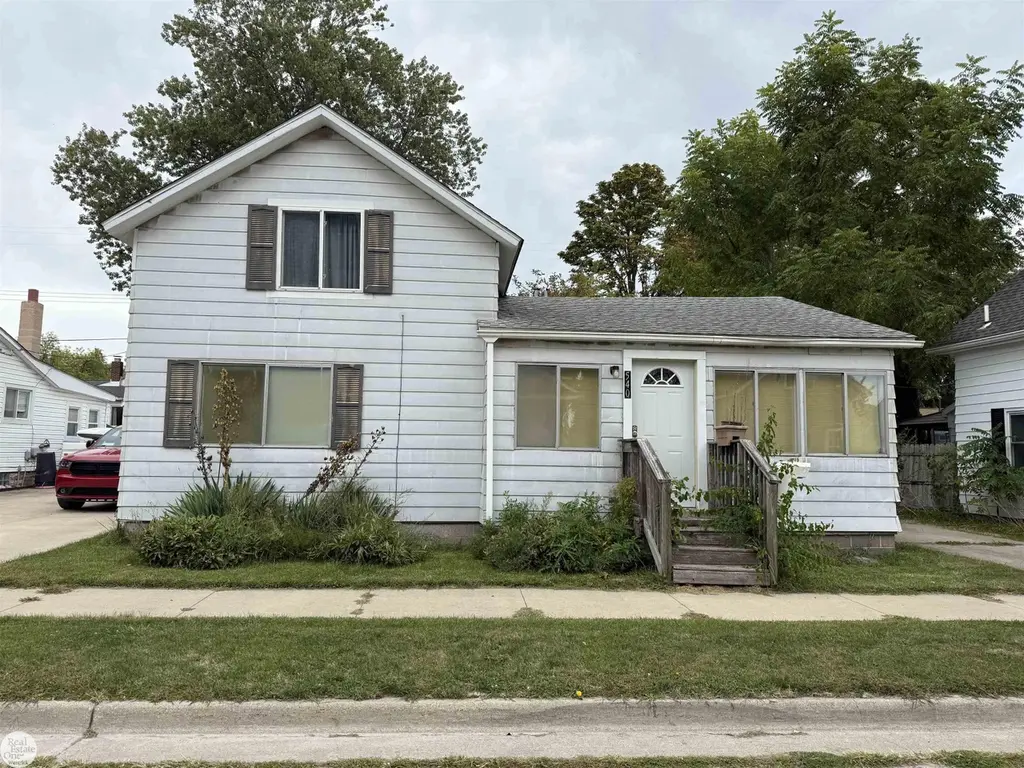
540 Bruce St · Marine City, MI
Flood risk 4/10 · Minor
- FEMA flood zone
- X (unshaded)
- Chance of flooding over 30 yrs
- 0.21%
- Est. flood insurance / yr
- $473 – $860
Fire risk 1/10 · Minimal
- Est. fire insurance / yr
- $784 – $1,456
Heat risk 3/10 · Minor
- Hot days now (above 96°F)
- 7 days/yr
- Hot days in 30 yrs
- 14 days/yr
Wind risk 1/10 · Minimal
- Chance of severe wind over 30 yrs
- —
Air-quality risk 2/10 · Minimal
- Unhealthy air days now
- 1 days/yr
- Unhealthy air days in 30 yrs
- 1 days/yr
Risk factors via First Street. Map © Google.
Why this score? — see what drove the B- grade
The composite is a weighted blend of 9 inputs, each scored 0–100. Each bar is that input's sub-score; the figure is the points it added to the 100-point composite (weight × sub-score).
- Cash flow +30.0/30.0
- 1% rule +10.0/10.0
- DSCR +10.0/10.0
- ARV discount +7.5/15.0
- Livability +3.5/5.0
- Schools +3.4/10.0
- Rent growth +2.5/5.0
- Condition / age +2.5/5.0
- Appreciation +0.0/10.0
$65,000
🖨 Deal sheet 📄 Offer letter ✓ Due diligence
Listing remarks MLS
Marine City, 3 bedroom 1 bath home needs much work but what a great deal. Selling to settle an estate Must be a cash sale. Highest and Best
Key facts
- 3,920 sq ft lot
- Garage
- Listed 7 days
Neighborhood map
What this means for you Summary
Snapshot
- This is a 2-bed/1.0-bath single-family listed at $65k.
Deal economics
- At list price, monthly cash flow is $296 ($4k/yr) — positive.
- The deal already cash-flows at list — no discount required.
- Meets the 1% rule at list price ($1k rent vs $65k).
- Cap rate 11.8% vs local median 3.1% in Marine City — top-decile yield for the area; either an underpriced asset or a hidden risk that comps aren't pricing in. Stress-test before assuming the spread holds.
Location & tenants
- Location reads 70/100 on livability (#309 in MI) — a middle-class / working-renter tenant base. Strengths: cost of living A+, housing A+; Watch: health & safety D, amenities F, commute F.
- East China School District (suburban): math 32% / reading 46% proficiency, ranked #208 of 540 in MI (top 38%) — families likely to look elsewhere, expect single-tenant / working-renter base with shorter leases.
- Market conditions: 65 active listings in the ZIP; 1 comparable units currently listed for rent nearby; 232 units permitted in St. Clair County in 2024 (0 in 5+ unit buildings).
Forward outlook
- Local home prices are declining (-3.0%/yr); year-one equity from $449 of loan paydown is wiped out by about $2k of value loss. Plan a longer hold.
- St. Clair County population projected at -20% by 2050 — secular population decline; favor cash flow + early exit over multi-decade hold.
- At projected returns (-3.0% appreciation + 3.0% rent growth), your $18k cash investment doubles in ~7 years — after that, you're playing with house money.
Negotiation context
- Only 7 days on market — expect competitive offers; lowballing is unlikely to land.
- 4 sale attempts with the ask held roughly flat each time — persistent listings suggest the price (not the market) is what's stuck; bring a comps-based counter.
Questions for the listing agent
- Is there a deadline driving the sale (1031 exchange, divorce, estate, relocation)? That informs how much negotiation room exists.
- What's the average days-on-market for RENTAL listings here right now (not sales)? A rising rental-DOM trend means longer vacancies and softer asking-rent achievability than the comps imply.
- What's the recent tenant-quality profile in this submarket — average credit score on applications, eviction rate, late-payment / NSF rate, and stable-employment percentage? A property-management company in the area should have these aggregated.
- How much new for-sale + rental construction is in the pipeline within 1–3 miles? Heavy new supply typically softens prices + rents 12–24 months out; constrained supply supports both.
Investment metrics
- 1% rule
- 1.54% ✓
- Cap rate
- 11.75%
- Cash-on-cash
- 19.50%
- DSCR
- 1.87
- GRM
- 5.4
CMA / ARV
- ARV (median comp)
- $170,269
- List price
- $65,000
- Delta
- -61.83%
- Verdict
- UNDERPRICED
- Comps
- 20 within 1.0 mi
Show comp detail 11 sales within ~0.75 mi
| Address | Dist | Beds/Ba | Sqft | Sold | Price | $/sf | Match |
|---|---|---|---|---|---|---|---|
| 877 Carroll St | 0.14mi | 3/1.0 (+1) | 960 (+3%) | 11mo | $169,900 | $177 | 75 |
| 809 Brown St | 0.12mi | 3/1.0 (+1) | 1,000 (+7%) | 8mo | $191,000 | $191 | 71 |
| 507 Bruce St | 0.04mi | 2/1.0 | 848 (-9%) | 15mo | $100,000 | $118 | 70 |
| 323 Ward St | 0.30mi | 2/1.0 | 896 (-4%) | 12mo | $153,000 | $171 | 69 |
| 523 Ward St | 0.29mi | 2/1.0 | 800 (-14%) | 4mo | $189,900 | $237 | 59 |
| 140 Bell Ave | 0.26mi | 2/1.0 | 825 (-12%) | 19mo | $90,000 | $109 | 52 |
| 854 S Main St | 0.27mi | 2/1.0 | 832 (-11%) | 20mo | $238,000 | $286 | 52 |
| 151 N 5th St | 0.73mi | 2/1.0 | 950 (+2%) | 14mo | $125,000 | $132 | 51 |
| 715 Lowell St | 0.59mi | 2/2.0 | 960 (+3%) | 20mo | $180,000 | $188 | 48 |
| 118 S Main St | 0.71mi | 3/1.0 (+1) | 1,020 (+9%) | 8mo | $138,000 | $135 | 40 |
| 124 S Third St | 0.63mi | 3/1.0 (+1) | 1,072 (+14%) | 3mo | $189,000 | $176 | 39 |
Match score weights: distance 35% · size 25% · config 20% · recency 20%. Top-matched comps best support the ARV.
Projected returns pro-forma
-3.0% appreciation · 3.0% rent growth · sell at horizon
- IRR
- 11.6%
- Equity multiple
- 1.46×
- Total profit
- $8,347
- Equity at exit
- $9,692
- IRR
- 20.6%
- Equity multiple
- 2.74×
- Total profit
- $31,698
- Equity at exit
- $5,620
Cash invested: $18,200 (down + closing). Projections, not guarantees.
Landlord ↔ Tenant lean methodology
- Overall (STATE)
- 62 Landlord-Friendly
- State Michigan
- 62 Landlord-Friendly · EVEN
- County
- — inherits STATE
- City
- — inherits STATE
ZIP-level market 48039
- Active inventory
- 65
- Price-to-rent
- 5.4×
Monthly cashflow live
- Estimated rent
- $1,000 medium interval (Pro) →
- Mortgage (P&I)
- −$341
- Tax from tax record
- −$126 /mo · $1,515/yr
- Insurance
- −$27
- HOA
- −$0
- Vacancy / Maint / Mgmt
- −$210
- Net cashflow
- $296
Break-even live
UW: 25.0% down · 7.5% · 30yr · 1.5% tax · 5.0% vac · 8.0% maint · 8.0% mgmt
Financing live
Cash to close
- Down payment
- $16,250
- Closing costs
- $1,950
- Reserves months
- —
- Total cash needed
- —
Loan-product check · same deal, 3 products live
Conventional
25% down · 7.5% · 30yr
- Down + closing
- —
- Monthly P&I
- —
- Monthly cashflow
- —
- DSCR
- —
- Eligible?
- —
Personal DTI + credit; lowest rate.
DSCR
20% down · 8.5% · 30yr
- Down + closing
- —
- Monthly P&I
- —
- Monthly cashflow
- —
- DSCR
- —
- Eligible?
- —
No personal income docs; deal must DSCR.
Hard money
10% down · 12.0% · 12mo
- Down + closing
- —
- Monthly P&I
- —
- Monthly cashflow
- —
- DSCR
- —
- Eligible?
- —
Short-term bridge; refi at stabilization.
Rent comps 1 comps
| Address | Beds | Baths | Sqft | Rent | $/sqft | DOM | Units | Dist |
|---|---|---|---|---|---|---|---|---|
| 515 E Saint Clair St Unit 537 Marine City, MI | 2.0 | 1.0 | 800 | $1,000 | $1.25 | 43d | 1 | 0.46mi |
Listing history 8 events
-
2026-05-12status Pending 139-char remark
Show marketing remark (139 chars)
Marine City, 3 bedroom 1 bath home needs much work but what a great deal. Selling to settle an estate Must be a cash sale. Highest and Best
-
2026-05-12status Pending 139-char remark
Show marketing remark (139 chars)
Marine City, 3 bedroom 1 bath home needs much work but what a great deal. Selling to settle an estate Must be a cash sale. Highest and Best
-
2026-05-05status Active 139-char remark
Show marketing remark (139 chars)
Marine City, 3 bedroom 1 bath home needs much work but what a great deal. Selling to settle an estate Must be a cash sale. Highest and Best
-
2026-05-05status Back on Market 139-char remark
Show marketing remark (139 chars)
Marine City, 3 bedroom 1 bath home needs much work but what a great deal. Selling to settle an estate Must be a cash sale. Highest and Best
-
2025-12-09status Pending 139-char remark
Show marketing remark (139 chars)
Marine City, 3 bedroom 1 bath home needs much work but what a great deal. Selling to settle an estate Must be a cash sale. Highest and Best
-
2025-12-09status Pending 139-char remark
Show marketing remark (139 chars)
Marine City, 3 bedroom 1 bath home needs much work but what a great deal. Selling to settle an estate Must be a cash sale. Highest and Best
-
2025-12-09$65,000 Active 139-char remark
Show marketing remark (139 chars)
Marine City, 3 bedroom 1 bath home needs much work but what a great deal. Selling to settle an estate Must be a cash sale. Highest and Best
-
2025-12-08$65,000 Active 139-char remark
Show marketing remark (139 chars)
Marine City, 3 bedroom 1 bath home needs much work but what a great deal. Selling to settle an estate Must be a cash sale. Highest and Best
ⓘ Source: listings_history table (triggers on properties + properties_extension) + one-shot
backfill from property_details.listing_events for pre-trigger history.
Tax reassessment forecast MI · Partial reset (capped growth)
- Current annual tax
- $1,515 · $126/mo
- Projected year-2 tax
- $1,515 · $126/mo
- Expected delta
- $0/yr ($0/mo · 0.0%)
ⓘ Screening estimate from a state-policy table — verify with the county assessor before closing.
Climate risk First Street
- Flood 4/10 Moderate FEMA zone X (unshaded) · 21% chance over 30 yrs
- Wildfire 1/10 Low
- Heat 3/10 Moderate 7 d/yr ≥96°F today · 14 d/yr by 30 yrs out
- Wind 1/10 Low
- Air quality 2/10 Low 1 unhealthy d/yr today · 1 by 30 yrs out
Nearby sold comps map
Loading sold comps map…
Walkable amenities ~0.75 mi
Loading nearby amenities…
Taxation est. · year 1
- Rental income
- $12,000
- − Mortgage interest
- −$3,641
- − Property taxes
- −$1,515
- − Insurance
- −$325
- − Repairs & maintenance
- −$960
- − Management
- −$960
- − Depreciation
- −$1,891
- Taxable income
- $2,708
- Est. tax owed @ 24.0%
- −$650
- After-tax cash flow
- $2,899/yr
For passive investors: Depreciation is non-cash, so a rental often shows a tax loss while cash-flowing — sheltering income. Rental losses are passive: they offset passive income freely, and up to $25,000/yr can offset ordinary (W-2) income if you actively participate and your MAGI is under $100k (phasing out to $0 by $150k); unused losses carry forward. On sale, claimed depreciation is recaptured at up to 25%, and gains may owe capital-gains tax (a 1031 exchange can defer both). Figures are a year-1 estimate at your 24.0% rate — not tax advice; consult a CPA.
Schools (NCES district)
- District
- East China School District
- NCES district ID
- 2612420
- Math proficiency
- 32% ▼ -9.00%
- Reading proficiency
- 46% ▼ -8.00%
- Median HH income
- $56,455
- Composite
- 34.23/100
- National rank
- #5260
- State rank
- #208 of 540 in MI
Livability — Marine City
- Score
- 70/100
- State rank
- #309
- US rank
- #7617
Category grades
Schools grade is shown separately in the Schools card above.
Census & demographics
- Census place
- Marine City, MI
- Population (ZIP)
- 7,466
Population outlook (St. Clair County) Hauer SSP2
- Today (2025)
- 154,587 people
- By 2030
- 150,031 · -2.9%
- By 2040
- 138,177 · -10.6%
- By 2050
- 124,390 · -19.5%
- By 2075
- 95,825 · -38.0%
- By 2100
- 68,672 · -55.6%
Race, ethnicity, and origin ACS 2023
- Neighborhood character
- Predominantly White (96%)
- Race & ethnicity
- White 96% Two or more races 2% Hispanic / Latino 1%
- Common ancestry
- Romanian 12% Lithuanian 8% Slovak 2%
- Foreign-born
- 1% · Canada
Political lean MEDSL · St. Clair
- 2024 margin
- Solid R (+34.6) · D 32.0% · R 66.6% · Other 1.4%
- 2008→2024 swing
- -37.3pp toward R · 2008: 2.6pp · 2024: -34.6pp
- All cycles
- 2024: R+34.6 2020: R+30.2 2016: R+31.4 2012: R+7.1 2008: D+2.6
Not yet ingested
- Civics
- —
Market trends
- HPI YoY
- ▼ -136.09%
- Current HPI
- 166.0692
- Rent YoY
- —
- Metro
- —
- State GDP YoY
- ▲ 1.37%
- F500 in state
- 28
Industry mix (Fortune 500 HQ in MI)
| Industry | F500 HQs | Revenue |
|---|---|---|
| Automotive Parts | 3 | $48B |
|
||
| Automotive | 2 | $372B |
|
||
| Chemicals | 1 | $45B |
|
||
| Automotive Retail | 1 | $29B |
|
||
| Healthcare / Medical Devices | 1 | $23B |
|
||
| Automotive Technology | 1 | $20B |
|
||
Price history
+0.0% since first listed8 events — show timeline
- 2026-05-12 Pending — REALCOMP
- 2026-05-12 Pending — MiRealSource-MiMLS
- 2026-05-05 Relisted — REALCOMP
- 2026-05-05 Relisted — MiRealSource-MiMLS
- 2025-12-09 Pending — REALCOMP
- 2025-12-09 Pending — MiRealSource-MiMLS
- 2025-12-09 Listed $65,000 REALCOMP
- 2025-12-08 Listed $65,000 MiRealSource-MiMLS
Property tax history
+1.3%/yrLatest (2025): $1,515 · -10.5% YoY. Source: county tax records.
Cash-flow waterfall
monthlySold comps — $/sqft
last 12 mo · ≤1 miLoading sold comps…