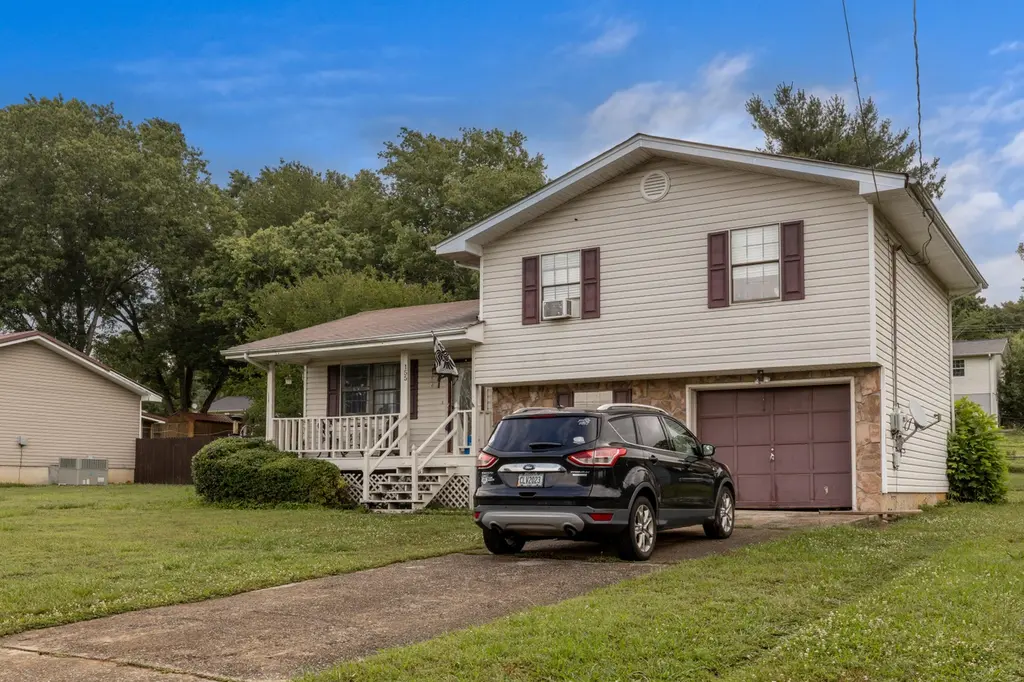
155 Gwen Dr · Indian Springs, GA
Flood risk 1/10 · Minimal
- FEMA flood zone
- X (unshaded)
- Chance of flooding over 30 yrs
- 0.0%
- Est. flood insurance / yr
- $507 – $1,088
Fire risk 5/10 · Moderate
- Est. fire insurance / yr
- $963 – $1,789
Heat risk 6/10 · Moderate
- Hot days now (above 104°F)
- 7 days/yr
- Hot days in 30 yrs
- 20 days/yr
Wind risk 4/10 · Minor
- Chance of severe wind over 30 yrs
- 10.0%
Air-quality risk 3/10 · Minor
- Unhealthy air days now
- 2 days/yr
- Unhealthy air days in 30 yrs
- 2 days/yr
Risk factors via First Street. Map © Google.
Why this score? — see what drove the C grade
The composite is a weighted blend of 9 inputs, each scored 0–100. Each bar is that input's sub-score; the figure is the points it added to the 100-point composite (weight × sub-score).
- Cash flow +20.5/30.0
- ARV discount +15.0/15.0
- DSCR +6.5/10.0
- 1% rule +4.6/10.0
- Rent growth +4.2/5.0
- Schools +3.3/10.0
- Livability +3.2/5.0
- Condition / age +2.5/5.0
- Appreciation +0.0/10.0
$175,000
🖨 Deal sheet 📄 Offer letter ✓ Due diligence
Listing remarks MLS
Coming soon
Key facts
- 0.35 acre lot
- Garage
- Built 1981
Property features AI
Finance
- Other: Living area reported as 1,020 (assessor)
Exterior
- Parking: Attached garage (1 car); Driveway parking; 1 covered parking space (total 1 parking space)
- Utilities: Public water available; Septic tank sewer
- Home design: Single-family residence; Residential property
- Construction: Stone and vinyl siding exterior
- Exterior features: Lot approximately 0.35 acres (100 x 150); Agent-calculated lot dimensions
Interior
- Bedrooms: 3 bedrooms
- Bathrooms: 1 full bathroom; 1 half bathroom
- Heating & cooling: Central heating; Central air conditioning
- Interior features: Three or more levels; Concrete perimeter foundation
Neighborhood map
What this means for you Summary
Snapshot
- This is a 3-bed/1.5-bath single-family listed at $175k.
Deal economics
- At list price, monthly cash flow is $230 ($3k/yr) — positive.
- The deal already cash-flows at list — no discount required.
- To meet the 1% rule (rent ≥ 1% of price), the offer needs to be $168k (3.9% below list).
- Recommended offer: $168k (3.9% below list) — sets the bar for 1% rule.
- Cap rate 7.9% vs local median 4.2% in Indian Springs — top-decile yield for the area; either an underpriced asset or a hidden risk that comps aren't pricing in. Stress-test before assuming the spread holds.
Location & tenants
- Location reads 63/100 on livability (#283 in GA) — a middle-class / working-renter tenant base. Strengths: crime A+, cost of living A+, housing A+; Watch: amenities F, commute F, health & safety F.
- Catoosa County (suburban): math 36% / reading 41% proficiency, ranked #49 of 174 in GA (top 28%) — families likely to look elsewhere, expect single-tenant / working-renter base with shorter leases.
- Zoned schools: Boynton Elementary School (math 43% / reading 57%, grade D+, #255 of 1,228 statewide, top 21%, 602 students, 32% FRL); Heritage High School (math 38% / reading 45%, grade F, #52 of 424 statewide, top 12%, 1,242 students, 23% FRL).
- Market conditions: Rents rising fast (+6.8%/yr); 353 active listings in the ZIP; 7 comparable units currently listed for rent nearby; rentals at typical pace (median 23d on market — plan ~3-4 weeks tenant-placement turnaround); 43% of comp listings sitting > 30 days — soft ceiling on asking rent; solid renter incomes; 848 units permitted in Catoosa County in 2024 (256 in 5+ unit buildings).
Forward outlook
- Local home prices are declining (-3.0%/yr); year-one equity from $1k of loan paydown is wiped out by about $5k of value loss. Plan a longer hold.
- Catoosa County population projected at +5% by 2050 — modest demand growth; plan on rents tracking national, not racing it.
- At projected returns (-3.0% appreciation + 6.8% rent growth), your $49k cash investment doubles in ~10 years — after that, you're playing with house money.
Negotiation context
- Only 7 days on market — expect competitive offers; lowballing is unlikely to land.
- Current owner paid $43k; list at $175k implies a 304% gain — meaningful room to come down on a strong offer.
Risks & watch-outs
- Climate carrying-cost: moderate wildfire risk; extreme-heat days projected 7→20/yr by 2055 (HVAC capex compounding) — expect insurance premiums to compound above CPI over the hold.
Questions for the listing agent
- Is there a deadline driving the sale (1031 exchange, divorce, estate, relocation)? That informs how much negotiation room exists.
- Schools are F-rated, which usually means shorter tenancies and higher turnover. Who's the typical renter profile here, and what's been the actual vacancy rate?
- What's the average days-on-market for RENTAL listings here right now (not sales)? A rising rental-DOM trend means longer vacancies and softer asking-rent achievability than the comps imply.
- What's the recent tenant-quality profile in this submarket — average credit score on applications, eviction rate, late-payment / NSF rate, and stable-employment percentage? A property-management company in the area should have these aggregated.
- How much new for-sale + rental construction is in the pipeline within 1–3 miles? Heavy new supply typically softens prices + rents 12–24 months out; constrained supply supports both.
Investment metrics
- 1% rule
- 0.96% ✗
- Cap rate
- 7.87%
- Cash-on-cash
- 5.63%
- DSCR
- 1.25
- GRM
- 8.7
CMA / ARV
- ARV (on-the-fly)
- $240,720
- Comps found
- 2
Show comp detail 2 sales within ~0.75 mi
| Address | Dist | Beds/Ba | Sqft | Sold | Price | $/sf | Match |
|---|---|---|---|---|---|---|---|
| 400 Mcdonald Dr | 0.62mi | 2/1.0 (-1) | 934 (-8%) | 20mo | $220,000 | $236 | 33 |
| 3108 Highway 41 | 0.47mi | 2/2.5 (-1) | 1,152 (+13%) | 19mo | $227,000 | $197 | 32 |
Match score weights: distance 35% · size 25% · config 20% · recency 20%. Top-matched comps best support the ARV.
Projected returns pro-forma
-3.0% appreciation · 6.84% rent growth · sell at horizon
- IRR
- -3.7%
- Equity multiple
- 0.86×
- Total profit
- $-7,019
- Equity at exit
- $26,093
- IRR
- 9.7%
- Equity multiple
- 1.87×
- Total profit
- $42,537
- Equity at exit
- $15,131
Cash invested: $49,000 (down + closing). Projections, not guarantees.
Landlord ↔ Tenant lean methodology
- Overall (STATE)
- 90 Strongly Landlord-Friendly
- State Georgia
- 90 Strongly Landlord-Friendly · R+3
- County
- — inherits STATE
- City
- — inherits STATE
ZIP-level market 30736
- Home prices YoY
- -21.9%
- Rents YoY
- 6.8%
- Active inventory
- 353
- Price-to-rent
- 8.7×
Monthly cashflow live
- Estimated rent
- $1,682 high interval (Pro) →
- Mortgage (P&I)
- −$918
- Tax from tax record
- −$109 /mo · $1,304/yr
- Insurance
- −$73
- HOA
- −$0
- Vacancy / Maint / Mgmt
- −$353
- Net cashflow
- $230
Break-even live
UW: 25.0% down · 7.5% · 30yr · 1.5% tax · 5.0% vac · 8.0% maint · 8.0% mgmt
Financing live
Cash to close
- Down payment
- $43,750
- Closing costs
- $5,250
- Reserves months
- —
- Total cash needed
- —
Loan-product check · same deal, 3 products live
Conventional
25% down · 7.5% · 30yr
- Down + closing
- —
- Monthly P&I
- —
- Monthly cashflow
- —
- DSCR
- —
- Eligible?
- —
Personal DTI + credit; lowest rate.
DSCR
20% down · 8.5% · 30yr
- Down + closing
- —
- Monthly P&I
- —
- Monthly cashflow
- —
- DSCR
- —
- Eligible?
- —
No personal income docs; deal must DSCR.
Hard money
10% down · 12.0% · 12mo
- Down + closing
- —
- Monthly P&I
- —
- Monthly cashflow
- —
- DSCR
- —
- Eligible?
- —
Short-term bridge; refi at stabilization.
Rent comps 7 comps
| Address | Beds | Baths | Sqft | Rent | $/sqft | DOM | Units | Dist |
|---|---|---|---|---|---|---|---|---|
| 121 N Three Notch Rd Ringgold, GA | 2.0 | 1.0 | 864 | $1,395 | $1.61 | 43d | 1 | 0.35mi |
| 37 Mohawk Trl Ringgold, GA | 4.0 | 2.0 | 1296 | $1,823 | $1.41 | 13d | 1 | 0.67mi |
| 129 Genes Ln Ringgold, GA | 3.0 | 1.0 | 980 | $1,100 | $1.12 | 43d | 1 | 0.76mi |
| 37 Anderson Rd Ringgold, GA | 3.0 | 2.0 | 1500 | $1,699 | $1.13 | 23d | 1 | 1.29mi |
| 57 Clara Dr Ringgold, GA | 2.0 | 2.0 | 1104 | $1,173 | $1.06 | 23d | 1 | 1.37mi |
| 165 Duke Ln Ringgold, GA | 2.0 | 2.0 | 1264 | $1,850 | $1.46 | 43d | 1 | 1.48mi |
| 169 Duke Ln Ringgold, GA | 2.0 | 2.0 | 1271 | $1,900 | $1.49 | 13d | 1 | 1.48mi |
Listing history 18 events
-
2026-06-18days on market $175,000 Active 7 DOM
-
2026-06-17days on market $175,000 Active 6 DOM
-
2026-06-16days on market $175,000 Active 5 DOM
-
2026-06-15days on market $175,000 Active 4 DOM
-
2026-06-14statusdays on market $175,000 Active 2 DOM
-
2026-06-10remarks 699-char remark
-
2026-06-10days on market $175,000 Coming Soon 14 DOM
-
2026-06-09days on market $175,000 Coming Soon 13 DOM
-
2026-06-08days on market $175,000 Coming Soon 12 DOM
-
2026-06-07days on market $175,000 Coming Soon 11 DOM
-
2026-06-03days on market $175,000 Coming Soon 7 DOM
-
2026-06-02days on market $175,000 Coming Soon 6 DOM
-
2026-06-01days on market $175,000 Coming Soon 5 DOM
-
2026-05-31days on market $175,000 Coming Soon 4 DOM
-
2026-05-30days on market $175,000 Coming Soon 3 DOM
-
2026-05-27historical $175,000 11-char remark
Show marketing remark (11 chars)
Coming soon
-
2026-05-27historical $175,000
Show marketing remark (11 chars)
Coming soon
-
1982-04-01soldstatus $43,300
ⓘ Source: listings_history table (triggers on properties + properties_extension) + one-shot
backfill from property_details.listing_events for pre-trigger history.
Tax reassessment forecast GA · Resets to sale price
- Current annual tax
- $1,304 · $109/mo
- Projected year-2 tax
- $1,610 · $134/mo
- Expected delta
- +$306/yr (+$26/mo · 23.5%)
ⓘ Screening estimate from a state-policy table — verify with the county assessor before closing.
Climate risk First Street
- Flood 1/10 Low FEMA zone X (unshaded) · 0% chance over 30 yrs
- Wildfire 5/10 Major
- Heat 6/10 Major 7 d/yr ≥104°F today · 20 d/yr by 30 yrs out
- Wind 4/10 Moderate 10% chance of damaging wind over 30 yrs
- Air quality 3/10 Moderate 2 unhealthy d/yr today · 2 by 30 yrs out
Nearby sold comps map
Loading sold comps map…
Walkable amenities ~0.75 mi
Loading nearby amenities…
Taxation est. · year 1
- Rental income
- $20,187
- − Mortgage interest
- −$9,803
- − Property taxes
- −$1,304
- − Insurance
- −$875
- − Repairs & maintenance
- −$1,615
- − Management
- −$1,615
- − Depreciation
- −$5,091
- Taxable loss
- −$115
- Est. tax savings @ 24.0%
- +$28
- After-tax cash flow
- $2,784/yr
For passive investors: Depreciation is non-cash, so a rental often shows a tax loss while cash-flowing — sheltering income. Rental losses are passive: they offset passive income freely, and up to $25,000/yr can offset ordinary (W-2) income if you actively participate and your MAGI is under $100k (phasing out to $0 by $150k); unused losses carry forward. On sale, claimed depreciation is recaptured at up to 25%, and gains may owe capital-gains tax (a 1031 exchange can defer both). Figures are a year-1 estimate at your 24.0% rate — not tax advice; consult a CPA.
Schools (NCES district)
- District
- Catoosa County
- NCES district ID
- 1300930
- Math proficiency
- 36% ▼ -15.00%
- Reading proficiency
- 41% ▼ -8.00%
- Median HH income
- $48,913
- Composite
- 33.13/100
- National rank
- #5558
- State rank
- #49 of 174 in GA
Livability — Indian Springs
- Score
- 63/100
- State rank
- #283
- US rank
- #15251
Category grades
Schools grade is shown separately in the Schools card above.
Census & demographics
- Census place
- Indian Springs, GA
- County
- Catoosa County · 52,244 people
- Metro
- Chattanooga, TN-GA
- Population (ZIP)
- 44,499
- Household income
- $83,821
- Rent vs Own
- Severe rent burden
- 559.0
Population outlook (Catoosa County) Hauer SSP2
- Today (2025)
- 70,112 people
- By 2030
- 71,621 · +2.2%
- By 2040
- 73,595 · +5.0%
- By 2050
- 73,921 · +5.4%
- By 2075
- 72,135 · +2.9%
- By 2100
- 65,979 · -5.9%
Race, ethnicity, and origin ACS 2023
- Neighborhood character
- Predominantly White (89%)
- Race & ethnicity
- White 89% Two or more races 5% Hispanic / Latino 3% Black 2% Asian 1%
- Common ancestry
- Slovak 2% Italian 2% Serbian 2%
- Foreign-born
- 2% · Canada
- Languages at home
- 96% English-only · Spanish 2% Russian/Polish/Slavic 1%
Political lean MEDSL · Catoosa
- 2024 margin
- Solid R (+55.5) · D 22.0% · R 77.5%
- 2008→2024 swing
- -5.7pp toward R · 2008: -49.8pp · 2024: -55.5pp
- All cycles
- 2024: R+55.5 2020: R+56.0 2016: R+60.7 2012: R+52.8 2008: R+49.8
Not yet ingested
- Civics
- —
Market trends
- HPI YoY
- ▼ -70.42%
- Current HPI
- 251.8824
- Rent YoY
- ▲ 6.84%
- Metro
- Chattanooga, TN-GA
- State GDP YoY
- ▲ 2.66%
- F500 in state
- 28
Industry mix (Fortune 500 HQ in GA)
| Industry | F500 HQs | Revenue |
|---|---|---|
| Paper / Packaging | 2 | $29B |
|
||
| Retail | 1 | $160B |
|
||
| Transportation / Logistics | 1 | $91B |
|
||
| Airlines | 1 | $62B |
|
||
| Consumer Goods | 1 | $47B |
|
||
| Utilities | 1 | $25B |
|
||
Price history
+304.2% since first listed3 events — show timeline
- 2026-05-27 Coming Soon $175,000 GCAR
- 2026-05-27 Coming Soon $175,000 REALTRACS as Distributed by MLS Grid
- 1982-04-01 Sold (Public Records) $43,300 Public Records
Property tax history
+5.5%/yrLatest (2025): $1,304 · +6.6% YoY. Source: county tax records.
Cash-flow waterfall
monthlySold comps — $/sqft
last 12 mo · ≤1 miLoading sold comps…