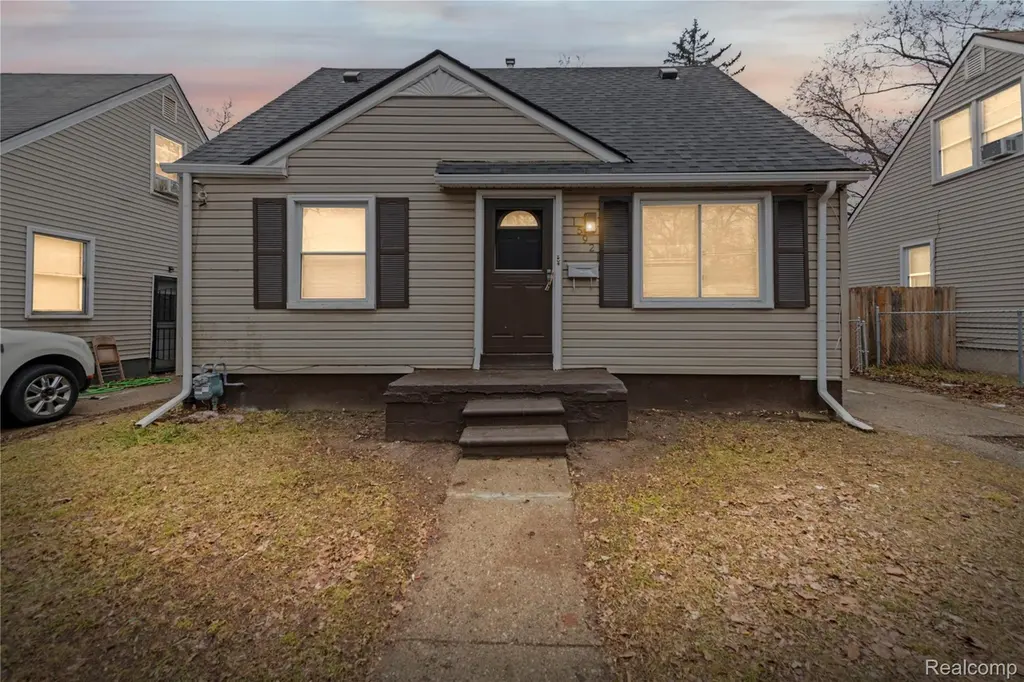
15921 Bramell St · Detroit, MI
Flood risk 1/10 · Minimal
- FEMA flood zone
- X (unshaded)
- Chance of flooding over 30 yrs
- 0.0%
- Est. flood insurance / yr
- $473 – $860
Fire risk 1/10 · Minimal
- Est. fire insurance / yr
- $784 – $1,456
Heat risk 3/10 · Minor
- Hot days now (above 98°F)
- 7 days/yr
- Hot days in 30 yrs
- 15 days/yr
Wind risk 2/10 · Minimal
- Chance of severe wind over 30 yrs
- —
Air-quality risk 3/10 · Minor
- Unhealthy air days now
- 2 days/yr
- Unhealthy air days in 30 yrs
- 3 days/yr
Risk factors via First Street. Map © Google.
Why this score? — see what drove the C grade
The composite is a weighted blend of 9 inputs, each scored 0–100. Each bar is that input's sub-score; the figure is the points it added to the 100-point composite (weight × sub-score).
- Cash flow +30.0/30.0
- DSCR +10.0/10.0
- 1% rule +8.6/10.0
- Livability +3.7/5.0
- Rent growth +2.5/5.0
- Condition / age +2.5/5.0
- Schools +1.3/10.0
- ARV discount +0.0/15.0
- Appreciation +0.0/10.0
$89,500
🖨 Deal sheet 📄 Offer letter ✓ Due diligence
Listing remarks MLS
LOCATED JUST 5 MINUTES FROM THE HISTORIC ROSEDALE PARK YOU WILL FIND 15921 BRAMELL NESTLED ON A HUGE 5,227 SQUARE FOOT LOT IN A QUIET NEIGHBORHOOD OF HOMEOWNERS. THIS CROWN JEWEL BOAST A BRAND NEW 40 YEAR TEAR OFF ROOF PROTECTING A 3 BEDROOM UNITS EVERY WINDOW IN THIS COMPOUND HADS BEEN REPLACED WITH VINYL CLAD INSULATED WINDOWS. SHE ALSO HAS BEEN CAREFULLY UPGRADED WITH NEWLY INSTALLED FURNACES AND HOT WATER TANK. IN ADDITION, THIS GEM SHOWCASES ALL NEW ELECTRICAL AND PLUMBING TO INSURE MAINTENANCE FREE CASH FLOW. THIS BEAUTY HAS JUST BEEN LEASED WITH SECTION 8 TENANTS AND THE MONTHLY DIVIDENDS OF $1493 ARE PAID IN FULL BY THE FEDERAL GOVERNMENT. TENANTS PAY ALL THE UTILITIES WHICH ALLOWS THIS INVESTMENT TO PAY A RETURN OF JUST UNDER 20%. THE TAXES HAVE BEEN REDUCED TO ROUGHLY $100 PER MONTH. THIS DIAMOND WILL BE WRAPPED AROUND A LUCKY OWNER'S FINGER SOON! NO SHOWINGS WITHOUT ACCEPTED FULL LIST OFFER.
Key facts
- All new electrical
- Brand new roof
- New hot water tank
Tags
Property features AI
Exterior
- Parking: No garage
- Utilities: Public water; Public sewer
- Home design: Single-family residence; One-and-a-half story; Ground-level entry with steps; Vinyl siding
- Construction: Vinyl siding construction
- Exterior features: Paved road access; Lot approximately 40 x 125 (0.12 acres)
Interior
- Bathrooms: One full bathroom
- Heating & cooling: Forced air heating; Natural gas heating; No central cooling
- Interior features: Unfinished basement; Three total rooms
Neighborhood map
What this means for you Summary
Snapshot
- This is a 3-bed/1.0-bath single-family listed at $90k.
Deal economics
- At list price, monthly cash flow is $395 ($5k/yr) — positive.
- The deal already cash-flows at list — no discount required.
- Meets the 1% rule at list price ($1k rent vs $90k).
- Recommended offer: $88k (1.5% below list) — sets the bar for market timing.
Location & tenants
- Location reads 73/100 on livability (#218 in MI) — a middle-class / working-renter tenant base. Strengths: amenities A+, commute A+, cost of living A+; Watch: schools F, crime F, employment F.
- Detroit Public Schools Community District (urban): math 10% / reading 24% proficiency, ranked #499 of 540 in MI (top 92%) — low school quality limits family demand, transient renter base, plan for 1-2y turnover; 90% free/reduced lunch — lower-income household profile, screen leases tightly.
- Market conditions: 158 active listings in the ZIP; 40 comparable units currently listed for rent nearby; rentals lingering (median 44d on market — plan ~5-8 weeks vacancy on turnover, expect pricing pressure); 60% of comp listings sitting > 30 days — soft ceiling on asking rent; lower-income renter base — watch delinquency; 2,639 units permitted in Wayne County in 2024 (1,216 in 5+ unit buildings).
- This rent runs 33% of the median local income ($45k/yr) — at the standard rent-burdened threshold; future hikes will face affordability resistance.
Forward outlook
- Local home prices are declining (-3.0%/yr); year-one equity from $619 of loan paydown is wiped out by about $3k of value loss. Plan a longer hold.
- Wayne County population projected at -17% by 2050 — secular population decline; favor cash flow + early exit over multi-decade hold.
- At projected returns (-3.0% appreciation + 3.0% rent growth), your $25k cash investment doubles in ~7 years — after that, you're playing with house money.
Negotiation context
- It's been on market 20 days — a 2% lower offer ($88k) is reasonable based on typical stale-listing flexibility.
- 6 sale attempts since 14y ago with the ask held roughly flat each time — persistent listings suggest the price (not the market) is what's stuck; bring a comps-based counter.
- Current owner paid $25k; list at $90k implies a 258% gain — meaningful room to come down on a strong offer.
Risks & watch-outs
- Watch-outs: built in 1951 — expect roof / HVAC / electrical / plumbing capex.
Questions for the listing agent
- Built in 1951 — when were the roof, HVAC, electrical panel, plumbing, and water heater last replaced?
- Is there a deadline driving the sale (1031 exchange, divorce, estate, relocation)? That informs how much negotiation room exists.
- Schools are F-rated, which usually means shorter tenancies and higher turnover. Who's the typical renter profile here, and what's been the actual vacancy rate?
- Crime grade is F in this area — have there been break-ins, vandalism, or insurance claims at this property in the last 3 years? What carrier currently insures it and at what premium?
- What's the average days-on-market for RENTAL listings here right now (not sales)? A rising rental-DOM trend means longer vacancies and softer asking-rent achievability than the comps imply.
- What's the recent tenant-quality profile in this submarket — average credit score on applications, eviction rate, late-payment / NSF rate, and stable-employment percentage? A property-management company in the area should have these aggregated.
- How much new for-sale + rental construction is in the pipeline within 1–3 miles? Heavy new supply typically softens prices + rents 12–24 months out; constrained supply supports both.
Investment metrics
- 1% rule
- 1.36% ✓
- Cap rate
- 11.59%
- Cash-on-cash
- 18.92%
- DSCR
- 1.84
- GRM
- 6.1
CMA / ARV
- ARV (on-the-fly)
- $61,812
- Comps found
- 12
Show comp detail 12 sales within ~0.75 mi
| Address | Dist | Beds/Ba | Sqft | Sold | Price | $/sf | Match |
|---|---|---|---|---|---|---|---|
| 16555 Bramell St | 0.21mi | 3/1.0 | 918 (+1%) | 3mo | $60,000 | $65 | 87 |
| 15757 Dacosta St | 0.25mi | 3/1.0 | 960 (+6%) | 2mo | $65,000 | $68 | 77 |
| 15900 W Parkway St | 0.09mi | 3/1.0 | 1,000 (+10%) | 9mo | $70,000 | $70 | 72 |
| 15451 Grayfield St | 0.39mi | 3/1.0 | 920 (+1%) | 11mo | $17,050 | $19 | 70 |
| 16165 W Parkway St | 0.16mi | 3/1.0 | 1,022 (+12%) | 5mo | $50,000 | $49 | 67 |
| 15835 Burgess St | 0.52mi | 3/1.0 | 918 (+1%) | 9mo | $93,000 | $101 | 67 |
| 16804 Dolphin St | 0.48mi | 3/2.0 | 943 (+4%) | 10mo | $75,000 | $80 | 59 |
| 15044 Dacosta St | 0.67mi | 3/1.0 | 890 (-2%) | 11mo | $87,000 | $98 | 56 |
| 22482 W Mcnichols Rd | 0.53mi | 3/1.5 | 1,031 (+13%) | 2mo | $61,000 | $59 | 49 |
| 15411 Lahser Rd | 0.53mi | 3/2.0 | 1,025 (+13%) | 4mo | $42,000 | $41 | 47 |
| 15361 Grayfield St | 0.46mi | 2/2.0 (-1) | 815 (-10%) | 10mo | $30,000 | $37 | 43 |
| 24255 Puritan | 0.73mi | 2/1.0 (-1) | 855 (-6%) | 10mo | $129,999 | $152 | 42 |
Match score weights: distance 35% · size 25% · config 20% · recency 20%. Top-matched comps best support the ARV.
Projected returns pro-forma
-3.0% appreciation · 3.0% rent growth · sell at horizon
- IRR
- 10.8%
- Equity multiple
- 1.43×
- Total profit
- $10,656
- Equity at exit
- $13,345
- IRR
- 19.8%
- Equity multiple
- 2.66×
- Total profit
- $41,639
- Equity at exit
- $7,738
Cash invested: $25,060 (down + closing). Projections, not guarantees.
Landlord ↔ Tenant lean methodology
- Overall (STATE)
- 62 Landlord-Friendly
- State Michigan
- 62 Landlord-Friendly · EVEN
- County
- — inherits STATE
- City
- — inherits STATE
ZIP-level market 48223
- Active inventory
- 158
- Price-to-rent
- 6.1×
Monthly cashflow live
- Estimated rent
- $1,219 high interval (Pro) →
- Mortgage (P&I)
- −$469
- Tax from tax record
- −$62 /mo · $738/yr
- Insurance
- −$37
- HOA
- −$0
- Vacancy / Maint / Mgmt
- −$256
- Net cashflow
- $395
Break-even live
UW: 25.0% down · 7.5% · 30yr · 1.5% tax · 5.0% vac · 8.0% maint · 8.0% mgmt
Financing live
Cash to close
- Down payment
- $22,375
- Closing costs
- $2,685
- Reserves months
- —
- Total cash needed
- —
Loan-product check · same deal, 3 products live
Conventional
25% down · 7.5% · 30yr
- Down + closing
- —
- Monthly P&I
- —
- Monthly cashflow
- —
- DSCR
- —
- Eligible?
- —
Personal DTI + credit; lowest rate.
DSCR
20% down · 8.5% · 30yr
- Down + closing
- —
- Monthly P&I
- —
- Monthly cashflow
- —
- DSCR
- —
- Eligible?
- —
No personal income docs; deal must DSCR.
Hard money
10% down · 12.0% · 12mo
- Down + closing
- —
- Monthly P&I
- —
- Monthly cashflow
- —
- DSCR
- —
- Eligible?
- —
Short-term bridge; refi at stabilization.
Rent comps 40 comps
| Address | Beds | Baths | Sqft | Rent | $/sqft | DOM | Units | Dist |
|---|---|---|---|---|---|---|---|---|
| 15847 Chatham St Detroit, MI | 3.0 | 1.0 | 909 | $1,325 | $1.46 | 5d | 1 | 0.08mi |
| 16700 Lahser Rd Apt 18 Detroit, MI | 2.0 | 1.0 | 750 | $900 | $1.20 | 43d | 1 | 0.51mi |
| 16131 Dale St Detroit, MI | 3.0 | 1.0 | 1100 | $1,500 | $1.36 | 17d | 1 | 0.56mi |
| 16800 Telegraph Rd Detroit, MI | 2.0 | 1.0 | 775 | $875 | $1.13 | 43d | 1 | 0.67mi |
| 16207 Woodbine St Detroit, MI | 3.0 | 1.0 | 1000 | $1,294 | $1.29 | 5d | 1 | 0.70mi |
| 16581 Wormer St Detroit, MI | 2.0 | 1.0 | 720 | $1,100 | $1.53 | 43d | 1 | 0.80mi |
| 16800 Wormer St Detroit, MI | 3.0 | 1.0 | 912 | $1,250 | $1.37 | 17d | 1 | 0.81mi |
| 16717 Trinity St Detroit, MI | 3.0 | 1.5 | 1101 | $1,250 | $1.14 | 43d | 1 | 0.88mi |
| 17274 Bentler St #46 Detroit, MI | 2.0 | 1.0 | 700 | $850 | $1.21 | 16d | 1 | 0.95mi |
| 17274 Bentler St Detroit, MI | 2.0 | 1.0 | 700 | $850 | $1.21 | 43d | 2 | 0.95mi |
| 17274 Bentler St Detroit, MI | 2.0 | 1.0 | 700 | $838 | $1.20 | 24d | 2 | 0.95mi |
| 17270 Bentler St Detroit, MI | 2.0 | 1.0 | 650 | $850 | $1.31 | 43d | 1 | 0.96mi |
| 15490 Dixie Redford, MI | 3.0 | 1.0 | 912 | $1,600 | $1.75 | 5d | 1 | 0.99mi |
| 22241 Lyndon St Detroit, MI | 3.0 | 1.0 | 960 | $1,100 | $1.15 | 16d | 1 | 1.01mi |
| 21440 Bennett St Detroit, MI | 3.0 | 1.0 | 1037 | $1,394 | $1.34 | 16d | 1 | 1.05mi |
| 15340 Braile St Detroit, MI | 3.0 | 1.0 | 883 | $1,000 | $1.13 | 5d | 1 | 1.11mi |
| 21451 Glenco St Detroit, MI | 3.0 | 1.0 | 1026 | $1,400 | $1.36 | 16d | 1 | 1.13mi |
| 18025 Bentler St Detroit, MI | 3.0 | 1.0 | 728 | $1,250 | $1.72 | 24d | 1 | 1.13mi |
| 16194 Fielding St Unit 2 Detroit, MI | 2.0 | 1.0 | 750 | $950 | $1.27 | 15d | 1 | 1.15mi |
| 14280 Bramell St Detroit, MI | 3.0 | 1.0 | 1100 | $1,500 | $1.36 | 16d | 1 | 1.15mi |
| 17324 Salem St Detroit, MI | 2.0 | 1.0 | 989 | $1,200 | $1.21 | 24d | 1 | 1.24mi |
| 17721 Westbrook St Detroit, MI | 4.0 | 1.0 | 1040 | $1,125 | $1.08 | 24d | 1 | 1.24mi |
| 21434 Karl St Detroit, MI | 2.0 | 1.0 | 1000 | $1,350 | $1.35 | 43d | 1 | 1.28mi |
| 14268 Riverview St Detroit, MI | 2.0 | 1.0 | 900 | $850 | $0.94 | 43d | 1 | 1.28mi |
| 14264 Riverview St Detroit, MI | 2.0 | 1.0 | 900 | $900 | $1.00 | 43d | 1 | 1.28mi |
| 14260 Riverview St Detroit, MI | 2.0 | 1.0 | 900 | $900 | $1.00 | 43d | 1 | 1.28mi |
| 14262 Riverview St Detroit, MI | 2.0 | 1.0 | 900 | $985 | $1.09 | 43d | 1 | 1.28mi |
| 14266 Riverview St Detroit, MI | 2.0 | 1.0 | 900 | $900 | $1.00 | 43d | 1 | 1.28mi |
| 14224 Riverview St Detroit, MI | 2.0 | 1.0 | 900 | $1,050 | $1.17 | 43d | 1 | 1.29mi |
| 14226 Riverview St Detroit, MI | 2.0 | 1.0 | 900 | $1,050 | $1.17 | 43d | 1 | 1.29mi |
| 14238 Riverview St Detroit, MI | 2.0 | 1.0 | 900 | $900 | $1.00 | 43d | 1 | 1.29mi |
| 14228 Riverview St Detroit, MI | 2.0 | 1.0 | 900 | $1,050 | $1.17 | 43d | 1 | 1.29mi |
| 14230 Riverview St Detroit, MI | 2.0 | 1.0 | 900 | $1,050 | $1.17 | 43d | 1 | 1.29mi |
| 14234 Riverview St Detroit, MI | 2.0 | 1.0 | 900 | $1,050 | $1.17 | 43d | 1 | 1.29mi |
| 14222 Riverview St Detroit, MI | 2.0 | 1.0 | 900 | $1,050 | $1.17 | 43d | 1 | 1.29mi |
| 14258 Riverview St Detroit, MI | 2.0 | 1.0 | 900 | $900 | $1.00 | 43d | 1 | 1.29mi |
| 14240 Riverview St Detroit, MI | 2.0 | 1.0 | 900 | $900 | $1.00 | 43d | 1 | 1.29mi |
| 14244 Riverview St Detroit, MI | 2.0 | 1.0 | 900 | $900 | $1.00 | 43d | 1 | 1.29mi |
| 14246 Riverview St Unit A Detroit, MI | 2.0 | 1.0 | 900 | $985 | $1.09 | 43d | 1 | 1.29mi |
| 14246 Riverview St Unit RB Detroit, MI | 2.0 | 1.0 | 900 | $895 | $0.99 | 43d | 1 | 1.29mi |
Listing history 13 events
-
2026-06-18days on market $89,500 Active 20 DOM
-
2026-06-17days on market $89,500 Active 19 DOM
-
2026-06-15pricedays on market $89,500 Active 17 DOM
-
2026-06-13days on market $90,000 Active 15 DOM
-
2026-06-13days on market $90,000 Active 14 DOM
-
2026-06-09days on market $90,000 Active 11 DOM
-
2026-06-08days on market $90,000 Active 10 DOM
-
2026-06-07days on market $90,000 Active 9 DOM
-
2026-06-04days on market $90,000 Active 6 DOM
-
2026-06-03days on market $90,000 Active 5 DOM
-
2026-06-02days on market $90,000 Active 4 DOM
-
2026-06-01days on market $90,000 Active 3 DOM
-
2026-05-31days on market $90,000 Active 2 DOM
ⓘ Source: listings_history table (triggers on properties + properties_extension) + one-shot
backfill from property_details.listing_events for pre-trigger history.
Tax reassessment forecast MI · Partial reset (capped growth)
- Current annual tax
- $738 · $62/mo
- Projected year-2 tax
- $1,058 · $88/mo
- Expected delta
- +$320/yr (+$27/mo · 43.3%)
ⓘ Screening estimate from a state-policy table — verify with the county assessor before closing.
Climate risk First Street
- Flood 1/10 Low FEMA zone X (unshaded) · 0% chance over 30 yrs
- Wildfire 1/10 Low
- Heat 3/10 Moderate 7 d/yr ≥98°F today · 15 d/yr by 30 yrs out
- Wind 2/10 Low
- Air quality 3/10 Moderate 2 unhealthy d/yr today · 3 by 30 yrs out
Nearby sold comps map
Loading sold comps map…
Walkable amenities ~0.75 mi
Loading nearby amenities…
Taxation est. · year 1
- Rental income
- $14,634
- − Mortgage interest
- −$5,013
- − Property taxes
- −$738
- − Insurance
- −$448
- − Repairs & maintenance
- −$1,171
- − Management
- −$1,171
- − Depreciation
- −$2,604
- Taxable income
- $3,489
- Est. tax owed @ 24.0%
- −$837
- After-tax cash flow
- $3,905/yr
For passive investors: Depreciation is non-cash, so a rental often shows a tax loss while cash-flowing — sheltering income. Rental losses are passive: they offset passive income freely, and up to $25,000/yr can offset ordinary (W-2) income if you actively participate and your MAGI is under $100k (phasing out to $0 by $150k); unused losses carry forward. On sale, claimed depreciation is recaptured at up to 25%, and gains may owe capital-gains tax (a 1031 exchange can defer both). Figures are a year-1 estimate at your 24.0% rate — not tax advice; consult a CPA.
Schools (NCES district)
- District
- Detroit Public Schools Community District
- NCES district ID
- 2601103
- Math proficiency
- 10% ▼ -2.00%
- Reading proficiency
- 24% ▲ 6.00%
- Median HH income
- $25,815
- Composite
- 13.06/100
- National rank
- #9564
- State rank
- #499 of 540 in MI
Livability — Detroit
- Score
- 73/100
- State rank
- #218
- US rank
- #5427
Category grades
Schools grade is shown separately in the Schools card above.
Census & demographics
- Census place
- Detroit, MI
- County
- Wayne County · 1,562,939 people
- City population
- 572,865
- Metro
- Detroit-Warren-Dearborn, MI
- Population (ZIP)
- 22,622
- Household income
- $44,512
- Rent vs Own
- Severe rent burden
- 1151.0
Population outlook (Wayne County) Hauer SSP2
- Today (2025)
- 1,675,273 people
- By 2030
- 1,620,300 · -3.3%
- By 2040
- 1,502,341 · -10.3%
- By 2050
- 1,384,039 · -17.4%
- By 2075
- 1,124,592 · -32.9%
- By 2100
- 881,193 · -47.4%
Race, ethnicity, and origin ACS 2023
- Neighborhood character
- Predominantly Black (86%)
- Race & ethnicity
- Black 86% White 7% Two or more races 5% Hispanic / Latino 2%
- Common ancestry
- Romanian 1% Iranian 1%
- Foreign-born
- 1% · Canada
- Languages at home
- 97% English-only · Spanish 2%
Political lean MEDSL · Wayne
- 2024 margin
- Strong D (+29.0) · D 62.7% · R 33.7% · Other 3.6%
- 2008→2024 swing
- -20.5pp toward R · 2008: 49.5pp · 2024: 29.0pp
- All cycles
- 2024: D+29.0 2020: D+38.1 2016: D+37.3 2012: D+46.9 2008: D+49.5
Not yet ingested
- Civics
- —
Market trends
- HPI YoY
- ▼ -303.41%
- Current HPI
- 138.2779
- Rent YoY
- —
- Metro
- Detroit-Warren-Dearborn, MI
- State GDP YoY
- ▲ 1.37%
- F500 in state
- 28
Industry mix (Fortune 500 HQ in MI)
| Industry | F500 HQs | Revenue |
|---|---|---|
| Automotive Parts | 3 | $48B |
|
||
| Automotive | 2 | $372B |
|
||
| Chemicals | 1 | $45B |
|
||
| Automotive Retail | 1 | $29B |
|
||
| Healthcare / Medical Devices | 1 | $23B |
|
||
| Automotive Technology | 1 | $20B |
|
||
Price history
+350.0% since first listed14 events — show timeline
- 2026-05-27 Listed $90,000 REALCOMP
- 2026-05-27 Listed $90,000 MiRealSource-MiMLS
- 2025-08-05 Sold (MLS) $25,000 MiRealSource-MiMLS
- 2025-08-05 Sold (MLS) $25,000 REALCOMP
- 2025-07-22 Pending — MiRealSource-MiMLS
- 2025-07-22 Pending — REALCOMP
- 2025-07-08 Listed $29,900 REALCOMP
- 2025-07-07 Listed $29,900 MiRealSource-MiMLS
- 2012-12-20 Sold (MLS) $2,900 MiRealSource-MiMLS
- 2012-12-20 Sold (MLS) $2,900 REALCOMP
- 2012-11-09 Listing Removed — MiRealSource-MiMLS
- 2012-10-26 Listed $2,900 MiRealSource-MiMLS
- 2012-10-26 Listed $2,900 REALCOMP
- 1994-09-26 Sold (Public Records) $20,000 Public Records
Property tax history
-4.4%/yrLatest (2025): $738 · -54.5% YoY. Source: county tax records.
Cash-flow waterfall
monthlySold comps — $/sqft
last 12 mo · ≤1 miLoading sold comps…